 AI insights
 About us
 Careers
 Security
 Customer reviews
 Contact us
 Affiliate program
 Solution partners
 Looker Studio templates
 Tableau templates
 Facebook Ads templates
 Google Ads templates
 Data fields & Metrics
 AI prompt library & Guides
 Product documentation
 API documentation
 Case studies
 Blog
Blog Data models
 Windsor vs Supermetrics
 Windsor vs Fivetran
 Windsor vs Portermetrics
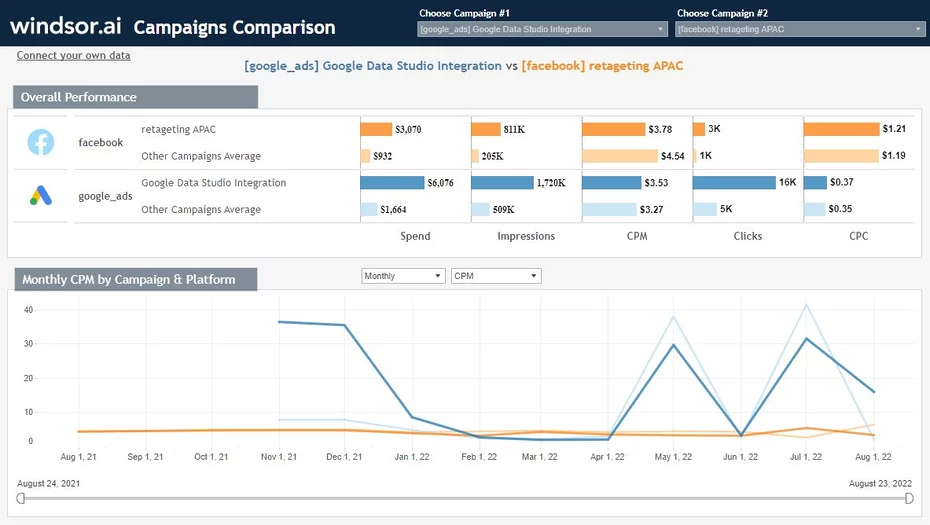
Our Compare Campaigns Performance Dashboard Template for Tableau helps you to get a simple one page overview on how campaigns perform, even if they are ran across different platforms (ex. Facebook Ads, Google Ads, LinkedIn Ads, TikTok Ads, Youtube Ads, etc). This is possible using the data blending provided by the Windsor.ai engine, which is then passed to Tableau through a single Web Data Connector (so you don’t have to blend the data in Tableau).
The dashboard provides insights on a channel and campaign level. You can make additional dimensions and metrics available by customising the dashboard once you copy it.
Please take note that this dashboard requires Google Analytics to work. It connects the channels listed below and connects the Google Analytics reported conversions with the Facebook Ads and Google Ads spending, clicks and impressions data. You will need to have your Facebook Ads properly tagged for this to work. More information on how to tag Facebook Ads for Google Analytics.
This Compare Campaign Performance dashboard can be integrated with the following data sources
To start using it:
Open the Compare Campaigns Performance Tableau template and follow the instructions on the Documentation page
Please make sure to check all the filters so you get the data visualized correctly.
You might also be interested in…
- Best PPC Report Templates
- Free Google Ads Dashboard Templates
- Free Facebook Ads Report Templates
- Free Youtube Dashboard Templates
- Free GA4 Report Templates
- Free TikTok Ads Report Templates
- Power BI vs Tableau in 2023: Know The Key Differences
- Free Ecommerce Report Templates
- Free Web Analytics Report Templates
- Free Content Marketing Report Templates
- Free Client Report Report Templates
- Free SEM Report Templates
- Free Email Marketing Report Templates