 AI insights
 About us
 Careers
 Security
 Customer reviews
 Contact us
 Affiliate program
 Solution partners
 Looker Studio templates
 Tableau templates
 Facebook Ads templates
 Google Ads templates
 Data fields & Metrics
 AI prompt library & Guides
 Product documentation
 API documentation
 Case studies
 Blog
Blog Data models
 Windsor vs Supermetrics
 Windsor vs Fivetran
 Windsor vs Portermetrics
Free Content Marketing Dashboard Report Templates
At Windsor.ai, we strive to make free content marketing reporting as effortless as possible for our users.
These free and customizable content marketing templates will assist you in visualizing your data for easy reporting and analysis.
All the content marketing dashboard report templates have easy-to-follow instructions.
Find the right template from content marketing’s library and start using them to save time, effort and increase productivity.


Try Windsor.ai today
Access all your data from your favorite sources in one place.
Get started for free with a 30 - day trial.
What is included in a content marketing report?
The content marketing report template from Windsor.ai covers several key components to help assess the performance of your content marketing efforts. Here’s a breakdown of what’s included:
- Goals:
- This section outlines the specific objectives you set for your content marketing efforts. These goals could be related to brand awareness, lead generation, customer engagement, etc.
- Highlights for the Month:
- This part of the report provides a summary of notable achievements or noteworthy events related to your content marketing activities during the month.
- Sales Funnel:
- It likely includes data on how your content is influencing potential customers at various stages of the sales funnel, from awareness to conversion.
- Traffic Generation:
- This section focuses on metrics related to driving traffic to your website or other online platforms, such as page views, unique visitors, referral sources, etc.
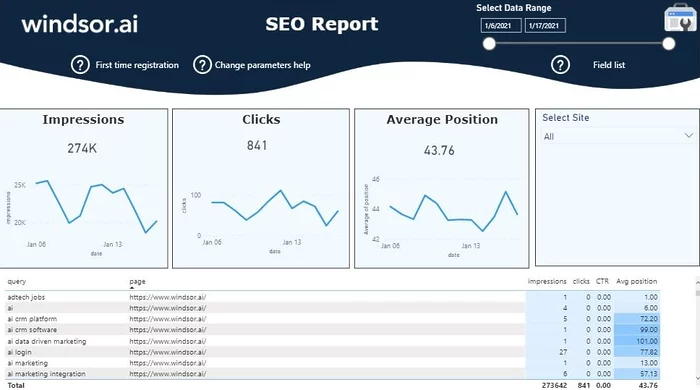
- Keywords:
- Information about the keywords that are driving organic traffic to your content. This can be vital for SEO analysis.
- Lead Generation:
- Details on how your content is performing in terms of attracting and converting leads. This could include form submissions, email sign-ups, etc.
- MQLs (Marketing Qualified Leads) and Opportunity Generation:
- This section may involve more advanced tracking of leads that have shown a higher level of interest and are more likely to convert into customers.
Why You Need a Content Marketing Reporting Template?
Here are the key points highlighted:
- Content teams often face challenges in meeting production deadlines. Manual reporting can be time-consuming and may disrupt productivity.
- Maintaining high productivity and efficiency is crucial for consistently producing high-quality content.
- Gathering and aggregating data for manual reporting can take hours or even days, which is not sustainable or scalable in the long run.
- Automating the reporting process significantly reduces the time required to generate reports.
- It’s important to have confidence in the accuracy and completeness of information included in automated reports.
- Using the right technology tools, like content marketing software, can optimize the reporting process.
- Creating templates that focus on specific metrics helps in understanding different aspects of content marketing efforts and allows for the circulation of only necessary information.
In summary, having a well-structured content marketing reporting template and leveraging automation tools can save time, increase efficiency, and provide accurate insights into content performance, which is crucial for agencies managing multiple clients.
How to measure your content performance
We all know – content marketing is one of Google Analytics’ most costly and untracked marketing forms. One word comes to mind, if you find subjects like your audience, look for them meticulously and write the report – pricey.
And this even does not involve SEO and promotion, both of which need to be well ranked by the content. You would expect that businesses and content marketers would spend extensively in monitoring and performance measurement being so critical and costly.
Content marketing analyzes are typically limited to a variety of Google Analytics 4 metrics, such as page views and page time. These metrics are significant, but they do not reveal the whole picture of the success of content commercialization.
Analyze the “All Pages” and “Landing Pages” reports
You can easily understand the most common material by reviewing the papers. You will still see the page value whether ecommerce monitoring is enabled or a value is added to your targets. This calculation indicates the contribution of a single page to an objective or ecommerce purchase.
Get precious insights from the “Navigation Summary” report
The relative location in conversion funnel is another potential explanation for its poor conversion pages. If a page is closer to the top of the funnel, a low conversion rate is expected. Similarly, the transfer ratios are even higher in the pages at the bottom of the funnel.
You must examine “Navigation Summary” in the “All Pages” report if you want to figure out if this is the case on a specific page.
Track content-related user interactions
Although not installed default, you can assess content participation by following social sharing clicks, message submissions or a page scroll. This is very important for content management research as it can be used as performance indicators.
Collect post author, category, main keywords and post format
You will have to ask yourself performance-related questions if you are serious about content marketing sooner or later. Issues such as, “Who is our best author?”Which types of content converts more? “Or what format would our audience better fit?”.
Sadly, Google Analytics cannot respond to those questions by example. And the monitoring will have to be personalized.
In general, this is achieved with custom dimensions, the aggregation of content and the implementation of Google Analytics. You will then display the data in a personalized Google Analytics report after the addition of the monitoring.
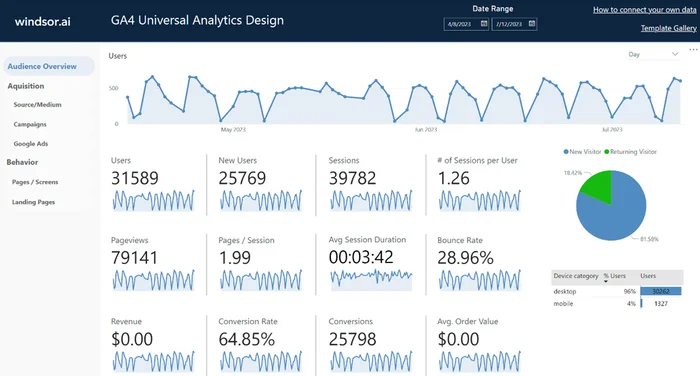
Otherwise, you can use a platform such as Google Data Studio to display these data more attractively. If it feels like it’s too difficult to grasp at first, you could utilize our Looker Studio templates and/or our Looker Studio examples that are already optimized for the most commonly used metrics.
Analyze the bounce rate and time on page
Bounce rate and page time are very important measures for the selling of content since they are appropriate for the content. If an article has a low bounce rate, the content is typically very important for the customer. For a long time on a list, the same is real. Users typically take the time to read your material while they are high on a web. So what’s the high degree of bounce? Can it mean the contents are wrong?
This is usually accurate, though, when the predicted user action is a bounce. For example if a user sees a help page about a problem, he can bounce as soon as the solution is found.
You will have a clearer view of your brand marketing with these reviews and personalized monitoring in your analytics toolbox. In return, you can make informed choices on your content management campaign preparation and applying it.