Power BI Instagram Dashboard Template

Visualize your key Instagram Organic metrics, like follower trends, reach, engagement rates, and top-performing posts, with this plug-and-play Power BI template.
Simply connect your Instagram account to Windsor.ai and sync the data to this custom, auto-refreshing dashboard—no manual updates or complex setup needed.
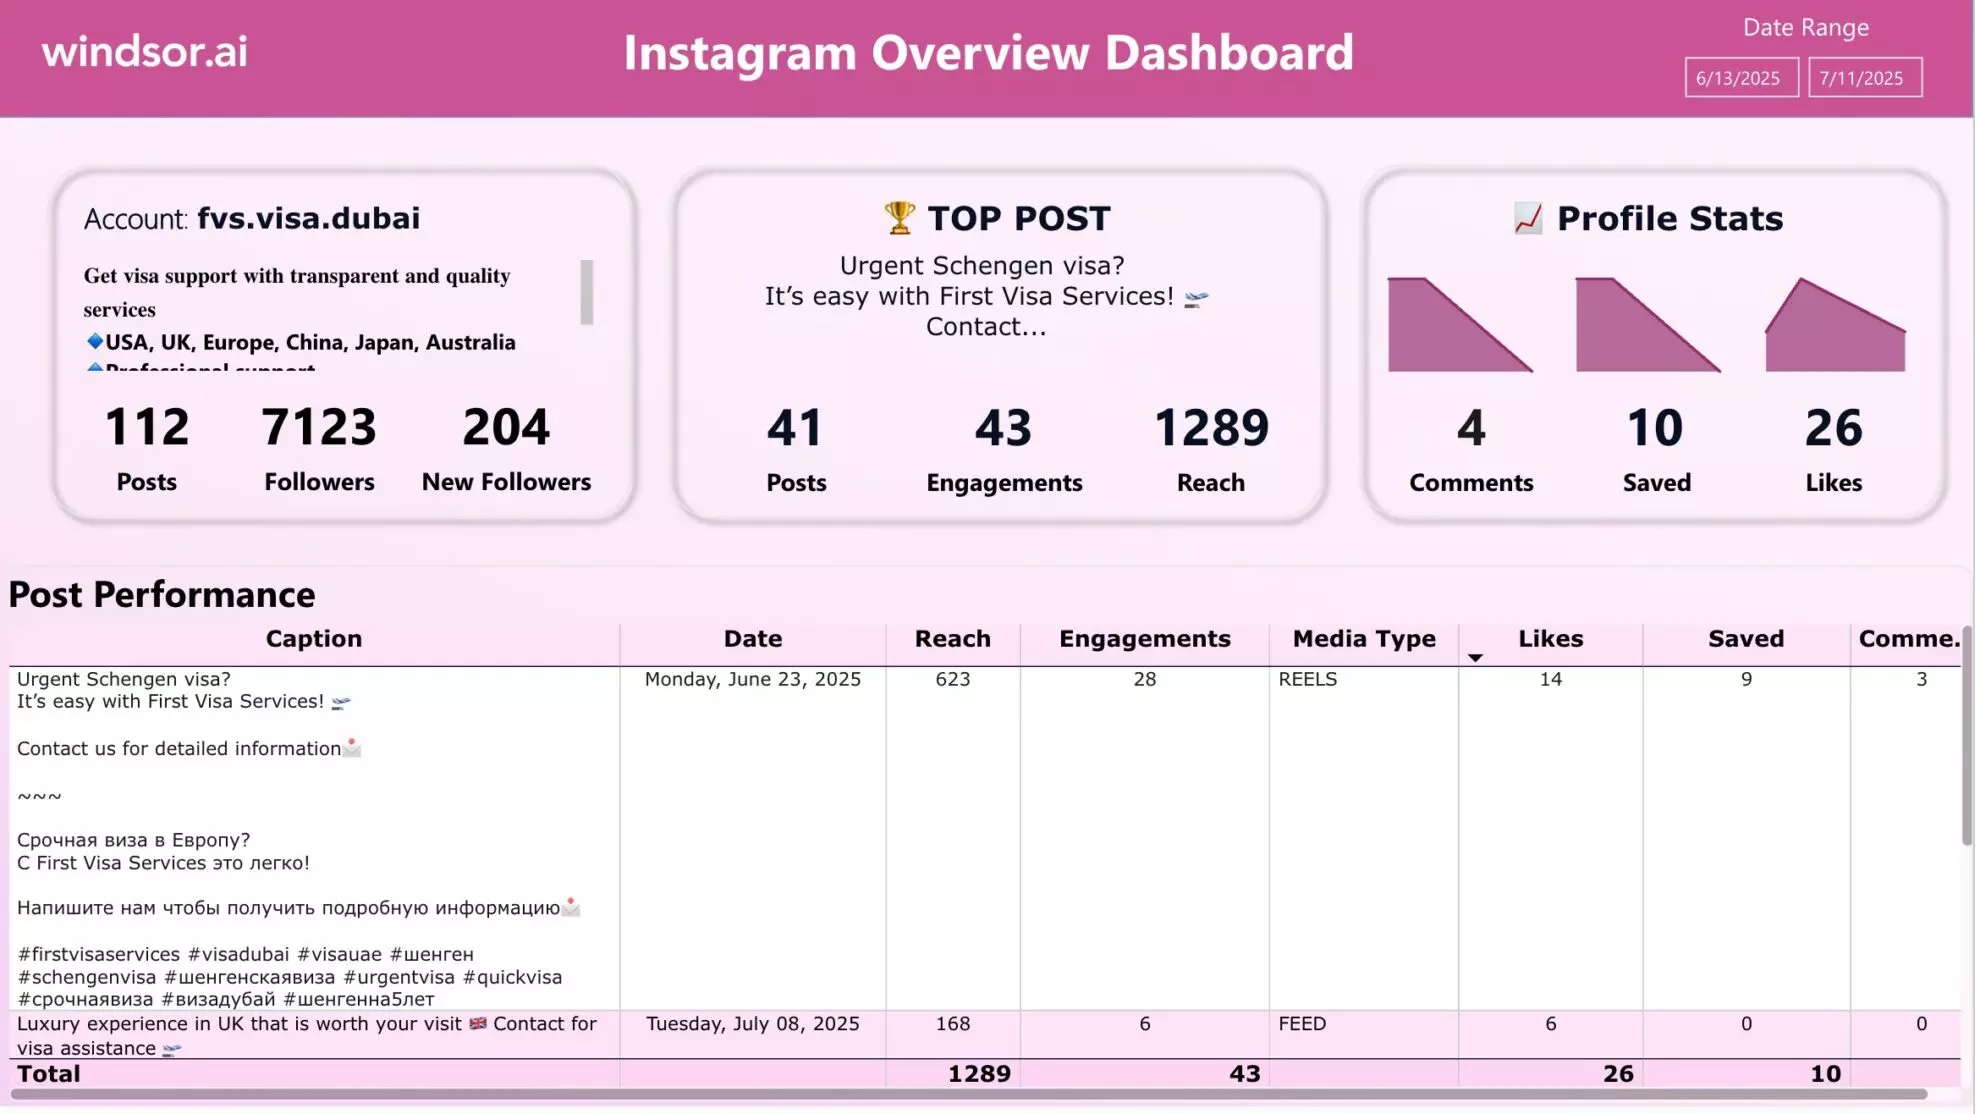

How to use this template: setup instructions
Prerequisites:
- Instagram Business or Creator account
- Admin access via Meta Business Manager
- Windsor.ai account
- Power BI account connected via Web or Desktop
Get your API key
Click on Preview and Destination, choose Power BI Web, then copy your API Key from the instructions.

Use your API Key in this template
Go to the installed Template App and click on Connect your data from the upper pop-up. Paste your API Key that you’ve copied from Windsor.ai.
For Desktop: Download the template and paste your API Key on the start screen.

Set the template and preview your real data
Choose the desired date range and click Next. Leave the Authentication Method selected as Anonymous. Save and see your data integrated in this template.



Instagram Page Power BI dashboard template: metrics, dimensions, and breakdowns
All data is pulled automatically via Windsor.ai’s connector and updated on your preferred schedule in the Power BI dashboard.
Below are the predefined metrics and dimensions available in this template. However, you can use any other field you need in the connection string. View a complete list of available metrics and dimensions.
Dimensions:
- Date
- Account name
- Biography
- Post caption
- Post type
- Audience age group
- Audience gender
- Audience country
Metrics:
- Followers
- New followers
- Profile stats (saved, comments, likes)
- Post Reach
- Post Impressions
- Post Engagements
- Post Likes
- Post Saved
- Post Comments
Dashboard overview
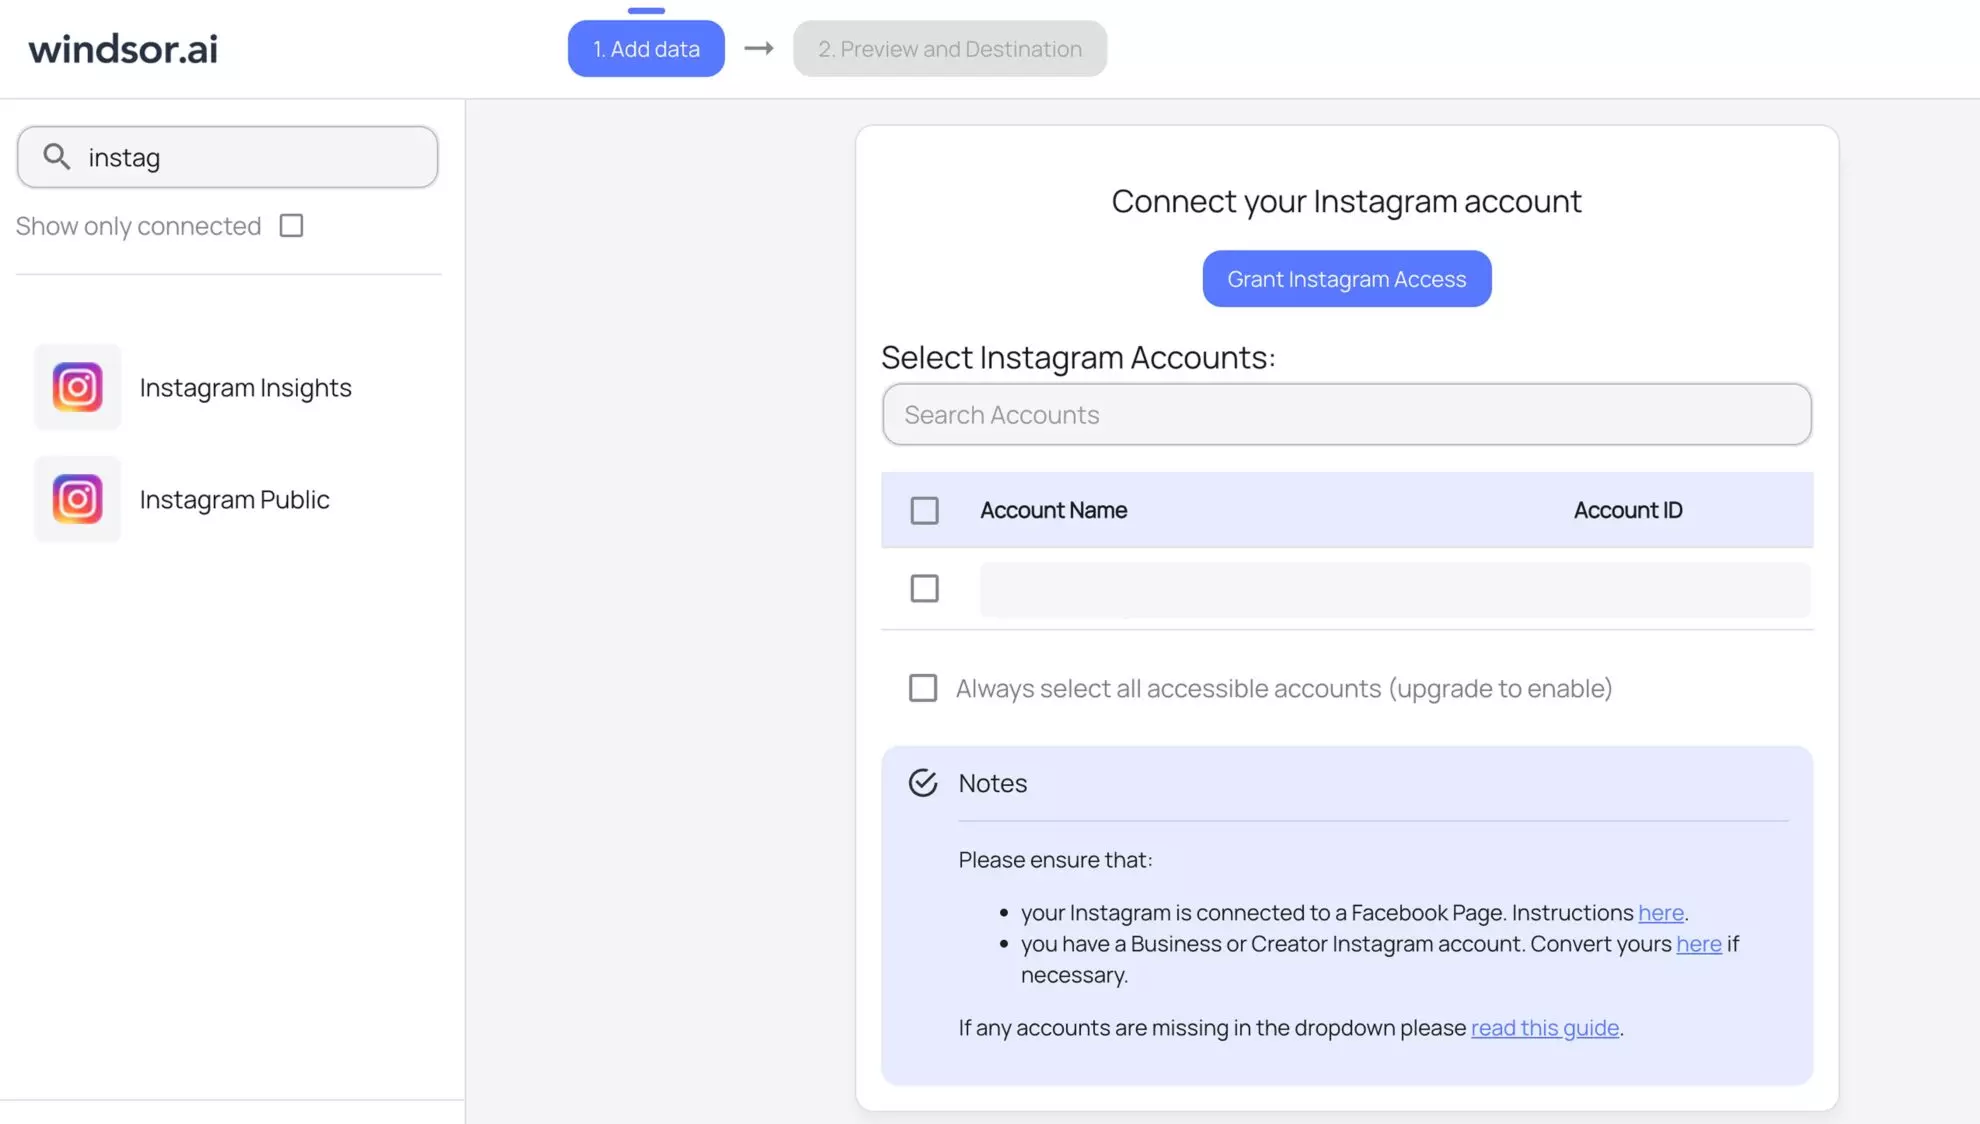
This Instagram Page Insights Power BI dashboard is made up of three main sections located on two screens:
1) Profile insights
View your account name, bio, and up-to-date follower and post counts. Instantly spot your top-performing post based on engagement, and track total likes, comments, and saves your profile received over a selected time period.
2) Top posts
Track reach, comments, and reactions for each post to identify which content formats, topics, or captions resonate most with your audience.
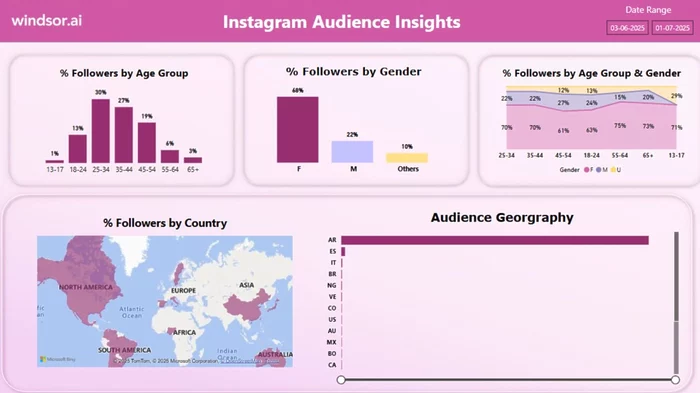
3) Audience insights
Gain a clear understanding of your followers’ demographics and locations to tailor content that better connects with them.
FAQs
How do I connect my data to this template?
1. Get your API Key by connecting your Instagram account to Windsor.ai:
- Go to onboard.windsor.ai
- Register for free or log in if you already have an account.
- Choose Instagram Insights from the left-side menu, click on “Grant Instagram Page Access,” then follow the steps in the pop-up to sign in and grant the required permissions.
- Select at least one Instagram account from the drop-down.
- Click on Preview and Destination, choose Power BI Web, then copy your API Key.
2. Use your API Key in this template
- Go to the installed Template App.
- Click on Connect your data from the upper pop-up.
- Paste your API Key that you’ve copied at step 5, choose the desired Date Range, then click on Next.
- Leave the Authentication Method selected to “Anonymous”, then click on “Sign in and connect”.
That’s it. Now you should see your own data.
Why do I need to use this Instagram Insights template?
This free Instagram Insights Power BI template allows you to automatically visualize key metrics such as follower growth, reach, engagement, and post performance in a unified, auto-refreshing Power BI dashboard. No complex technical setup required.
Do I need coding skills to use this template?
No coding required at all. This dashboard is entirely pre-built and connects via Windsor.ai’s no-code integration. You’ll just need to follow a few simple sync setup steps using your Windsor.ai API key.
Can I schedule automatic dashboard updates?
You can set up scheduled data refreshes by navigating to “Schedule Refresh” under “Settings” in Power BI Service, enabling “Keep data updated,” and configuring the refresh frequency and time zone.
Is this template customizable?
Yes. You can edit charts, formulas, add filters, sort columns, or extend the dashboard to include your own KPIs or branding.
Is this template free to use?
You can use this and other Windsor.ai templates for free for 30 days. After the trial period, a purchase is required.
Tired of juggling fragmented data? Get started with Windsor.ai today to create a single source of truth

