 AI insights
 About us
 Careers
 Security
 Customer reviews
 Contact us
 Affiliate program
 Solution partners
 Looker Studio templates
 Tableau templates
 Facebook Ads templates
 Google Ads templates
 Data fields & Metrics
 AI prompt library & Guides
 Product documentation
 API documentation
 Case studies
 Blog
Blog Data models
 Windsor vs Supermetrics
 Windsor vs Fivetran
 Windsor vs Portermetrics
Free Linkedin Pages Dashboard Templates
At Windsor.ai, we strive to make free Linkedin Pages marketing reporting as effortless as possible for our users.
These free and customizable Linkedin Pages templates will assist you in visualizing your data for easy reporting and analysis.
All the Linkedin Pages dashboard report templates have easy-to-follow instructions.
Find the right template from Linkedin Pages’s library and start using them to save time, effort and increase productivity.


Try Windsor.ai today
Access all your data from your favorite sources in one place.
Get started for free with a 30 - day trial.
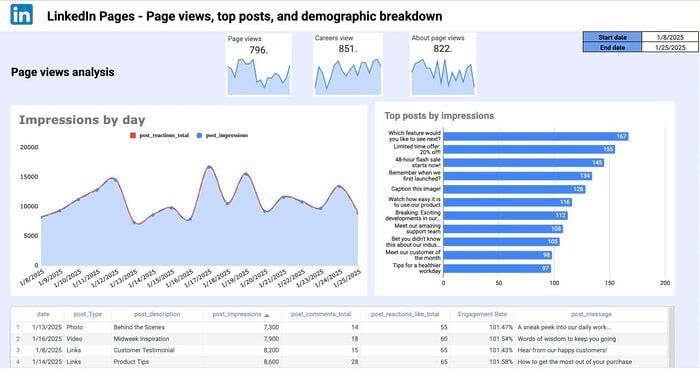
What is Linkedin Pages dashboard?
A LinkedIn Pages dashboard is a digital tool or interface provided by LinkedIn that allows users to access and analyze various metrics and KPIs related to the performance of their LinkedIn Page. It provides valuable insights into how a LinkedIn Page is performing in terms of engagement, reach, and effectiveness in achieving specific marketing or branding goals.
Utilize this informative LinkedIn Page analytics dashboard to access live data regarding your clients’ or your own page performance. Gain a consolidated overview of your essential LinkedIn metrics and KPIs all in one place.
What should be included in a LinkedIn Pages analytics report?
A LinkedIn Page insights report should provide valuable information about various aspects of your account, including growth, engagement, visibility, conversion, and audience demographics.
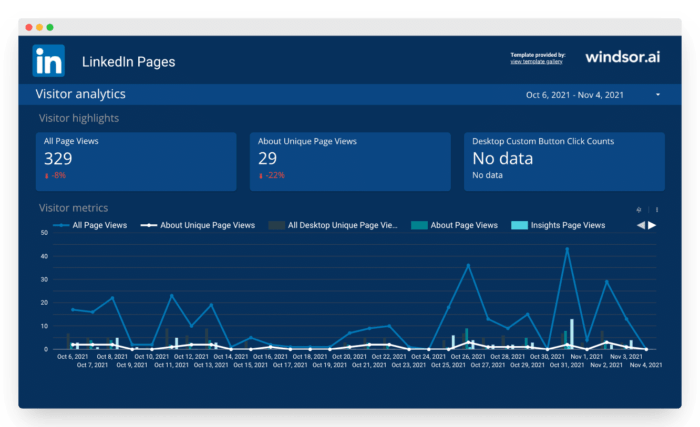
Profile Performance
- How many views has the LinkedIn page received?
- How many unique visitors have viewed the page?
- How many followers have been gained or lost over time?
- What is the trend for these metrics over time?
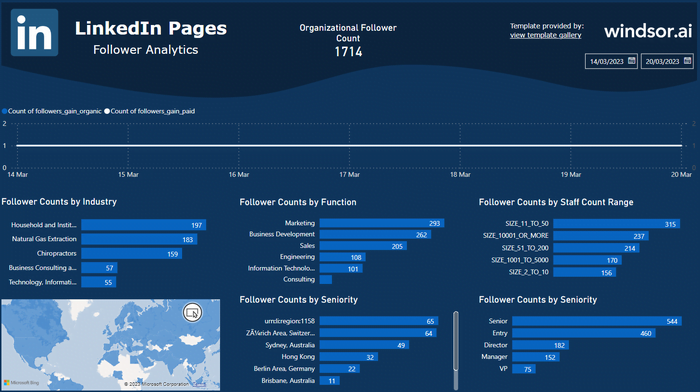
Audience Demographics
- What is the location, industry, job function, and seniority level of the LinkedIn page’s followers?
- What are the top industries following the page?
- How have the audience demographics changed over time?
Engagement Metrics
- How many likes, comments, shares, and reactions have the page’s posts received?
- What is the engagement rate (i.e., the percentage of followers who engage with the content)?
- What are the most engaging posts, and what attributes contribute to their success?
- How has the engagement rate changed over time?
Lead Generation
- How many leads have been generated from the LinkedIn page?
- What is the conversion rate of the page’s lead generation efforts?
- How have the lead generation metrics changed over time?
Content Performance
- Which types of posts are most popular among the audience (e.g., text, image, video)?
- What topics are resonating with the audience?
- How has the reach of the page’s posts changed over time?
Linkedin Pages Dashboard Templates: metrics & dimensions
Below are the most popular metrics and dimensions available in our Linkedin Analytics report templates. However, you can any other field you need in the connection string.
Dimensions:
- Date
- Post Title
- Followers Industry
- Followers Function
- Followers Staff Count Range
- Followers Seniority
- Followers City
- Followers Country
Metrics:
- # of Followers
- # of Visitors
- Page Views
- Careers Unique Page Views
- About Unique Page Views
- Comments
- Shares
- Likes
- Likes on Shares
- Impressions
- Clicks
Our Linkedin Analytics dashboard templates can be customized with > 50 different dimensions, breakdowns and metrics. Head here to see a complete list: available metrics and dimensions.