 AI insights
 About us
 Careers
 Security
 Customer reviews
 Contact us
 Affiliate program
 Solution partners
 Looker Studio templates
 Tableau templates
 Facebook Ads templates
 Google Ads templates
 Data fields & Metrics
 AI prompt library & Guides
 Product documentation
 API documentation
 Case studies
 Blog
Blog Data models
 Windsor vs Supermetrics
 Windsor vs Fivetran
 Windsor vs Portermetrics
X Ads (Twitter Analytics) Dashboard Templates
At Windsor.ai, we strive to make free X Ads (Twitter) marketing reporting as effortless as possible for our users.
These free and customizable Twitter Ads templates will assist you in visualizing your data for easy reporting and analysis.
All the X ads (Twitter)dashboard report templates have easy-to-follow instructions.
Find the right template from Twitter Ads’s library and start using them to save time, effort and increase productivity.
You can find more information about X Ads (Twitter ads) Connector here.

Try Windsor.ai today
Access all your data from your favorite sources in one place.
Get started for free with a 30 - day trial.
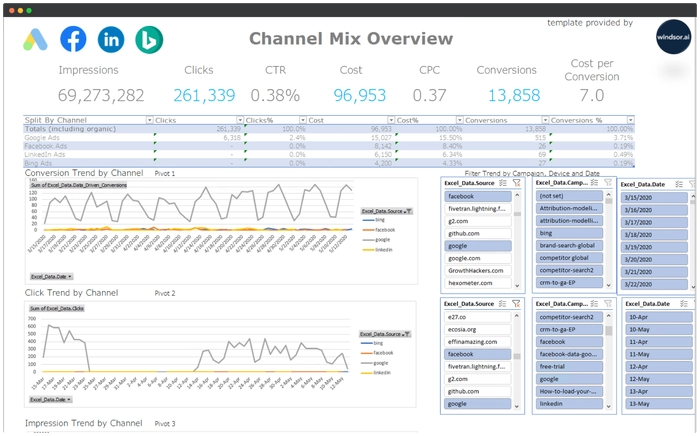
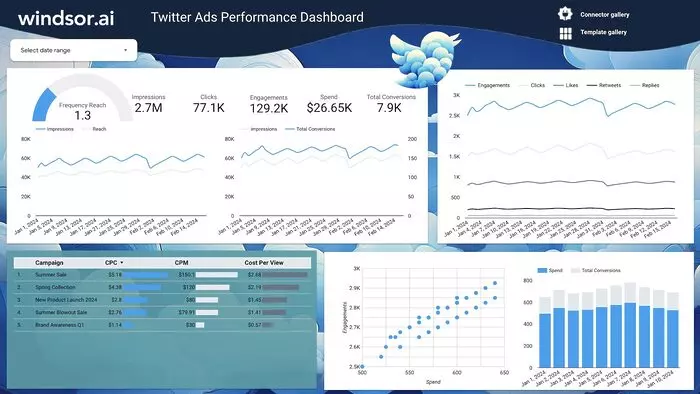
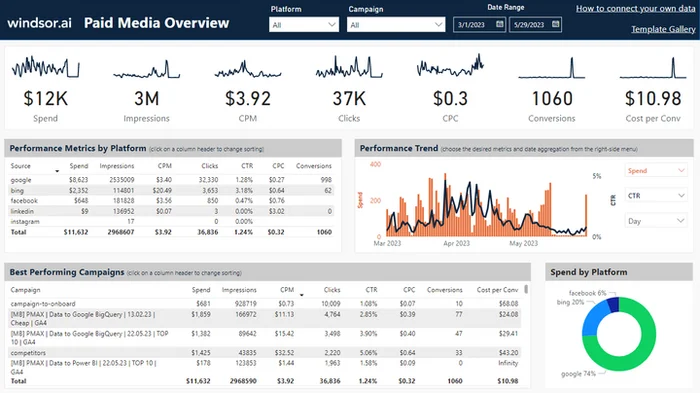
X Ads (Twitter Analytics) Report Insights
Twitter Ads report provides insights such as mentions, profile visits, top tweets, video content performance, conversion tracking, and follower growth. These insights help you improve your ad campaign and get better results.
Let’s elaborate!
Profile visits
You’ll find the number of Twitter profile visits on the top of your analytics dashboard. Your profile visits are measured over 28 days and updated every day. The report tells you how this number compares to the previous 28-day period.
A mini graph displays this data over time. With this data, you can tell if your visitors are increasing or decreasing on your profile. This way, you’ll plan and adjust your tweets as required.
Mentions
Like the profile visits metric, mentions also reflect data for 28 days and over time. This metric also displays your top mention each month, depending on the engagement. You’ll also have access to a link leading to the tweet for additional context.
Top Tweets
Top Tweet and top media Tweet depending on impressions are available each month on your main analytics dashboard. For a more detailed analysis, click on “View Tweet activity.” You’ll see the engagement broken down by profile clicks, link clicks, detail expands, and more.
Follower growth
Your dashboard has a follower section where you can monitor how many people follow you each day and how your following has changed in the last 30 days. Notice the days in which you gained or lost followers.
You can determine why you lost or gained followers on a particular day by checking what you tweeted that day.
Video content performance
If your content strategy involves videos, you can monitor your video views. You’ll also see how users are responding to the videos you post. The video content performance metric lets you know if people watch your videos to completion.
Conversion tracking
Followers can use their mobile phones to engage on your Twitter Analytics and then convert or buy a product with their laptops. When this happens, conversion tracking will correctly attribute it to your Twitter Analytics.
With this data, you can measure your return on ad spend. All you need to do is track what people do after viewing or engaging with your Twitter Ads.
X Ads (Twitter Analytics) Report Additional Hacks
Keep the objectives in mind before providing insights. You want your campaigns to produce results that meet your expectations.
Otherwise, you must consider the segmentation, creatives, or bidding type. Discover any creative that is producing better results in terms of efficiency and/or cost.
Make sure your creative team is engaging with content.
Video metrics are handy when dealing with quartile analysis. Video View Rate (View-through rate) calculated by dividing video views by the Video Ads Impressions, video length, and completion rate are important metrics when running video ads.
To win on Twitter, you must engage your followers. If your engagement is low, you must reevaluate your call to action. Resources such as threads or polls can also help to increase the interaction.
Access all your data from your favorite sources in one place. Try Windsor.ai today
Get started for free with a 30 - day trial.