 Destinations
 Data sources
 AI insights
 About us
 Careers
 Security
 Customer reviews
 Contact us
 Affiliate program
 Solution partners
 Template gallery
 Looker Studio templates
 Power BI templates
 Excel templates
 Google Sheets templates
 Tableau templates
 Facebook Ads templates
 Google Ads templates
 Data fields & Metrics
 AI prompt library & Guides
 Product documentation
 API documentation
 Case studies
 Blog
 Data models
 Windsor vs Supermetrics
 Windsor vs Funnel.io
 Windsor vs Fivetran
 Windsor vs Rivery
 Windsor vs Portermetrics
 Windsor vs Coupler.io
10 Free Executive & CEO Dashboard Templates (Data Studio, Excel, Power BI, Tableau)
Simplify your work with a free executive or CEO dashboard template for Data Studio (Looker Studio), Power BI, Tableau, or Excel.
Most templates show spend, clicks, and conversions from several ad platforms in one view. Some add GA4 sessions, Search Console data, or CRM deals.
Each template comes with setup steps for connecting your ad, analytics, or CRM accounts through Windsor.ai. The example below uses Windsor.ai’s Q3 2026 Google Ads and GA4 data to show which campaigns drive website traffic.



















Power BI Paid Media Overview Dashboard Template

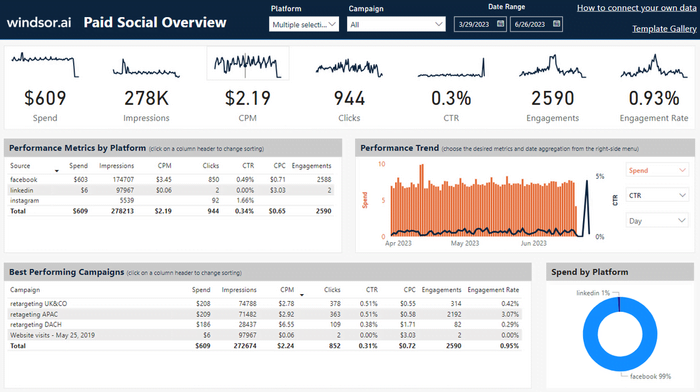
Power BI Paid Social Media Overview Dashboard Template
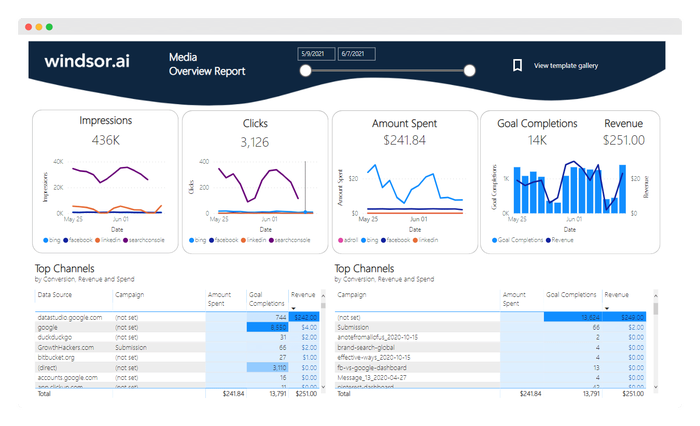
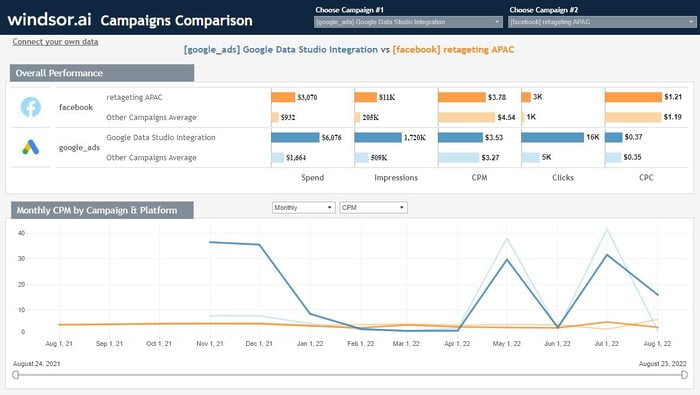
Tableau Compare Campaigns Performance Dashboard Template

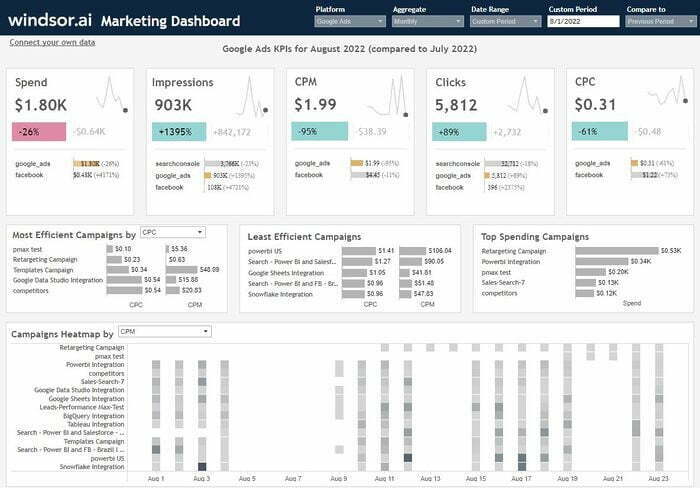
Tableau Multichannel Attribution Dashboard Template
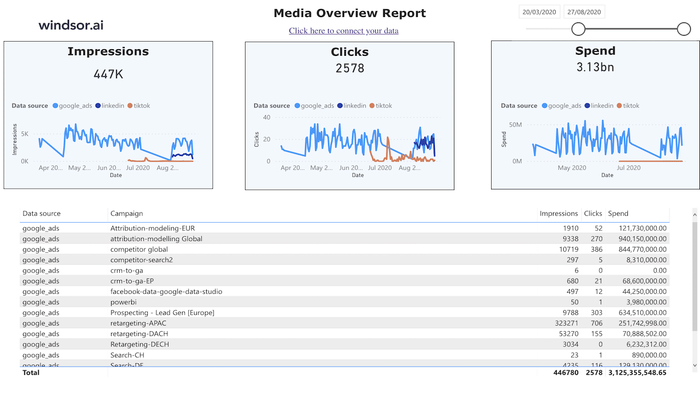
Tableau Web Media Overview Dashboard Template


What is an executive dashboard?
An executive dashboard, also called a CEO dashboard, gives leadership a one-page view of business performance. It tracks key metrics such as marketing spend, leads, revenue, and return on investment. The data comes from ad platforms such as Google Ads and Meta Ads, from GA4, and from CRMs such as HubSpot. Your dashboard runs in Data Studio, Power BI, Tableau, or Excel. Windsor.ai connects your data sources and brings their data into one report. CEOs use the dashboard to review performance before leadership meetings, and marketing leads use it to explain how the budget is spent.
Executive dashboard examples: which CEO dashboard template to pick
The table lists all 10 free templates in this gallery. Some template titles still mention Looker Studio, Data Studio’s previous name. For a spreadsheet, download the Excel Marketing Reporting template for free and bring data from 13 platforms into one workbook.
| Template | Tool | Platforms | Best for | Key metrics |
|---|---|---|---|---|
| Marketing Agency Report | Data Studio | The ad and social platforms you connect | Cross-channel results for a client or a leadership team | impressions, clicks, conversions, cost, ROAS, reach, CTR, engagement, cost per acquisition |
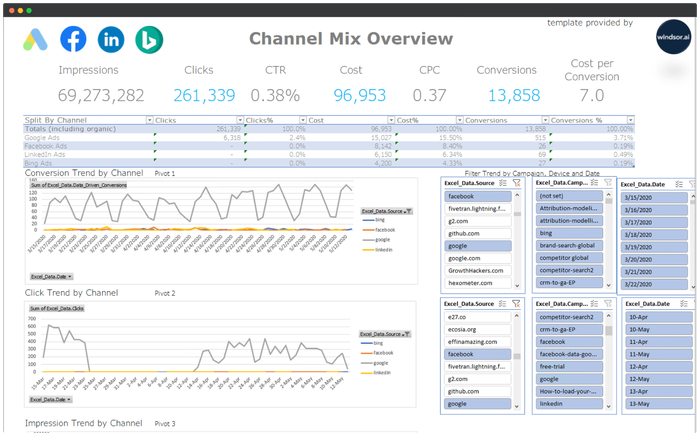
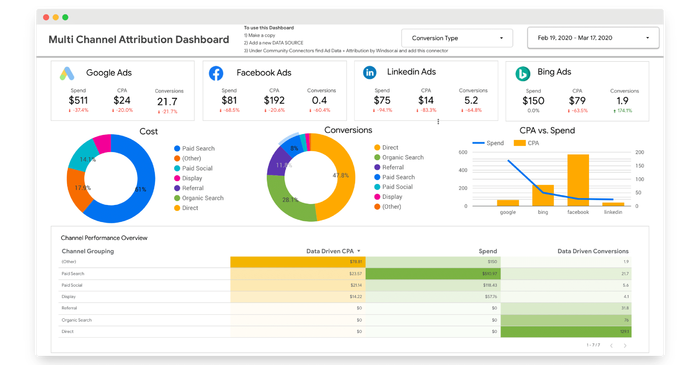
| Data Studio Multichannel Attribution Dashboard | Data Studio | Google Ads, Meta Ads, LinkedIn Ads, Microsoft Ads | Spend and conversions across four ad platforms | spend, conversions, conversions vs. spend by channel |
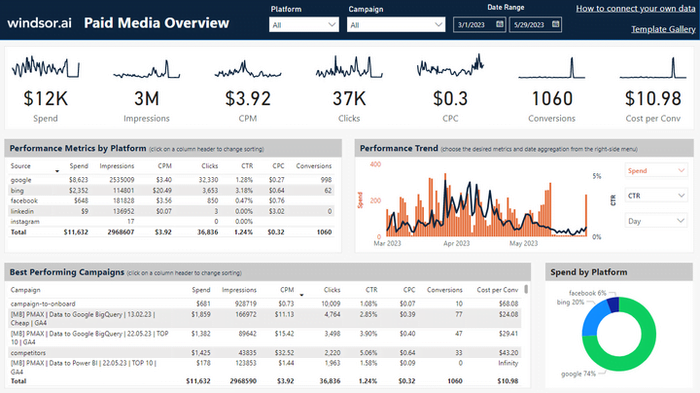
| Power BI Paid Media Overview | Power BI | The ad platforms you connect | Paid media by platform and campaign | spend, impressions, CPM, clicks, CPC, CTR, conversions, cost per conversion |
| Power BI Paid Social Overview | Power BI | Meta Ads, LinkedIn Ads, TikTok Ads and other social ad platforms | Paid social by platform and campaign | spend, impressions, CPM, clicks, CPC, CTR, engagements, engagement rate |
| Power BI Web Media & SEO Overview | Power BI | GA4, Search Console, plus ad platforms such as Google Ads, Meta Ads, LinkedIn Ads and Microsoft Ads | Paid media and SEO results in one report | clicks, impressions and spend by channel and campaign; Search Console clicks, impressions, CTR, average position |
| Tableau Compare Campaigns | Tableau | GA4, Google Ads, Meta Ads, TikTok Ads, YouTube Ads, LinkedIn Ads | Campaigns from several platforms side by side | spend, clicks, impressions, GA4 conversions |
| Tableau Web Media Overview | Tableau | GA4, plus ad platforms such as Google Ads, Meta Ads, LinkedIn Ads and Microsoft Ads | Clicks, impressions and spend across channels, next to sessions | source, medium, campaign, clicks, impressions, spend, sessions |
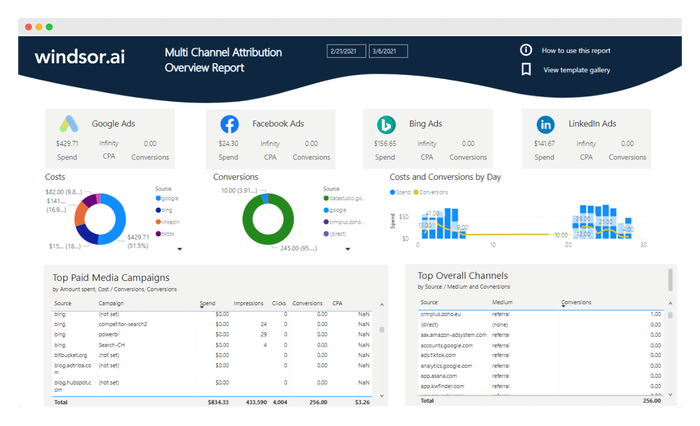
| Tableau Multichannel Attribution | Tableau | Google Ads, Meta Ads, Microsoft Ads, GA4, LinkedIn Ads, TikTok Ads, HubSpot, Salesforce, Stripe and others | Overview of the most-used marketing channels | source, medium, campaign, clicks, impressions, spend, sessions, GA4 conversions |
| Microsoft Power BI Multichannel Marketing Attribution | Power BI | Microsoft Ads, Meta Ads, Google Ads, Salesforce, TikTok Ads, X Ads, YouTube Ads | Multichannel overview | clicks, conversions |
| Excel Marketing Reporting | Excel | AdRoll, Microsoft Ads, Criteo, Meta Ads, Google Ads, GA4, LinkedIn Ads, Pinterest Ads, Salesforce, Snapchat Ads, TikTok Ads, X Ads, YouTube Ads | Multi-platform reporting in a free downloadable workbook | impressions, clicks, CTR, CPC, conversions and cost per conversion |
Executive dashboard example: which part of the ad budget brings visitors
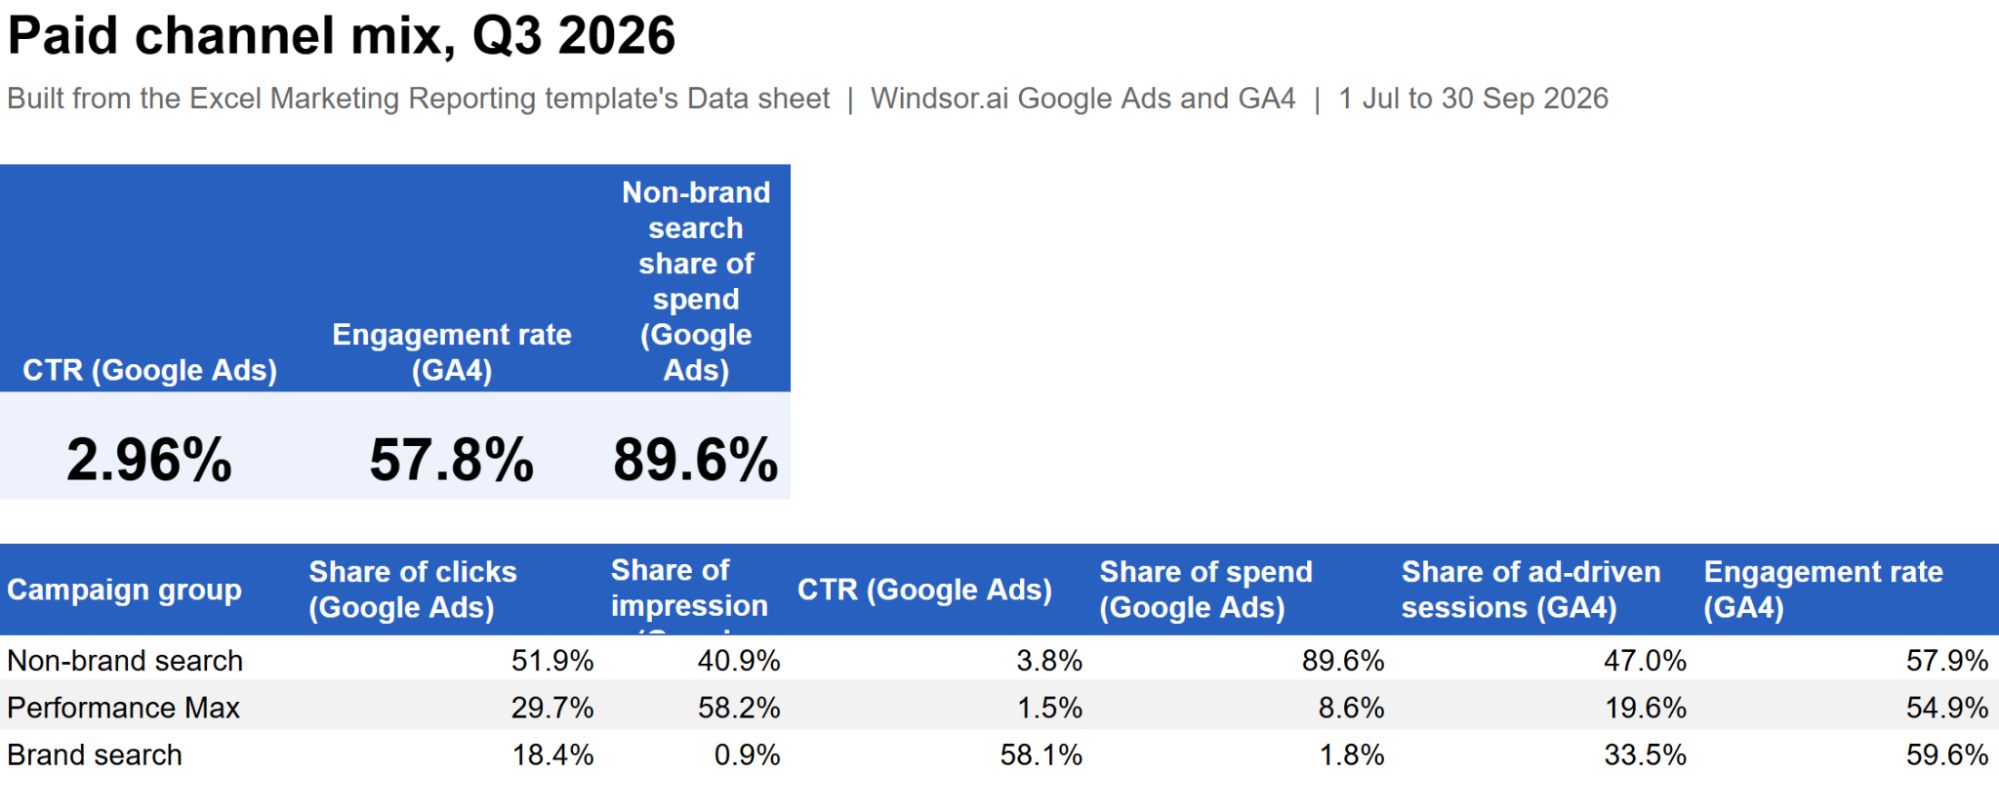
This example uses Windsor.ai’s own Google Ads and GA4 accounts for Q3 2026 (1 July to 30 September). It shows which campaigns bring people to the website.
Step 1: Connect the sources. Sign in at onboard.windsor.ai, choose the Google Ads and GA4 connectors, and authorize your accounts.
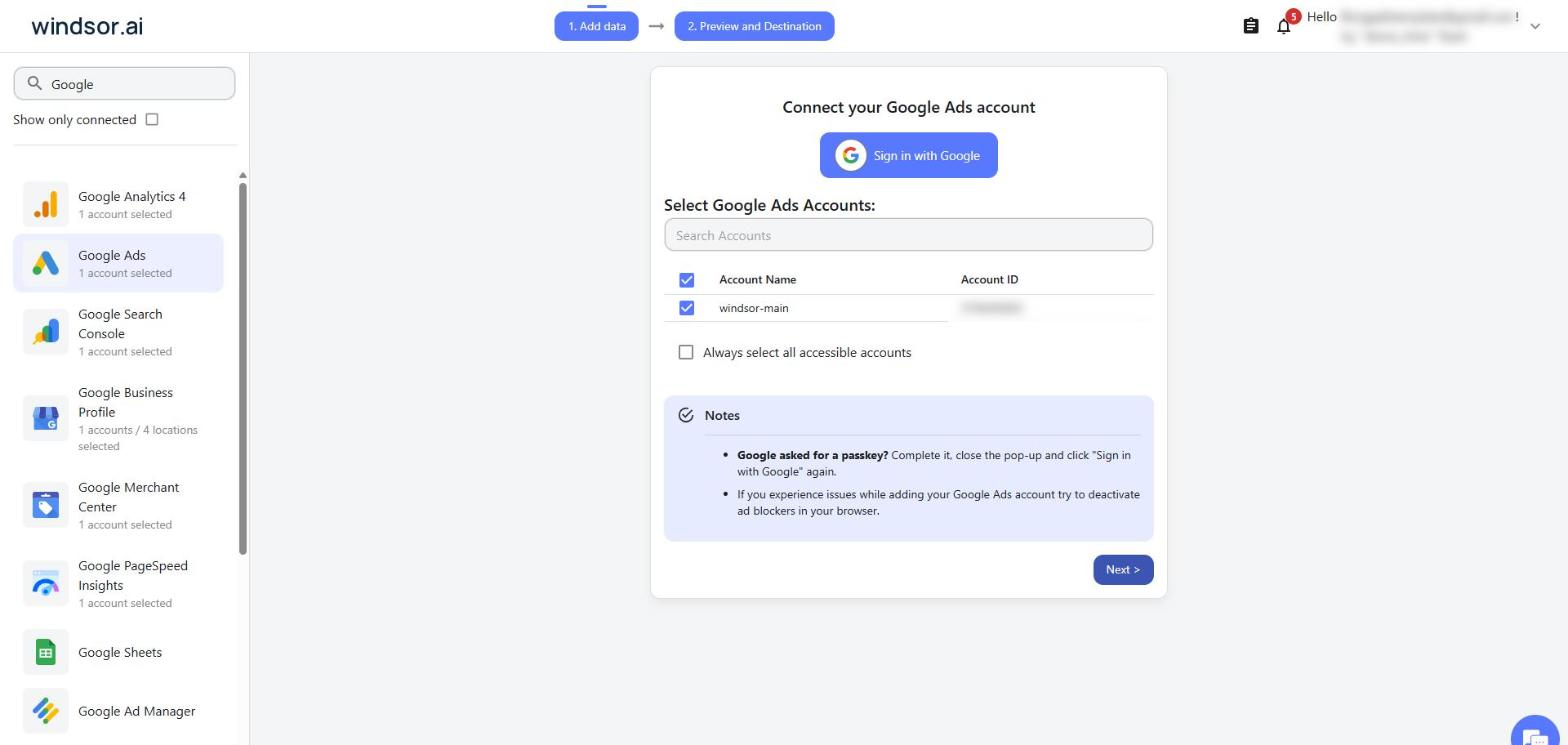
Step 2: Pull the Google Ads fields. Pull campaign name, campaign type, and spend for the quarter. Sort the campaigns into three groups: brand search (Search campaigns that target the company name), Performance Max (campaigns of the Performance Max type), and non-brand search (every other Search campaign).
Step 3: Pull the GA4 fields. Pull the session’s Google Ads campaign name, sessions, and engaged sessions, filtered to the Paid Search and Cross-network channel groups. Match each campaign name to its Google Ads campaign and sort the sessions into the same three groups. The table lists the field IDs to select in Windsor.ai.
| Source | Windsor.ai fields | Used for |
|---|---|---|
| Google Ads | campaign, campaign_type, spend | Campaign groups and share of spend |
| GA4 | session_google_ads_campaign_name, session_default_channel_group, sessions, engaged_sessions | Matching campaigns, filtering to paid channels, share of sessions and engagement rate |
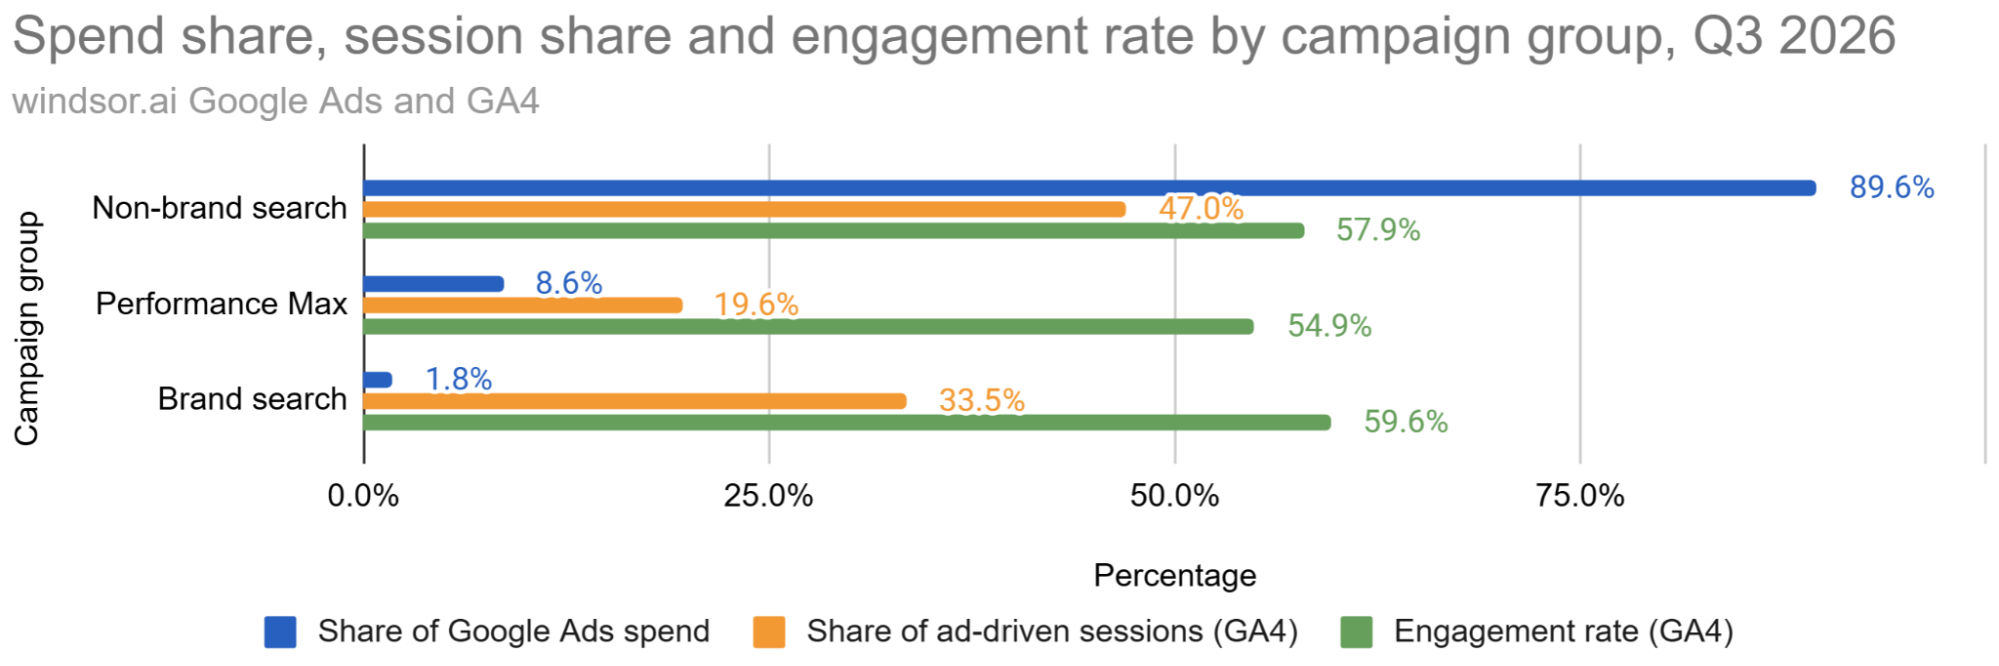
Step 4: Compare the shares. Divide each group’s spend by the total spend, and each group’s sessions by all sessions GA4 matched to a Google Ads campaign. Engagement rate is engaged sessions divided by sessions.
| Campaign group | Share of Google Ads spend | Share of ad-driven sessions (GA4) | Engagement rate (GA4) |
|---|---|---|---|
| Non-brand search | 89.6% | 47.0% | 57.9% |
| Performance Max | 8.6% | 19.6% | 54.9% |
| Brand search | 1.8% | 33.5% | 59.6% |
Across the quarter, brand search took 1.8% of the Google Ads spend and brought a third of the ad-driven sessions. Non-brand search took 89.6% of the spend for 47.0% of the sessions. Engagement rate is between 54.9% and 59.6% in all three groups.
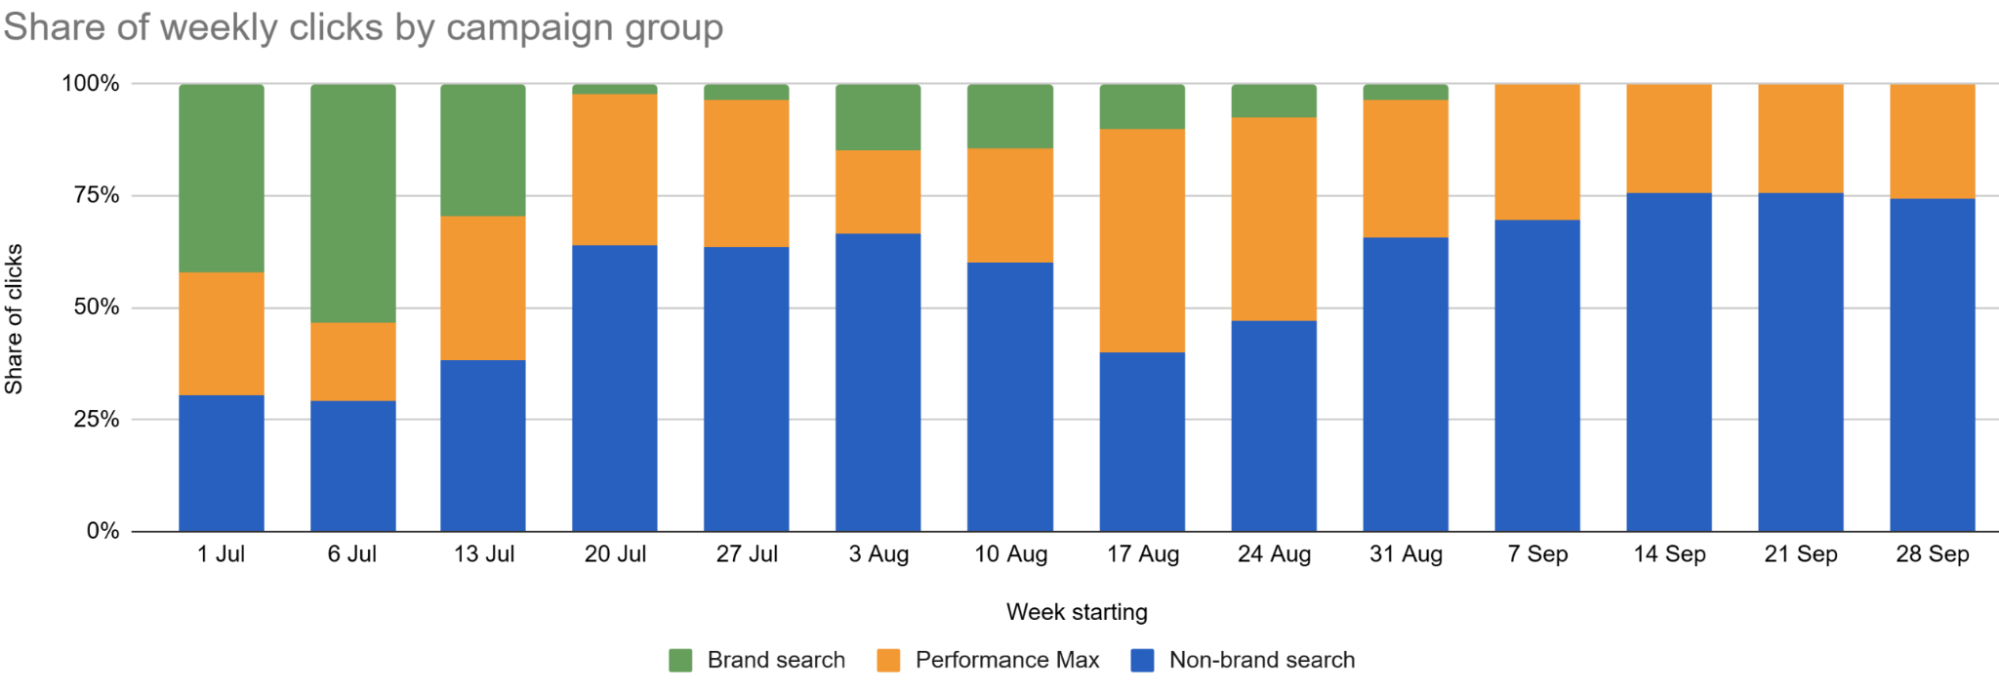
The brand numbers look different when you split them by month. Windsor.ai cut brand spend in mid-July and stopped it after 4 September, yet GA4 kept crediting brand campaigns with sessions.
| Month | Brand search share of Google Ads spend | Brand search share of ad-driven sessions (GA4) |
|---|---|---|
| July | 5.1% | 47.9% |
| August | 0.2% | 27.1% |
| September | <0.1% | 13.0% |
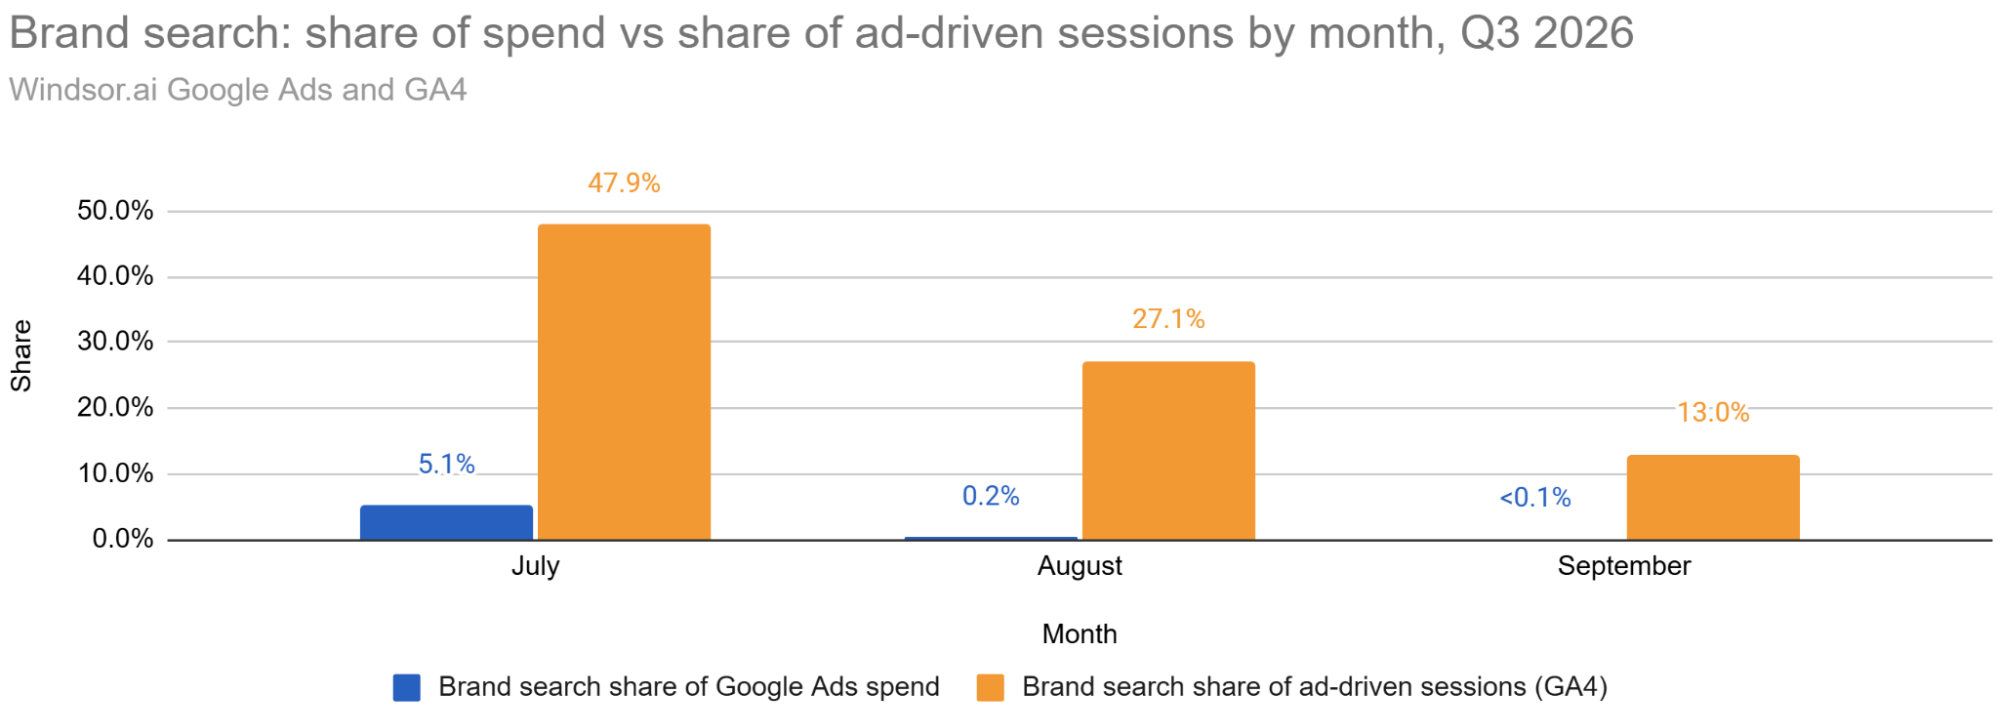
GA4 kept crediting brand campaigns with sessions after the ads stopped running, most likely from visitors who returned after an earlier brand ad click. From 5 September, with no brand ads live, GA4 still credited brand campaigns with 11.1% of ad-driven sessions. Report by month as well as by quarter, because only the monthly view reveals sessions credited to stopped campaigns.
Across all channels, paid search brought about 3% of Windsor.ai’s Q3 sessions and took almost all of the ad budget. An executive dashboard that puts channel mix next to spend shows leadership how much traffic the ad budget buys. The Excel Marketing Reporting template in the table puts ads metrics next to GA4 data for your own accounts.

CEO dashboard metrics: which KPIs to track
Choose the KPIs your leadership team cares about. Windsor.ai pulls the data for each metric from your ad platforms, GA4, or CRM.
- Ad spend: total spend across every ad platform in the period.
- Revenue or pipeline from marketing: revenue from your store or CRM, or new pipeline in the CRM, for the same period.
- ROAS: revenue divided by ad spend. Take revenue only from one source, such as your store, CRM, or GA4, because each ad platform claims conversions under its own attribution model and one sale can appear in several reports.
- Cost per acquisition: ad spend divided by new customers or leads.
- Conversion rate: key events or purchases divided by sessions, from GA4.
- Spend share by channel: each channel’s ad spend as a percentage of total spend, compared with its share of sessions or revenue.
- Engagement rate: engaged sessions divided by sessions, from GA4. GA4 counts a session as engaged when it lasts over 10 seconds, includes a key event, or has two or more page views.
Executive dashboard design: what to include in a CEO report
A CEO report tracks marketing spend, the revenue or leads it generates, and the return on that spend. It compares each metric with the previous period or your targets.
Split each metric by:
- channel (for example paid search, paid social, organic search, email)
- ad platform
- campaign
- country or region
- date (by week, month, or quarter)
Structure the monthly CEO report in three parts. At the top, compare ad spend, revenue, ROAS, and cost per acquisition with the previous month. In the middle, show each channel’s share of total spend alongside its share of revenue. At the bottom, list the five highest-spending campaigns and their ROAS. Apply the same date range to every data source so ad spend and revenue reflect the same period.
Browse the full template gallery for dashboards by platform and destination, or see the cross-channel marketing templates for channel-level reporting. How to use Windsor.ai for finance shows how to ask an AI assistant about revenue next to ad spend.
FAQs
Is there a free executive dashboard template in Excel?
Yes. The Excel Marketing Reporting template combines impressions, clicks, CTR, CPC, conversions and cost per conversion from 13 platforms in one workbook. It adds GA4 and Salesforce data next to the ad metrics. Download the template and connect your accounts through Windsor.ai to automate reporting without manual CSV exports.
What should a CEO dashboard include?
A CEO dashboard should connect marketing spend to business results. Show ad spend, revenue or leads, ROAS, and cost per acquisition alongside previous-period results or targets. Break down each metric by channel and campaign to show where the budget delivers results. Include each channel’s share of sessions, too, so leadership can compare paid campaigns with free traffic sources such as organic search and direct traffic.
What is an executive summary dashboard?
An executive summary dashboard gives leadership a one-page view of the numbers that matter most, compared with the previous period or plan. For marketing, track ad spend, revenue or leads, ROAS, and cost per acquisition by channel.
How is a CEO report different from a CEO dashboard?
A CEO dashboard shows the latest data and lets leadership check performance at any time. A CEO report captures results for a specific period, such as a month or quarter, and explains what changed and why. Many teams use the dashboard to create the report by selecting a date range, exporting the data, and adding context. Every template on this page supports both.
Can I customize the executive dashboard templates?
Yes. Download the Excel template, or copy a template into your Data Studio, Power BI, or Tableau account. You can add charts, swap fields, change the date range, or apply your brand colors. Agencies can keep one layout and connect a copy to each client’s accounts. Windsor.ai keeps the data refreshed in whichever layout you choose.
Where are my Windsor.ai dashboards stored?
Your dashboards run in your reporting tool, not in Windsor.ai. You open them in Data Studio, Power BI, Tableau, or Excel, and Windsor.ai refreshes their data so it’s up to date. Ask questions about your data by connecting Windsor.ai to Claude or ChatGPT.
Which data sources can an executive dashboard pull from?
Windsor.ai connects to 350+ data sources, including Google Ads, Meta Ads, GA4, HubSpot, Salesforce, QuickBooks, and Stripe. The templates on this page cover ad platforms, GA4, Search Console, and CRM data. You can use the same process to bring data from other sources into Data Studio, Power BI, Tableau, or Excel.
Can a client connect their own ad accounts?
Yes. Send the client an Authorize via Link URL from your Windsor.ai account settings. The client signs in to Google Ads, Meta Ads, or GA4 and picks the accounts to share, without creating a Windsor.ai account or sharing a password. The connection then appears under Data Sources in your account, ready for the templates on this page.
Tired of juggling fragmented data? Get started with Windsor.ai today to create a single source of truth


