Destinations
 Data sources
 AI insights
 About us
 Careers
 Security
 Customer reviews
 Contact us
 Affiliate program
 Solution partners
 Template gallery
 Looker Studio templates
 Power BI templates
 Excel templates
 Google Sheets templates
 Tableau templates
 Facebook Ads templates
 Google Ads templates
 Data fields & Metrics
 AI prompt library & Guides
 Product documentation
 API documentation
 Case studies
 Blog
Blog Data models
 Windsor vs Supermetrics
 Windsor vs Funnel.io
 Windsor vs Fivetran
 Windsor vs Rivery
 Windsor vs Portermetrics
 Windsor vs Coupler.io
 Last updated: 20 August 2026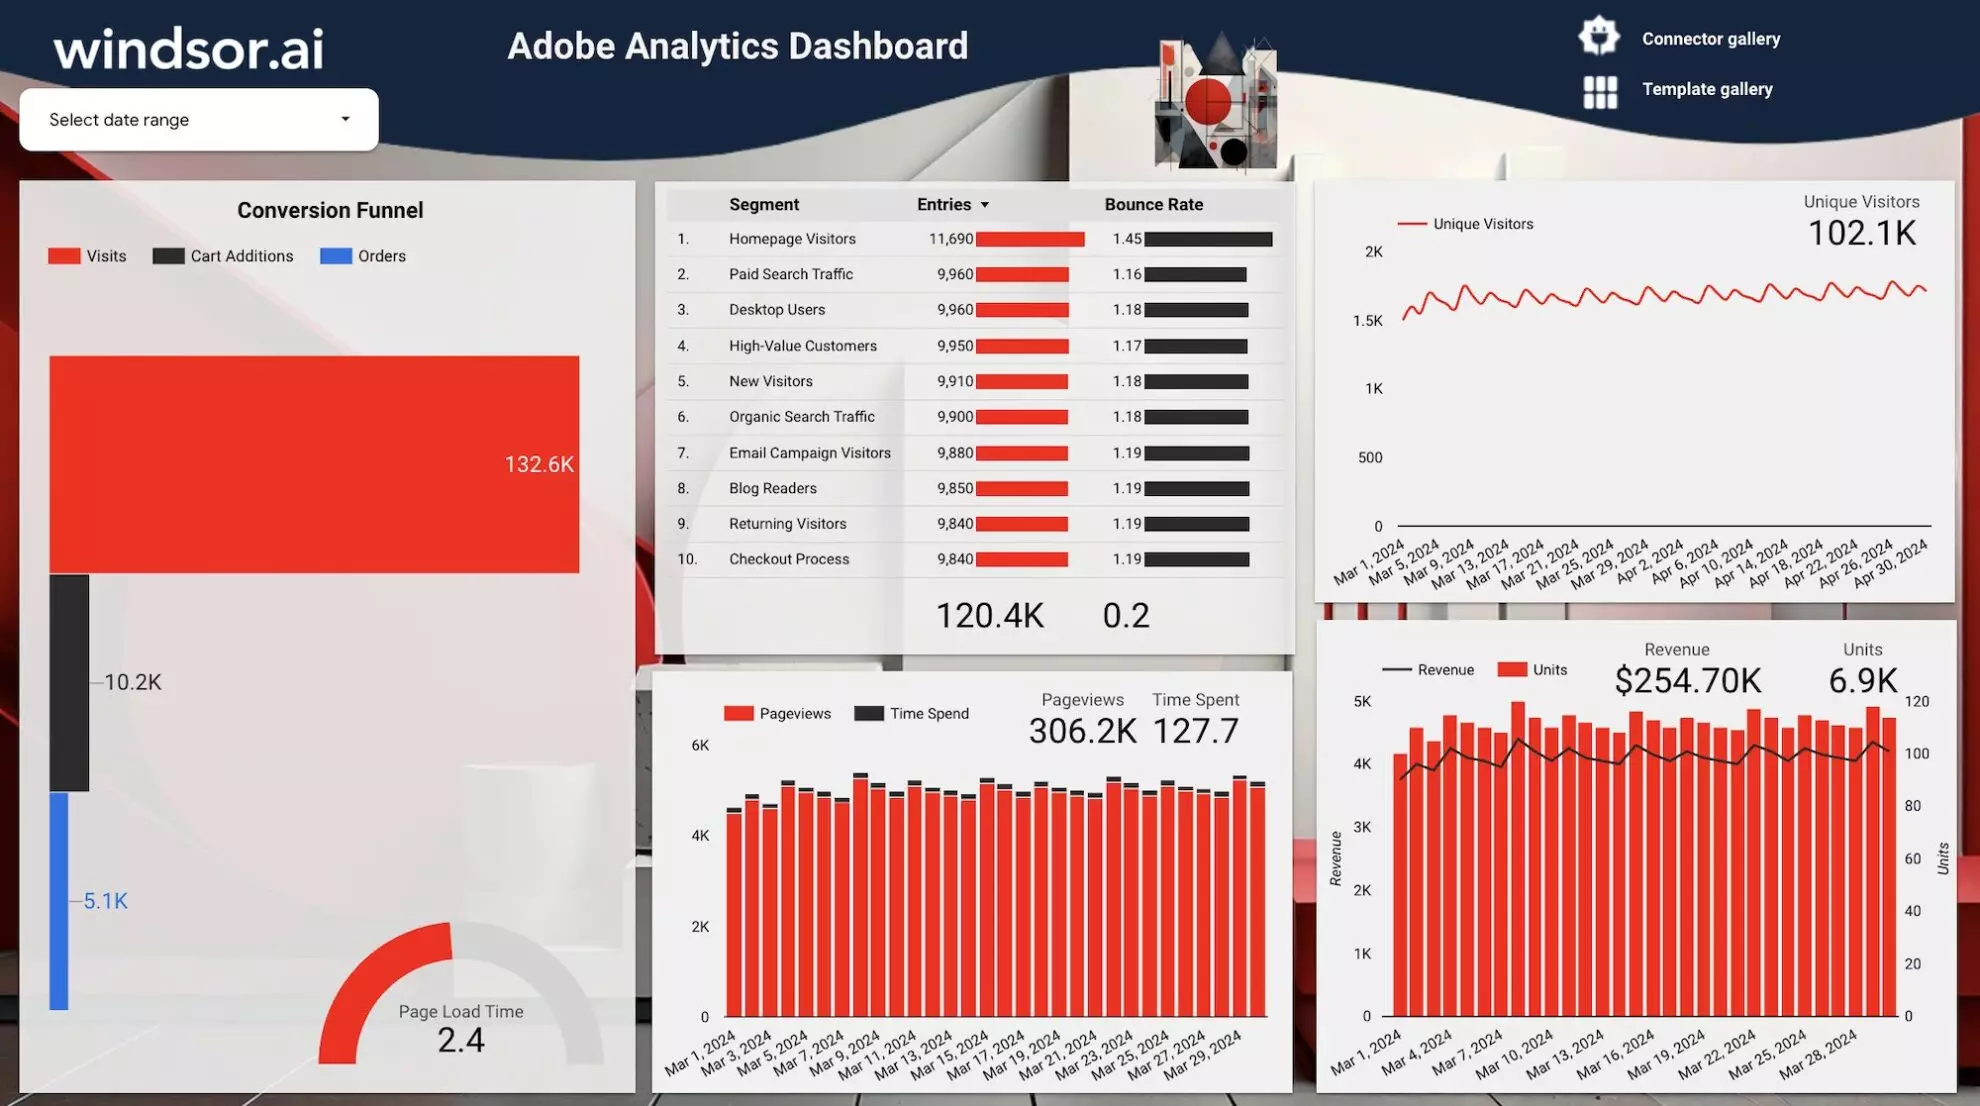




You can generate informative and visually appealing marketing reports with free Adobe Analytics dashboard template on Looker Studio. Keep teams and other stakeholders constantly informed about your website performance, customer behavior, and more. The dashboard has a user-friendly interface, so navigation is hassle-free. Enjoy customizability in creating reports that communicate effectively to your target audience.
What is Adobe Analytics on Looker Studio Reporting Dashboard?
Adobe Analytics on the Looker Studio reporting dashboard is a tool that transforms raw data into valuable insights. It simplifies reporting by allowing users to powerfully visualize data through bar graphs, line charts, tables, and more, making it easier to interpret key metrics.
With pre-built templates, you can track important KPIs like page views, time spent on your site, orders, page load time, and bounce rates. These insights help you determine if your business is on the right track and whether your strategies are effective. By continuously monitoring your data, you can make ongoing improvements, driving consistent growth and success.
Why Is Adobe Analytics Reporting Important?
Customer data is essentially a gold mine. It contains a wealth of information that can make your business successful if interpreted correctly and acted on. Adobe Analytics reporting helps analyze this data in real time, so you can understand what clients want or are looking for. By acting from a point of knowledge rather than guesswork, you are able to develop better marketing strategies and tailor digital products to meet customer needs and potentially increase demand.
Adobe Analytics dashboard templates are robust. This allows you to dig deep into your data, focusing on specific details to answer questions regarding your business and customers. You can understand sales trends, preferred content, product features being used, or errors users encounter while interacting with your site.
Benefits of Using Adobe Analytics Reporting Dashboards
Adobe Analytics report templates add incredible value to your business and provide the direction you need to make smart decisions to enhance your competitiveness. Discover more benefits below:
Generate custom cross-channel reports
Create comprehensive, customizable reports that merge data from Adobe Analytics with other marketing platforms like Facebook, Google Ads, and CRM systems. Have a detailed overview of how various touchpoints lead to conversions. You can also analyze marketing ROI better and improve your strategies for improved campaign results.
Enjoy customizable dashboards
Go beyond the standard reporting capabilities by adjusting the Adobe Analytics dashboards to focus on certain goals, business needs, or KPIs. Highlight customer behavior, compare multi-channel performance and track conversions. You can decide the layout design and metrics you want to meet your unique requirements.
Automated report delivery
Adobe Analytics dashboards automatically generate and schedule reports, ensuring you receive the latest insights directly to your inbox. There is no need for manual updates, and the teams within the organization know what’s going on at all times. This leads to better decision-making based on current performance trends.
Perform advanced visualization
Take advantage of advanced visualization features to interpret large, complex data easily. Use custom charts, heat maps, and interactive graphs to outline key customer trends, compare performance across different segments, or identify anomalies. Understand campaign effectiveness and plan better for more impactful results.
How to use it
- Configure the Looker Studio Connector: Adobe Analytics 2.0 (or Adobe Analytics)
- Once you finish installing the connector open the Adobe Analytics Dashboard and make a copy of it (File -> Make a copy)
- Select the newly created data source.
- Now your dashboard is set up
FAQs
What is Adobe Analytics used for?
Adobe Analytics is really used for enhancing marketing strategies, customizing email campaigns, improving customer experiences, and supporting data-driven decisions. Ultimately, businesses are able to boost conversions, engagement, and overall performance.
How much is Adobe Analytics Dashboard?
The Adobe Analytics dashboard is offered at zero cost by Windsor.ai.
What is Looker Studio?
Looker Studio is a cloud-based tool by Google used to generate reports and dashboards automatically. It comes with lots of features, including embedded widgets like charts, graphs, and scatter plots to help interpret data. The platform also promotes collaboration by enabling teams to share reports and make joint decisions.