 AI insights
 About us
 Careers
 Security
 Customer reviews
 Contact us
 Affiliate program
 Solution partners
 Looker Studio templates
 Tableau templates
 Facebook Ads templates
 Google Ads templates
 Data fields & Metrics
 AI prompt library & Guides
 Product documentation
 API documentation
 Case studies
 Blog
Blog Data models
 Windsor vs Supermetrics
 Windsor vs Fivetran
 Windsor vs Portermetrics
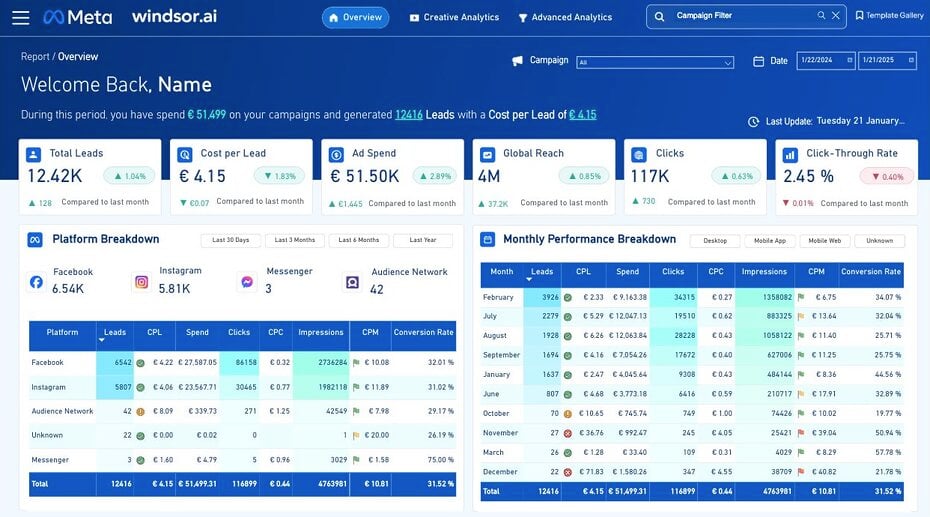
Are you looking to optimize your Meta Ads campaigns while saving time on performance analysis? This free Meta Ads Lead Generation Dashboard Template, built for Power BI, provides a comprehensive solution for tracking and improving your campaign performance.
Template links
The template is available both as:
What is the Meta Ads Lead Generation Dashboard Template?
The Meta Ads Lead Generation Dashboard Template is a Power BI reporting tool that showcases key performance metrics from your Meta Ads campaigns in an intuitive and visually engaging format. With this Power BI template, you can:
- Analyze metrics such as leads, ad spend, clicks, CPC, CPM, impressions, and engagement rates.
- Gain insights into campaign performance across platforms like Facebook, Instagram, and Messenger.
- Compare performance over customizable date ranges.
- Make data-driven decisions to optimize your marketing budget and maximize ROI.
This ready-to-use Power BI dashboard template connects seamlessly with your Meta Ads account, automating the reporting process and eliminating manual data preparation.
Why Use a Meta Ads Lead Generation Dashboard?
1. Save Time with Automated Reporting
Stop wasting time manually exporting and analyzing data. This Power BI dashboard automates the reporting process, pulling real-time data directly from your Meta Ads account. With pre-built visuals and KPIs, you’ll have a detailed view of your campaign performance in just minutes.
2. Optimize Campaign Performance
The Power BI dashboard highlights key metrics such as cost per lead (CPL), conversion rate, and click-through rate (CTR), enabling you to:
- Identify top-performing platforms and campaigns.
- Optimize underperforming ads.
- Adjust targeting, placements, and bids to improve performance.
3. Real-Time Insights
Track your Meta Ads campaigns in real time and quickly act on opportunities or mitigate risks. Real-time monitoring with Power BI ensures your lead generation efforts stay aligned with your marketing objectives.
4. Comprehensive Visualizations
The Power BI dashboard provides easy-to-read charts and tables for a deeper understanding of your campaign data. From platform analytics to creative performance, the visuals help you make informed decisions effortlessly.
Key Features of the Dashboard
1. Platform Analytics
Analyze performance across Meta platforms such as Facebook, Instagram, Messenger, and Audience Network with metrics including:
- Leads
- Cost per Lead (CPL)
- Spend
- Clicks
- CPC, CPM, and Impressions
- Conversion Rate
Easily identify which platform delivers the best results and adjust your strategies accordingly.
2. Campaign Performance Breakdown
Drill down into individual campaigns to analyze metrics like:
- Total leads generated
- Cost per lead and spend
- Conversion rate and engagement rate
- Clicks and impressions
Understand which campaigns are driving the most value and where you can optimize for better results.
3. Creative Performance Breakdown
Evaluate the effectiveness of your ad creatives by analyzing:
- Leads and CPL for each creative
- Conversion rates
- Impressions and engagement rates
- Cost per click and cost per mile (CPM)
This feature helps you pinpoint which creatives resonate most with your audience.
4. Monthly Performance Trends
Track your campaign performance over time with a breakdown by month. Analyze key metrics such as:
- Leads generated each month
- Monthly CPL and spend
- Changes in conversion rates and engagement levels
Use these insights to refine your long-term advertising strategy.
Instructions
To get started you will need to:
a) Have access to your Facebook Ads account
b) Set up a Windsor.ai account.
c) Connect your data sources to your Windsor.ai.
1. Register
Register to Windsor.ai or login https://onboard.windsor.ai/ if you already have an account on.
2. Select your source
You need to select Facebook Ads as a Data Source and Grant Access to Windsor.ai.
3. Grant Access to Facebook Ads account
a) Click on https://onboard.windsor.ai/
b) Click on Facebook Ads and connect your data.
4. Select Destination
Go to Destination. Choose “Power BI Desktop (Web)”. Copy your API Key.
5. Download The Template
Download the template here for Desktop or connect your data to the Web template.
6. Input your data in Power BI
- Open the template in Power BI and input the following:
- API Key
-
date_preset (e.g.,
last_14d) - ad_account_id
Refer to the image below for guidance:

Step 5: Customize Your Dashboard
Filter the dashboard to focus on:
- Date ranges
- Platforms (Facebook, Instagram, Messenger, etc.)
- Campaigns and creatives
Tailor the Power BI template to meet your specific business needs.
Step 6: Analyze and Optimize
Leverage the insights from the Power BI dashboard to:
- Allocate your budget more effectively.
- Optimize ad placements, targeting, and creatives.
- Improve engagement rates and conversion performance.
Benefits of Using This Dashboard
- Free Access: This Power BI dashboard template is free to use, allowing you to automate reporting without additional costs.
- Seamless Integration: Connect your Meta Ads account easily with Windsor.ai.
- Real-Time Insights: Access real-time data to make timely adjustments to your campaigns.
- Customizable Visuals: Adjust the dashboard visuals and metrics to suit your business goals.
FAQs
What is Meta Ads?
Meta Ads is an advertising platform that allows businesses to run targeted campaigns on Facebook, Instagram, Messenger, and Audience Network. It helps businesses achieve objectives such as lead generation, brand awareness, and engagement.
What metrics are included in the dashboard?
The Power BI dashboard includes:
- Leads and CPL
- Ad spend
- Clicks, CPC, and CPM
- Conversion rates and engagement rates
- Monthly trends
How much does the template cost?
The Meta Ads Lead Generation Dashboard Template for Power BI is free. However, you may need a data integration tool like Windsor.ai, which could incur minimal costs.
Is the dashboard customizable?
Yes, the dashboard is fully customizable. You can modify filters, visuals, and metrics to meet your specific needs.
Conclusion
The Meta Ads Lead Generation Dashboard Template for Power BI is an essential tool for marketers seeking to streamline reporting and enhance campaign performance. With real-time data, automated insights, and customizable visuals, this Power BI template will elevate your Meta Ads strategy. Download the template today and start optimizing your campaigns for better ROI!
Read also: