 AI insights
 About us
 Careers
 Security
 Customer reviews
 Contact us
 Affiliate program
 Solution partners
 Looker Studio templates
 Tableau templates
 Facebook Ads templates
 Google Ads templates
 Data fields & Metrics
 AI prompt library & Guides
 Product documentation
 API documentation
 Case studies
 Blog
Blog Data models
 Windsor vs Supermetrics
 Windsor vs Fivetran
 Windsor vs Portermetrics
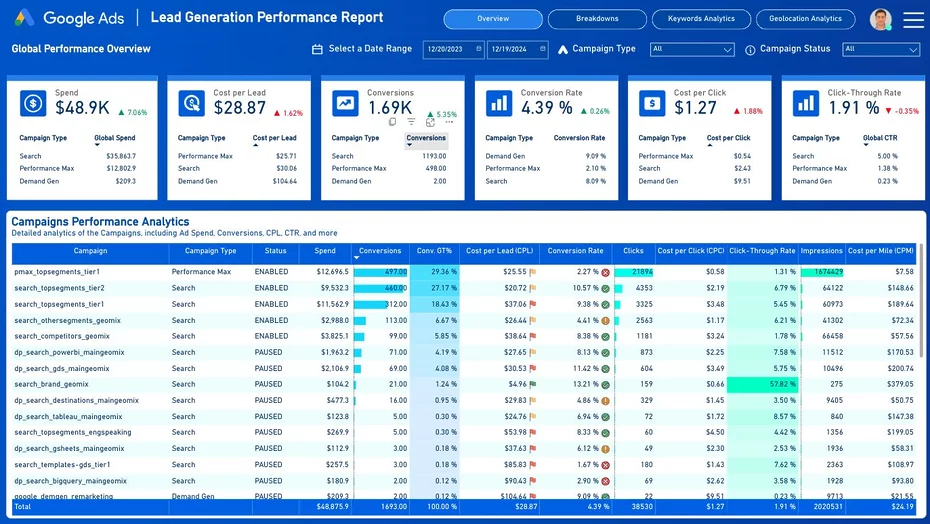
Are you looking to optimize your Google Ads campaigns while saving time on performance analysis? This free Google Ads Lead Generation Dashboard Template, built for Power BI, offers a complete solution for tracking and improving your campaign performance. With automation and real-time data insights, this Power BI template will simplify how you evaluate the success of your lead generation efforts.
What is the Google Ads Lead Generation Dashboard Template?
The Google Ads Lead Generation Dashboard Template is a Power BI reporting tool that displays crucial performance metrics from your Google Ads campaigns in a clear, visually engaging format. With this Power BI template, you can:
- Analyze metrics like ad spend, conversions, CPC, CTR, CPM, and more.
- Gain insights into campaign performance by geolocation, keyword, and campaign type.
- Compare data over customizable date ranges.
- Make informed decisions to optimize your marketing budget and maximize ROI.
This ready-to-use Power BI dashboard template (see demo below) connects seamlessly with your Google Ads account, automating the reporting process and eliminating manual data compilation.
Why Use a Google Ads Lead Generation Dashboard?
1. Save Time with Automated Reporting
Stop wasting time manually exporting and analyzing data. This Power BI dashboard automates the reporting process, pulling real-time data directly from your Google Ads account. With pre-built visualizations and KPIs, you’ll have a detailed view of your campaign performance within minutes.
2. Optimize Campaign Performance
The Power BI dashboard highlights key metrics like conversion rate, cost per click (CPC), cost per lead (CPL), and click-through rate (CTR), allowing you to:
- Identify top-performing campaigns.
- Spot underperforming ads.
- Adjust bids, keywords, and targeting to improve results.
3. Real-Time Insights
Track your campaigns in real time and act quickly to seize opportunities or mitigate risks. Real-time monitoring with Power BI ensures that your lead generation efforts stay on track and aligned with your marketing objectives.
4. Enhanced Visualizations
The Power BI dashboard offers intuitive charts and tables for easier interpretation of complex data. From geolocation analytics to keyword performance, the visuals help you make data-driven decisions effortlessly.
Key Features of the Dashboard
1. Geolocation Analytics
Analyze campaign performance by country with metrics such as:
- Ad spend
- Conversions
- Cost per Acquisition (CPA)
- Conversion rate
- CPC, CTR, and CPM
Visualize geographic performance on an interactive map, making it easy to identify regions with the highest ROI. Power BI’s mapping capabilities bring these insights to life.
2. Search Terms Analytics
Drill down into keyword-level performance:
- See which search terms drive the most conversions.
- Compare match types (exact, phrase, broad).
- Evaluate cost per lead and click-through rate for each term.
3. Campaign Performance Overview
Get a high-level view of:
- Spend by campaign type (e.g., Search, Performance Max, Demand Gen).
- Total conversions, CPL, and CTR.
- Detailed campaign breakdowns to identify top performers.
4. Advanced Breakdown Analysis
Explore your data further with:
- Conversion trends over time.
- Top keywords by conversions.
- Performance by campaign type.
Instructions
To get started you will need to:
a) Have access to your Google Ads account
b) Set up a Windsor.ai account.
c) Connect your data sources to your Windsor.ai.
1. Register
Register to Windsor.ai or login https://onboard.windsor.ai/ if you already have an account on.
2. Select your source
You need to select Google Ads as a Data Source and Grant Access to Windsor.ai.
3. Grant Access to Google Ads account
a) Click on https://onboard.windsor.ai/
b) Click on Google Ads and connect your data.
4. Select Destination
Go to Destination. Choose “Power BI Desktop (Web)”. Copy your API Key.
5. Download The Template
Download Template the template here
6. Input your data in Power BI
- Open the template in Power BI and input the following:
- API Key
-
date_preset (e.g.,
last_14d) - google_ads_account_id
Refer to the image below for guidance:

FAQs
What is Google Ads?
Google Ads is an online advertising platform that enables businesses to create ads targeting specific audiences based on keywords, demographics, and behaviors. The platform supports various ad formats, including search, display, video, and shopping ads.
What metrics are included in the dashboard?
The Power BI dashboard includes essential metrics such as:
- Ad spend
- Conversions
- Cost per Acquisition (CPA)
- Click-through Rate (CTR)
- Cost per Click (CPC)
- Cost per Mile (CPM)
How much does the template cost?
The Google Ads Lead Generation Dashboard Template for Power BI is free. However, you may need a data integration tool to connect your Google Ads account, which could incur minimal costs.
Is the dashboard customizable?
Yes, the Power BI dashboard is fully customizable. You can adjust filters, add new visuals, or modify existing ones to suit your specific needs.
Read also: