 AI insights
 About us
 Careers
 Security
 Customer reviews
 Contact us
 Affiliate program
 Solution partners
 Looker Studio templates
 Tableau templates
 Facebook Ads templates
 Google Ads templates
 Data fields & Metrics
 AI prompt library & Guides
 Product documentation
 API documentation
 Case studies
 Blog
Blog Data models
 Windsor vs Supermetrics
 Windsor vs Fivetran
 Windsor vs Portermetrics
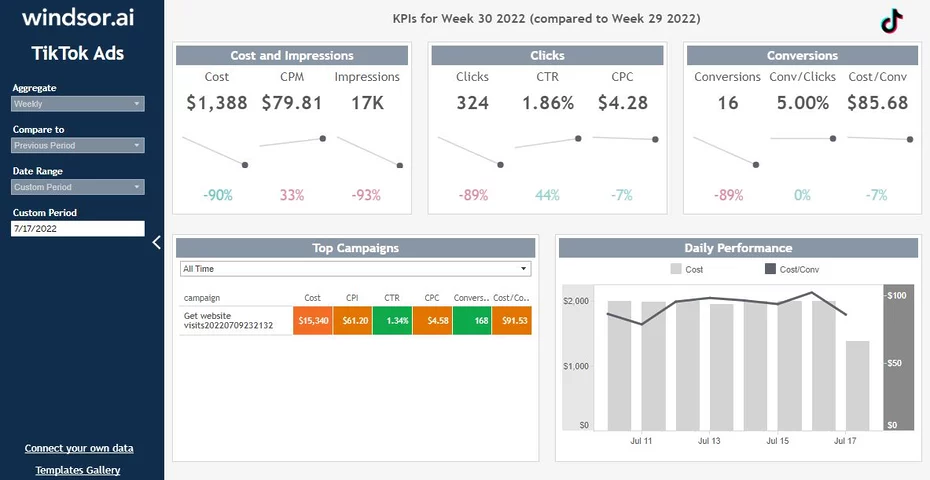
This Tableau TikTok Ads Dashboard template allows you to visualize in Tableau the performance of your TikTok Ads campaigns in a few clicks, through our dedicated Tableau Web Data Connector for TikTok Ads.
Dimensions and metrics visualized in this report:
- Cost (how much you’re spending on TikTok Ads)
- CPM (Cost per 1000 Impressions)
- Impressions (how many times your Google TikTok have been seen)
- Clicks
- CTR
- CPC
- Conversions
- Conversions per Clicks
- Cost per Conversion
In this dashboard you’ll be able to see all the above metrics for the selected time frame compared to previous time frame, as well as their trend in the last year. It allows drilling down to campaign level, for easily comparing their performance.
It also contains a powerful custom-built date selector, which isn’t available by default in Tableau.
How to use this template
If you like this Tableau TikTok Ads Dashboard Template, you can check our collection of Tableau templates.
You should also read:
Connect TikTok Ads to Snowflake
Automate TikTok ads dashboards and reports and keep your clients updated
Connect TikTok Ads to Google BigQuery
TikTok Ads Google Data Studio Connector
Connect TikTok Ads to Google Sheets
Connect TikTok Ads to Power BI
Best Social Media Dashboarr Reports
Best E-Commerce Dashboard Templates
Best Lead Generation Dashboard Templates
Best Web Analytics Report Templates
Best Data Analyst Report Templates