 AI insights
 About us
 Careers
 Security
 Customer reviews
 Contact us
 Affiliate program
 Solution partners
 Looker Studio templates
 Tableau templates
 Facebook Ads templates
 Google Ads templates
 Data fields & Metrics
 AI prompt library & Guides
 Product documentation
 API documentation
 Case studies
 Blog
Blog Data models
 Windsor vs Supermetrics
 Windsor vs Fivetran
 Windsor vs Portermetrics
Connect TikTok Ads to Data Studio (Looker Studio)
Easily sync TikTok Ads with Data Studio using the Windsor.ai ELT connector.
Automate reporting, track campaign performance, and analyze ad reach and engagement to make data-driven decisions.
Forget CSVs. Stop copy/paste. Connect data in 2 minutes. No code required.


Level up your TikTok Ads analytics with Data Studio integration
TikTok Ads’ in-app analytics offers key metrics on ad performance, targeting, and engagement. Integrating this data into Data Studio with the Windsor.ai connector gives you access to advanced visualization tools, transforming your analytics workflow with these features:

Centralize marketing analytics
Centralize marketing analytics
Managing performance metrics across various platforms can be time-consuming, especially when running both organic and paid campaigns. Windsor.ai simplifies this by consolidating all your marketing data into Data Studio with just a few clicks. Easily connect the required data sources and analyze metrics together or separately on a single dashboard, streamlining your cross-channel marketing insights

Visualize TikTok Ads data for actionable insights
Visualize TikTok Ads data for actionable insights
Leverage pre-built, customizable Data Studio dashboards to transform your TikTok Ads data into clear visuals. Analyze key metrics like reach, engagement, and conversions alongside other vital information. Compare performance across different periods and platforms to identify the marketing strategies that drive the best results and help achieve your goals.

Automate real-time TikTok Ads reporting
Automate real-time TikTok Ads reporting
Windsor.ai automatically sends and updates your TikTok Ads data in Data Studio, ensuring your team always has access to the latest metrics. This enables faster decision-making and real-time campaign optimization. Additionally, by integrating Data Studio with collaboration tools like Google Workspace, your teams can seamlessly analyze and share insights from a centralized platform.
Using Windsor.ai connector to import data from TikTok Ads into Data Studio
Most existing methods of integrating TikTok Ads with Data Studio require manual operations, technical know-how, or expensive tools. Windsor.ai eliminates these hurdles with the no-code ELT connector, automating data integration for effortless reporting and advanced analytics.
In just a few clicks, Windsor.ai syncs your TikTok Ads data with Data Studio, empowering you to refine ad strategies, boost engagement, and drive higher ROI through actionable insights.

How to connect TikTok Ads to Data Studio in Windsor.ai
Make sure you have the following prerequisites before setting up the connector:
- TikTok Ads account (Visit our privacy policy and terms of use)
- Google account for Data Studio integration
- Active Windsor.ai account
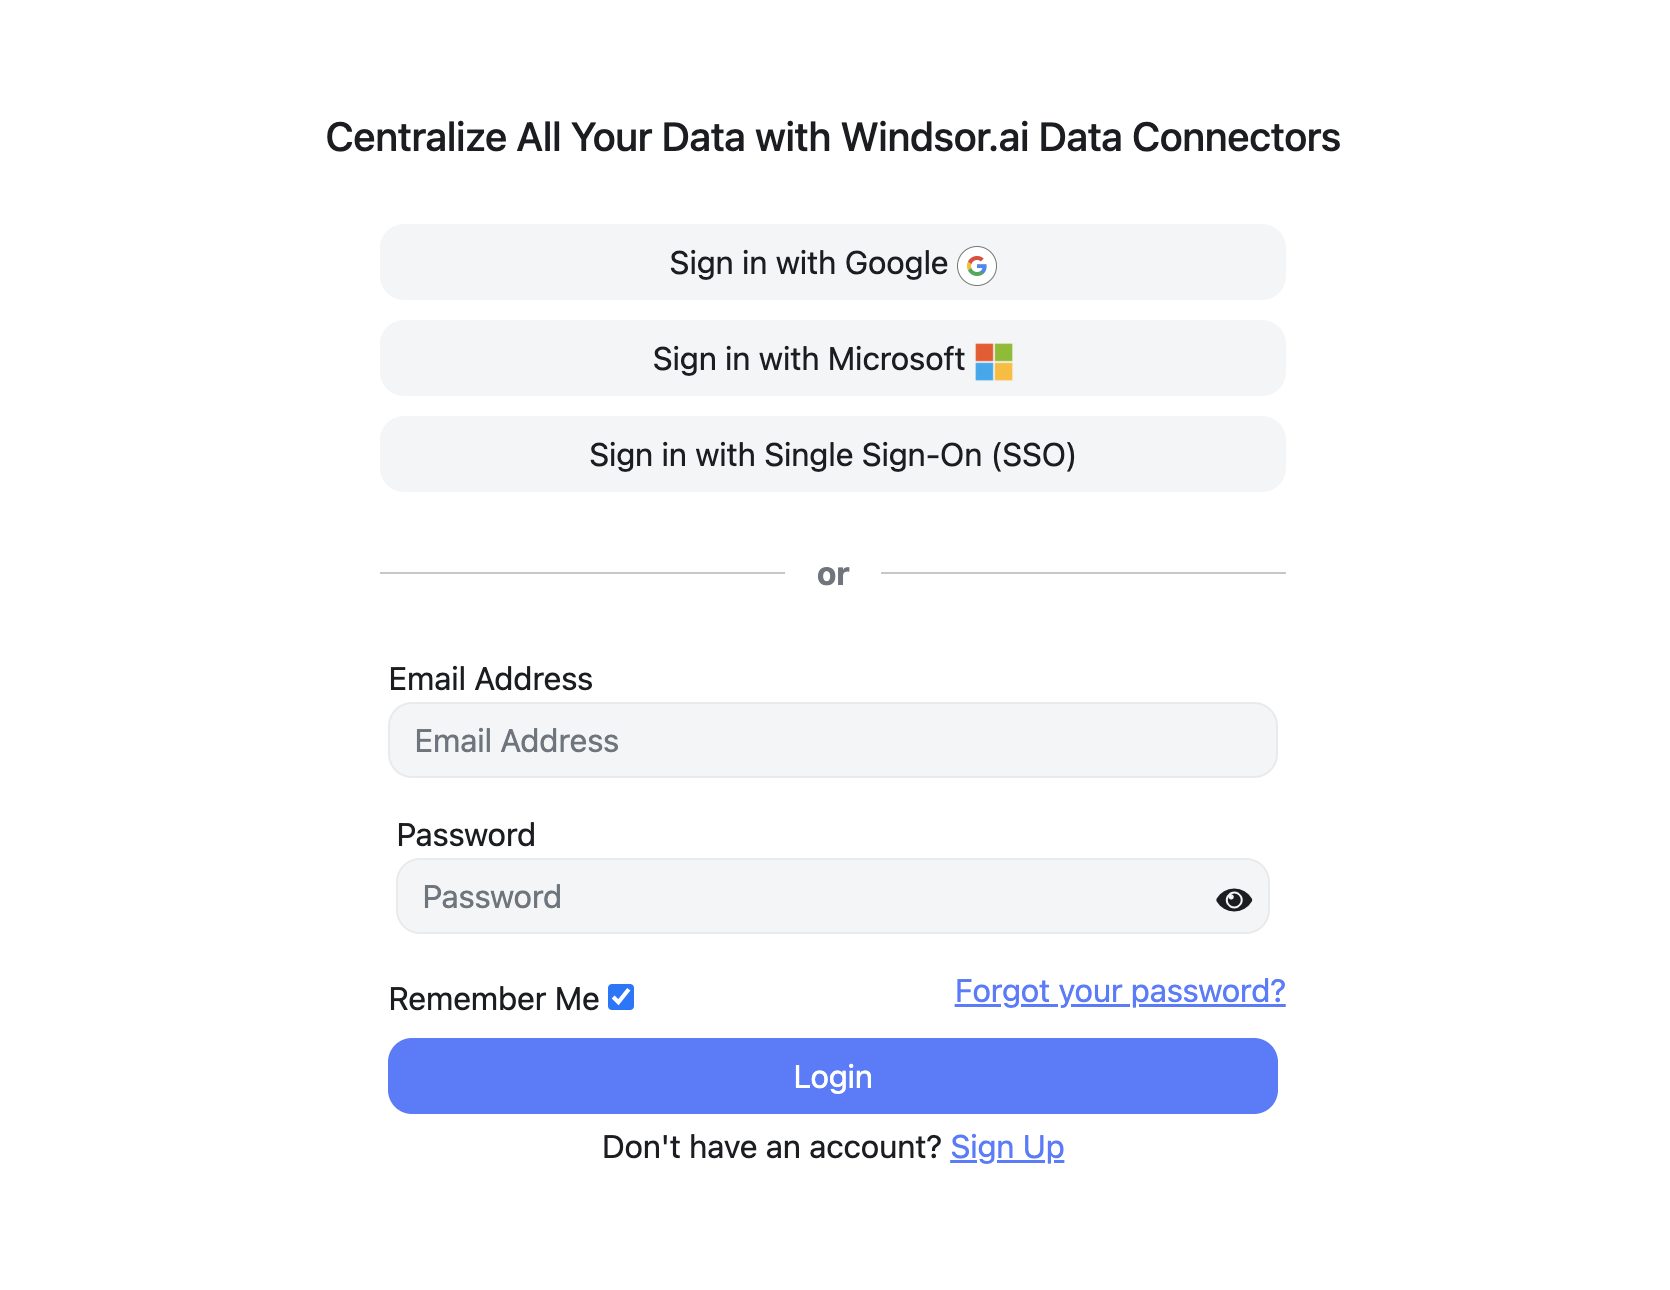
Register and log in to Windsor.ai
Create a new Windsor.ai account or log in if you already have one.
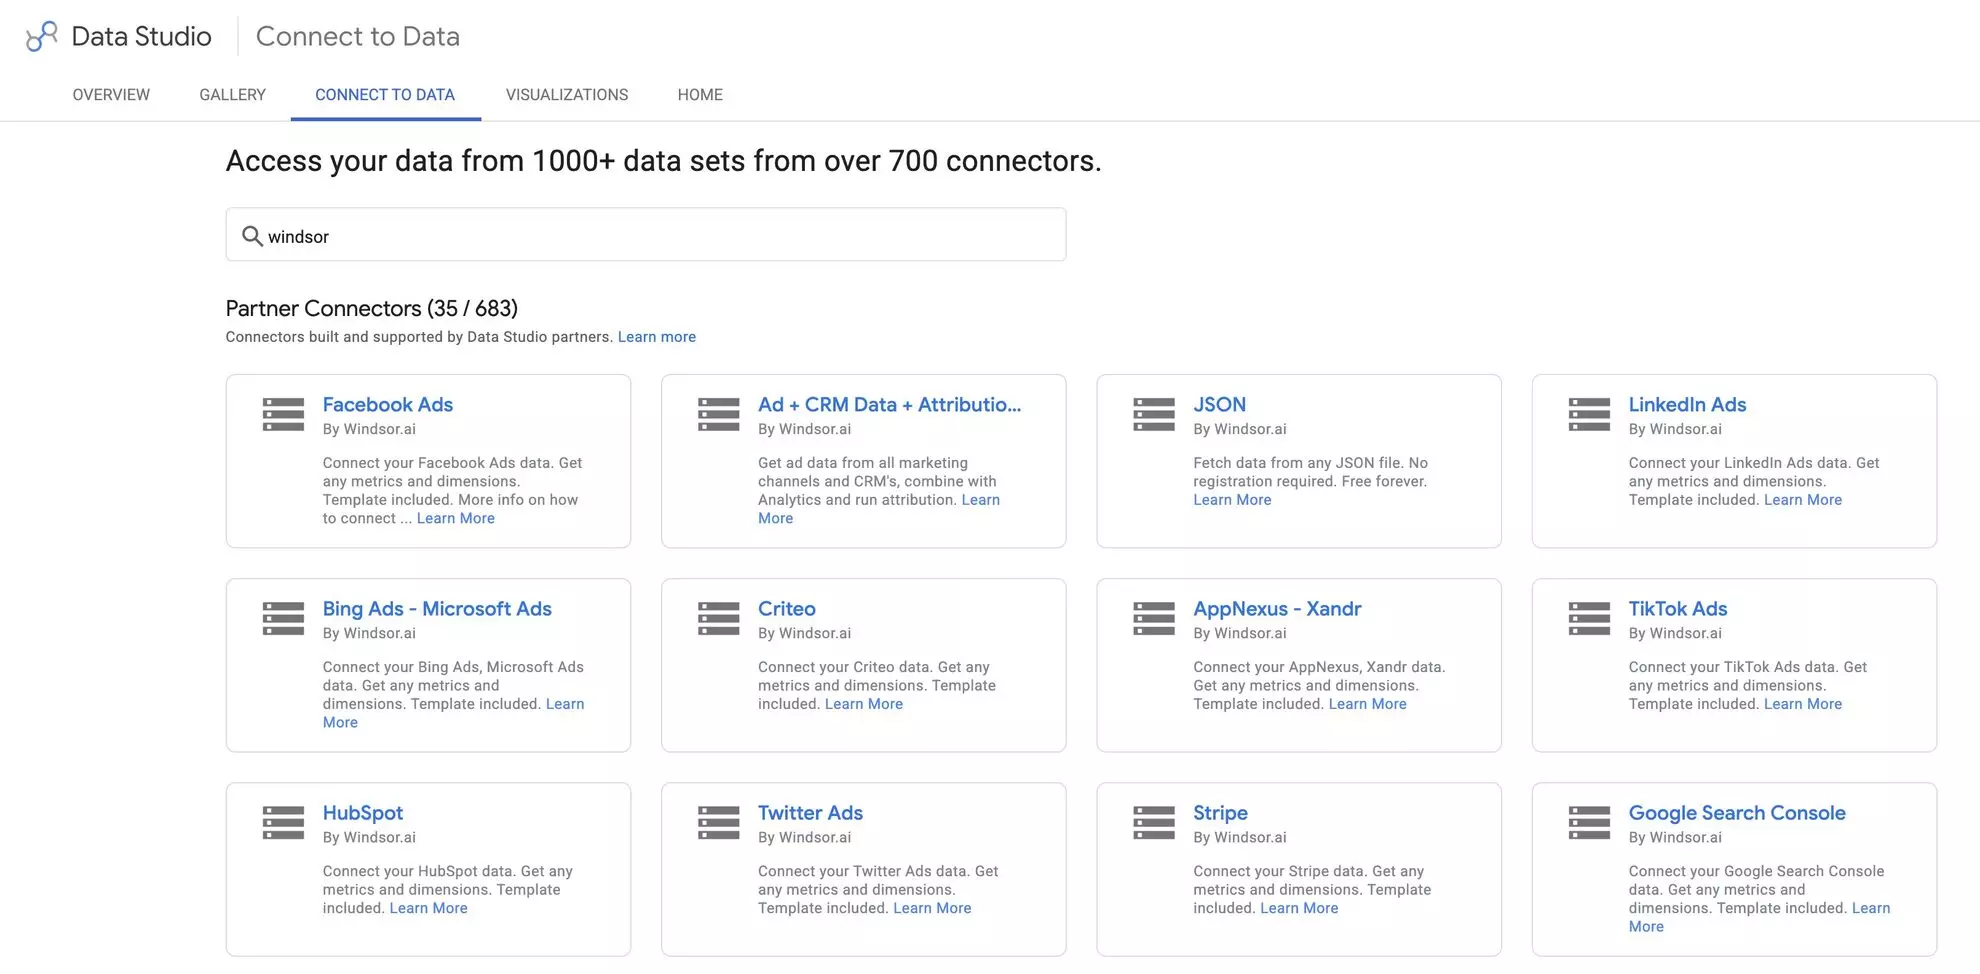
Select your data source
Choose TikTok as your data source and grant access to Windsor.ai.

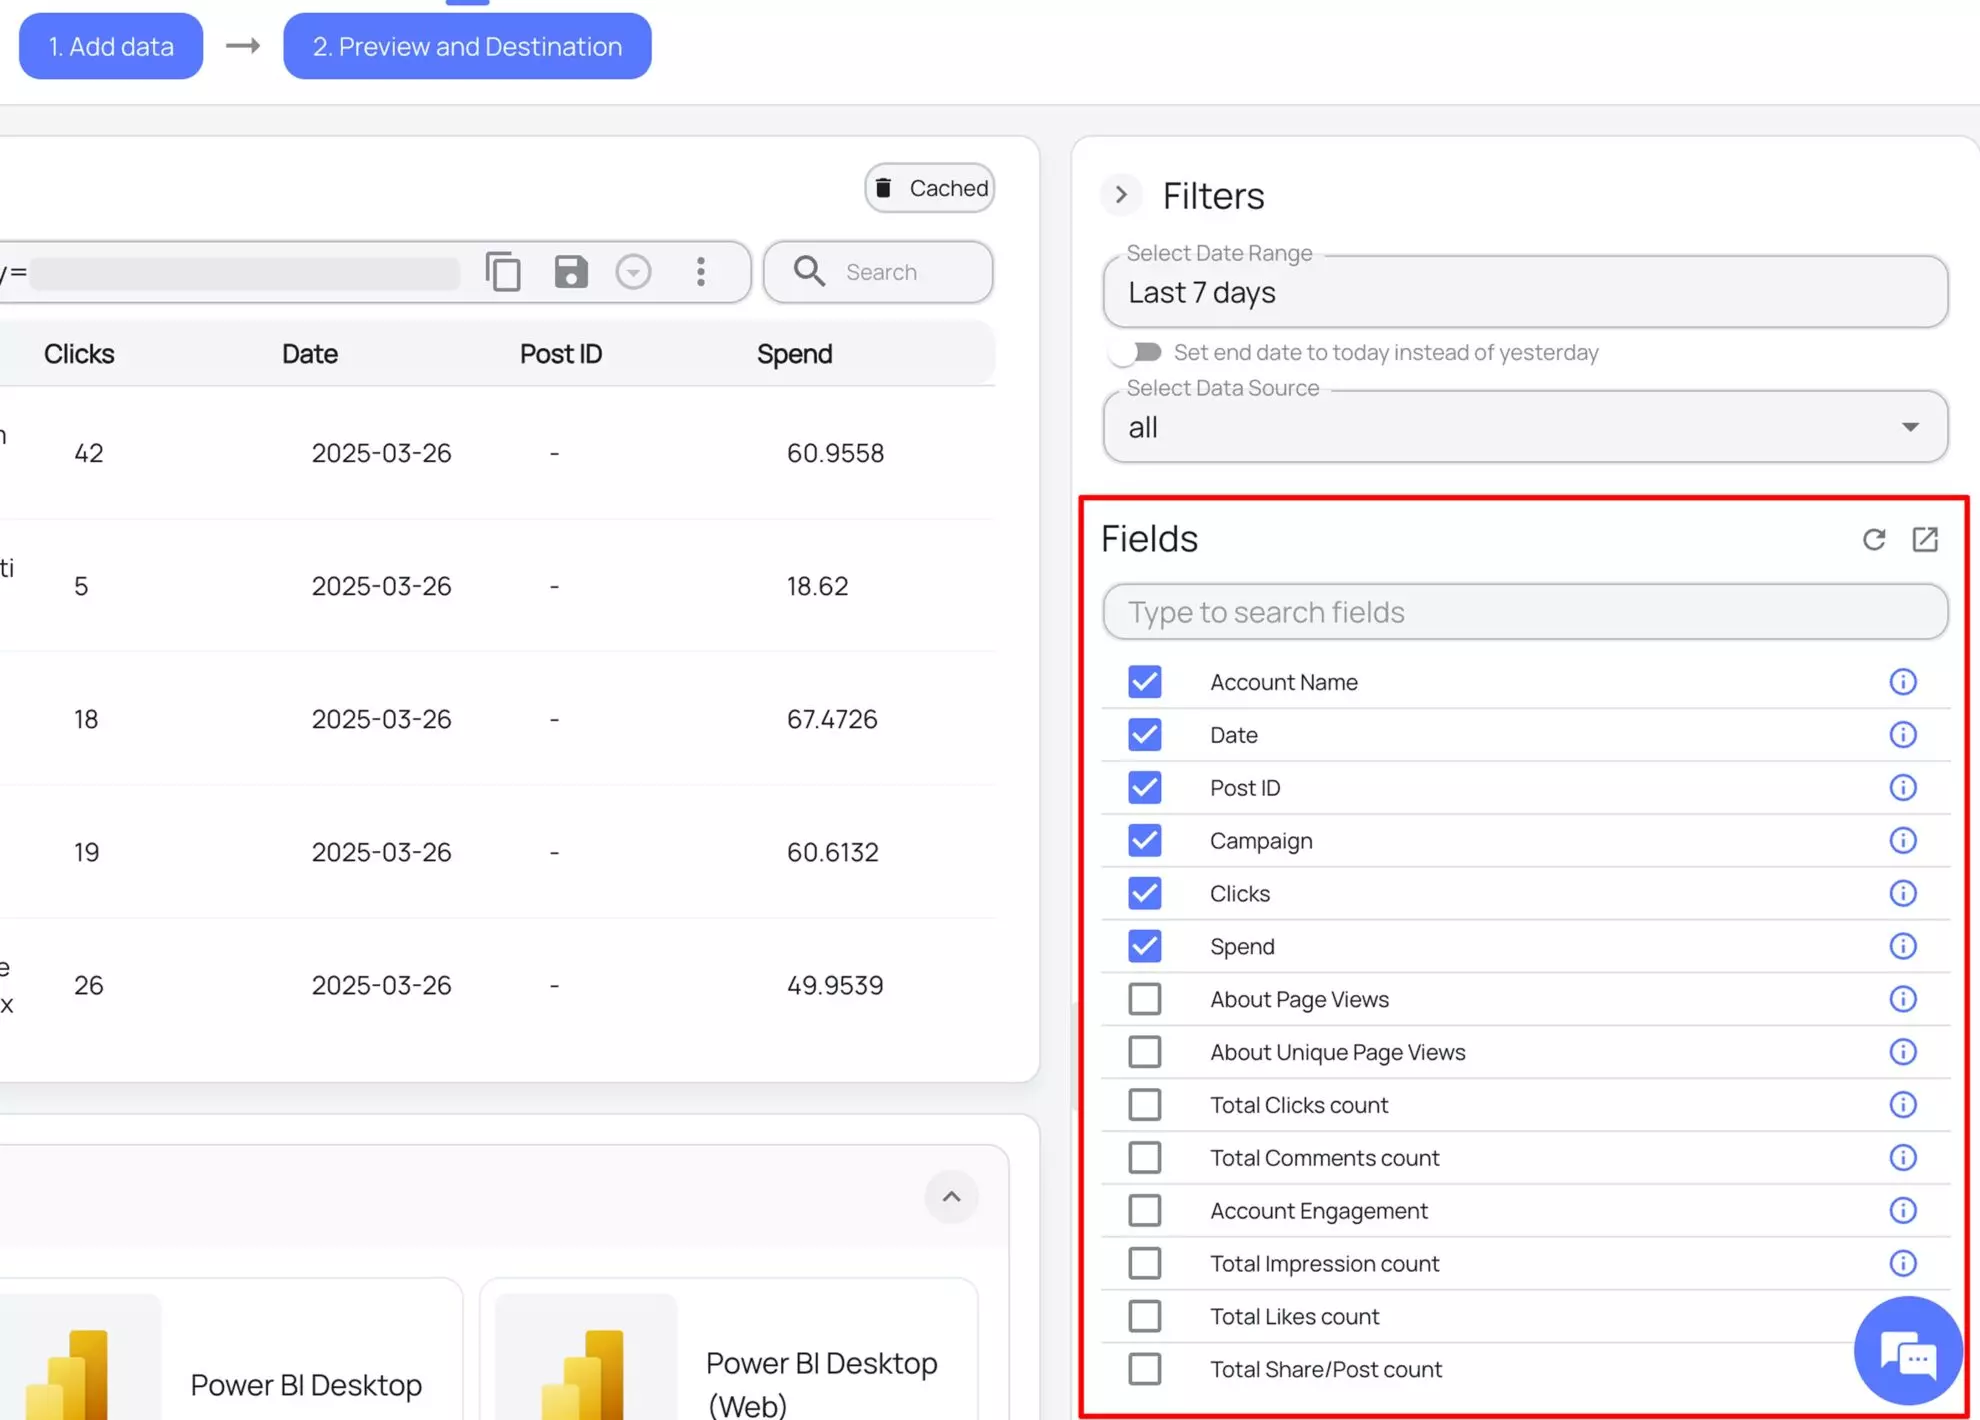
Select the reporting metrics and dimensions
Choose the TikTok Ads fields you want to import into Data Studio on the right side and preview your data before export.
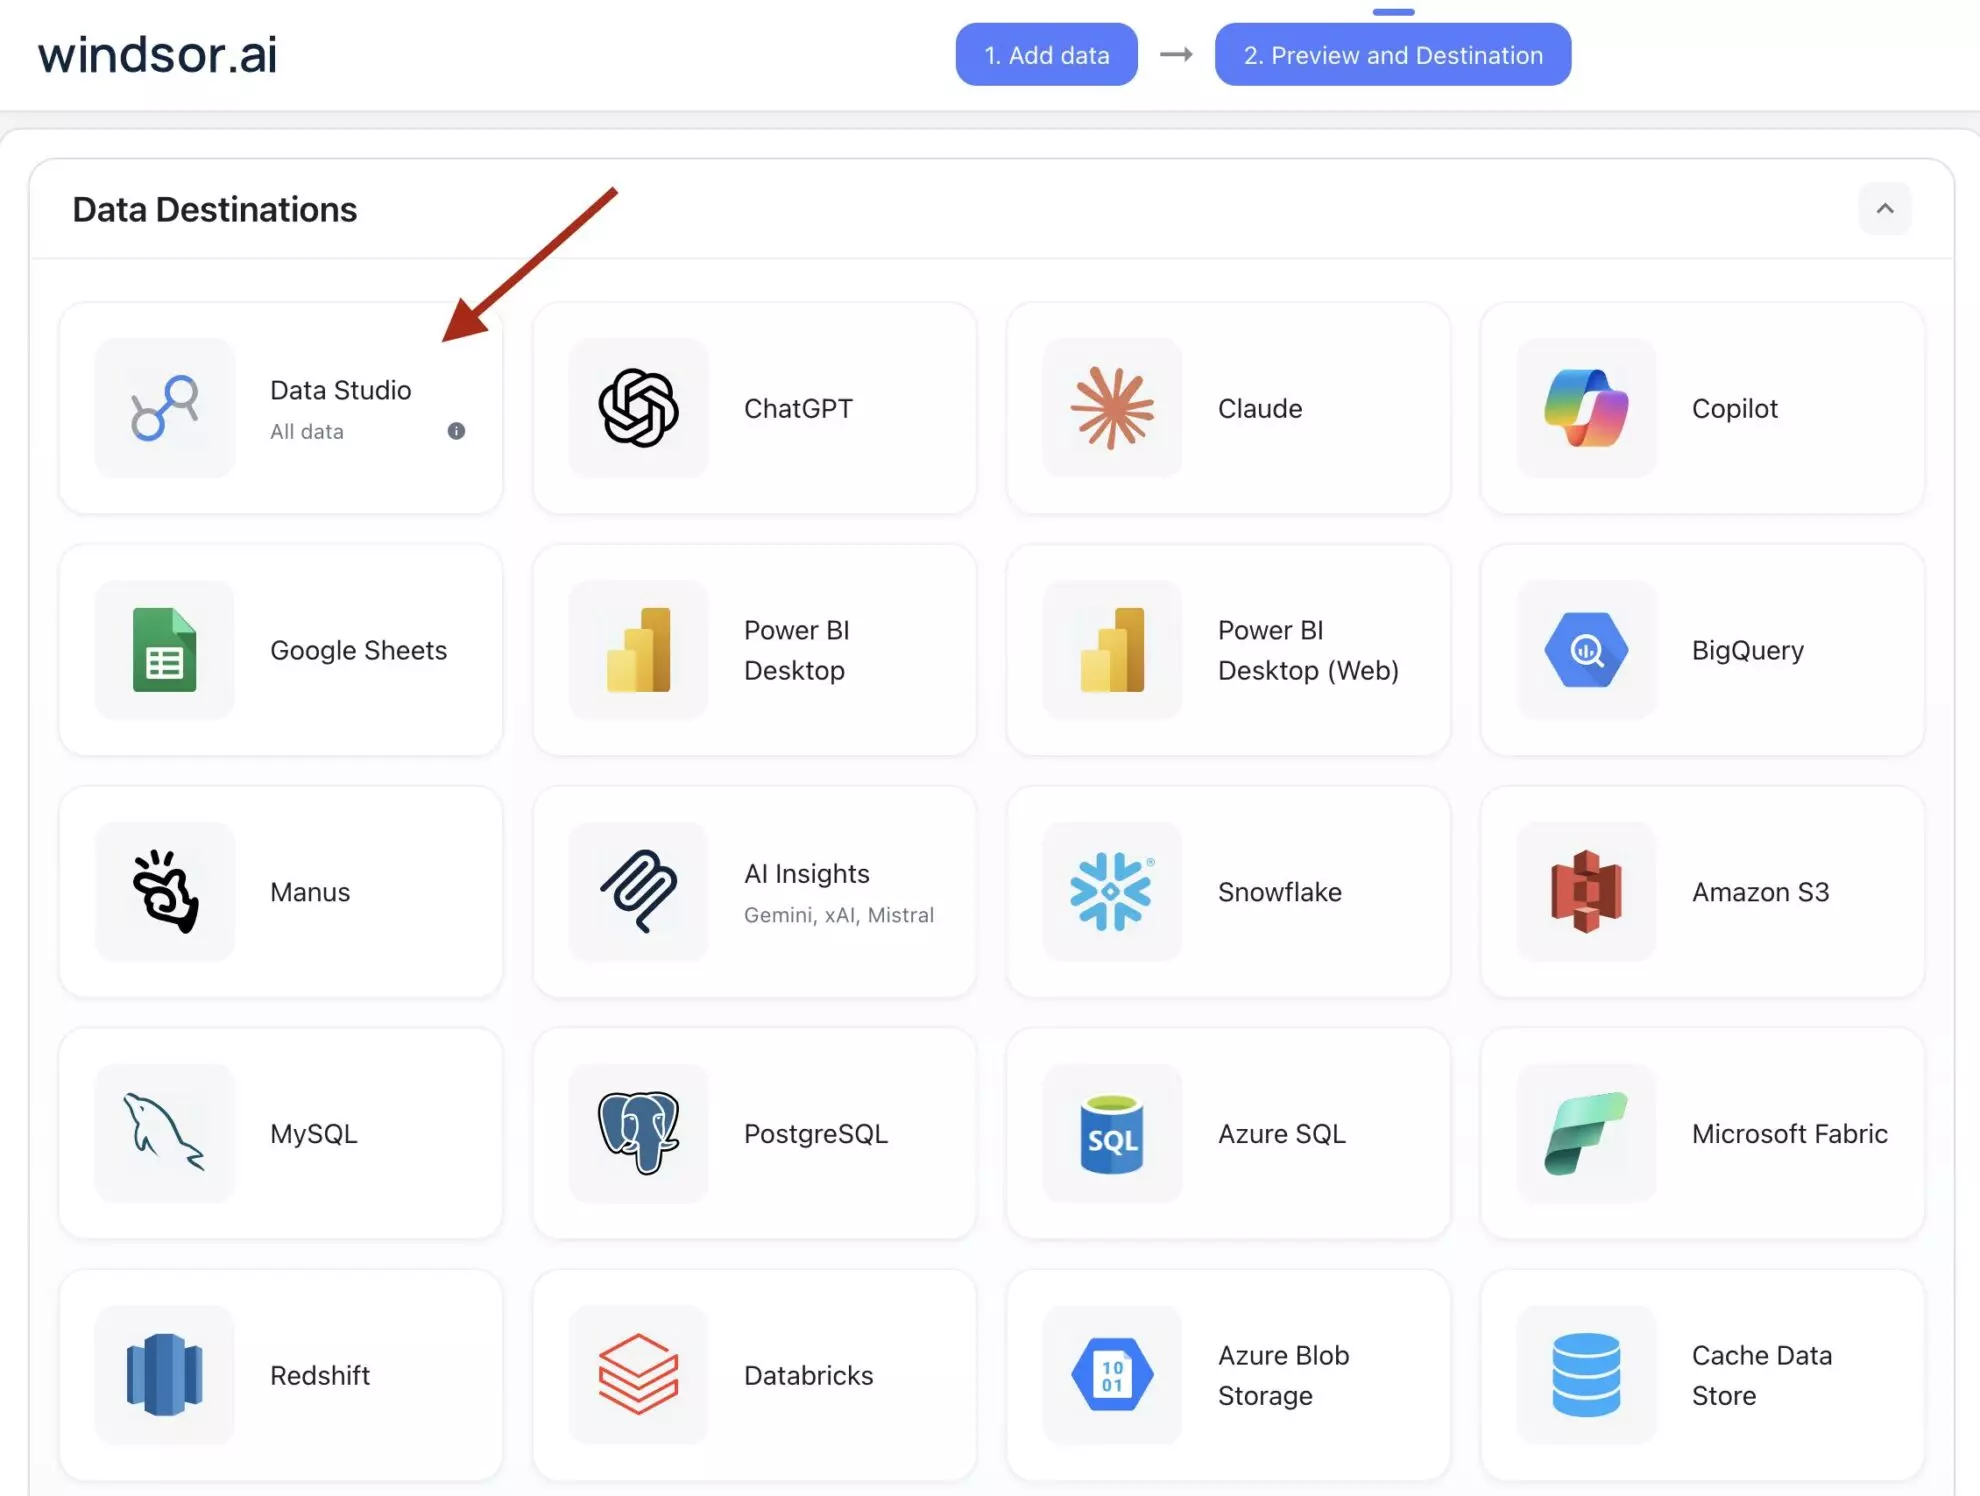
Select Data Studio as your data destination
Scroll down to the list of data destinations and click Data Studio. Install the Windsor.ai connector by authorizing your account, selecting the required TikTok Ads account(s), and clicking Connect → Create Report.
FAQs
What is Data Studio?
Data Studio (Looker Studio) is a robust data visualization and reporting platform by Google designed to help businesses create customizable, interactive dashboards for analyzing data from various sources. Its user-friendly drag-and-drop interface facilitates exploring data and extracting the specific insights you need. When paired with Windsor.ai for automated reporting, Data Studio enables seamless sharing of real-time metrics with your team and stakeholders, empowering data-driven decision-making.
Do you have helpful links to get started with integrating TikTok Ads and Data Studio using Windsor.ai?
Yes, we have helpful resources to help you get started. You can explore our official documentation and ready-to-use templates for seamless TikTok Ads to Data Studio integration with Windsor.ai:
How much time do I need to create the TikTok Ads and Data Studio integration?
With Windsor.ai’s no-code ELT connector, you can integrate TikTok Ads with Data Studio in a few minutes, benefiting from a quick and stress-free process.
How much does it cost to integrate TikTok Ads into Data Studio with Windsor.ai?
Windsor.ai’s pricing for TikTok Ads to Data Studio data integration can vary depending on your use case and data volume. We offer absolutely transparent pricing plans for diversified business needs and budgets.
Tired of manual TikTok Ads data exports? Try Windsor.ai today to automate your reporting

