 AI insights
 About us
 Careers
 Security
 Customer reviews
 Contact us
 Affiliate program
 Solution partners
 Looker Studio templates
 Tableau templates
 Facebook Ads templates
 Google Ads templates
 Data fields & Metrics
 AI prompt library & Guides
 Product documentation
 API documentation
 Case studies
 Blog
Blog Data models
 Windsor vs Supermetrics
 Windsor vs Fivetran
 Windsor vs Portermetrics
Connect TikTok Ads to BigQuery
Instantly transfer TikTok Ads data to BigQuery with Windsor.ai’s ELT connector. Generate automated reports to analyze campaign performance and audience behavior with ease.
Forget CSVs. Stop copy/paste. Connect data in 2 minutes. No code required.


Level up your analytics with TikTok Ads and BigQuery integration
Windsor.ai connector makes it easy to sync TikTok Ads with BigQuery, enabling you to harness powerful data modeling and analytics tools for actionable insights. Key benefits of this integration include:

Effectively measure your marketing ROIs
Effectively measure your marketing ROIs
Integrating TikTok Ads data into BigQuery, along with metrics from other platforms like Facebook Ads, Google Ads, email, and CRMs, provides a holistic view of your marketing efforts. Windsor.ai enables seamless cross-channel analysis by merging cost data with performance metrics, helping you accurately measure ROI, assess campaign effectiveness, and optimize budget allocation.

Leverage advanced analytical features
Leverage advanced analytical features
BigQuery provides comprehensive analytics tools and capabilities, such as querying large datasets, performing ML-driven SQL queries, and building custom dashboards. By integrating TikTok Ads with BigQuery using Windsor.ai, you can unlock deeper insights into campaign performance, audience behavior, and marketing effectiveness—empowering you to make data-driven decisions and refine your advertising strategies.

Analyze customer purchase path
Analyze customer purchase path
Track the entire customer purchase path by integrating TikTok Ads with BigQuery. Windsor.ai’s marketing attribution software allows you to analyze customer interactions across various touchpoints—both online and offline—helping you understand how customers engage with your brand, optimize their journey, and enhance the overall experience.

Access real-time data
Access real-time data
When syncing TikTok Ads with BigQuery, Windsor.ai gives you access to real-time data, enabling timely analysis of campaign performance and key metrics. With accurate, up-to-date insights, you can stay agile by making informed decisions and quickly adapting and optimizing your marketing strategies.

Harness robust infrastructure
Harness robust infrastructure
Store your TikTok Ads data securely in the BigQuery data warehouse, benefiting from features like Google Identity and Access Management (IAM) and data encryption. BigQuery’s serverless architecture means you can focus on extracting insights without worrying about hardware or software management.
Using Windsor.ai connector to import data from TikTok Ads into BigQuery
Most available methods of integrating TikTok Ads with BigQuery involve manual operations, technical steps, or expensive solutions. Windsor.ai overcomes these barriers with its no-code ELT connector that automatically imports your TikTok Ads data into BigQuery.
In just a few clicks, Windsor.ai helps you centralize and analyze key TikTok Ads performance metrics, enabling you to understand your audience better and optimize your advertising strategies.
How to connect TikTok Ads to BigQuery in Windsor.ai
Make sure you have the following prerequisites before setting up the connector:
- TikTok for Business account with the necessary permissions
- Google Cloud Platform (GCP) account with BigQuery enabled
- Active Windsor.ai account
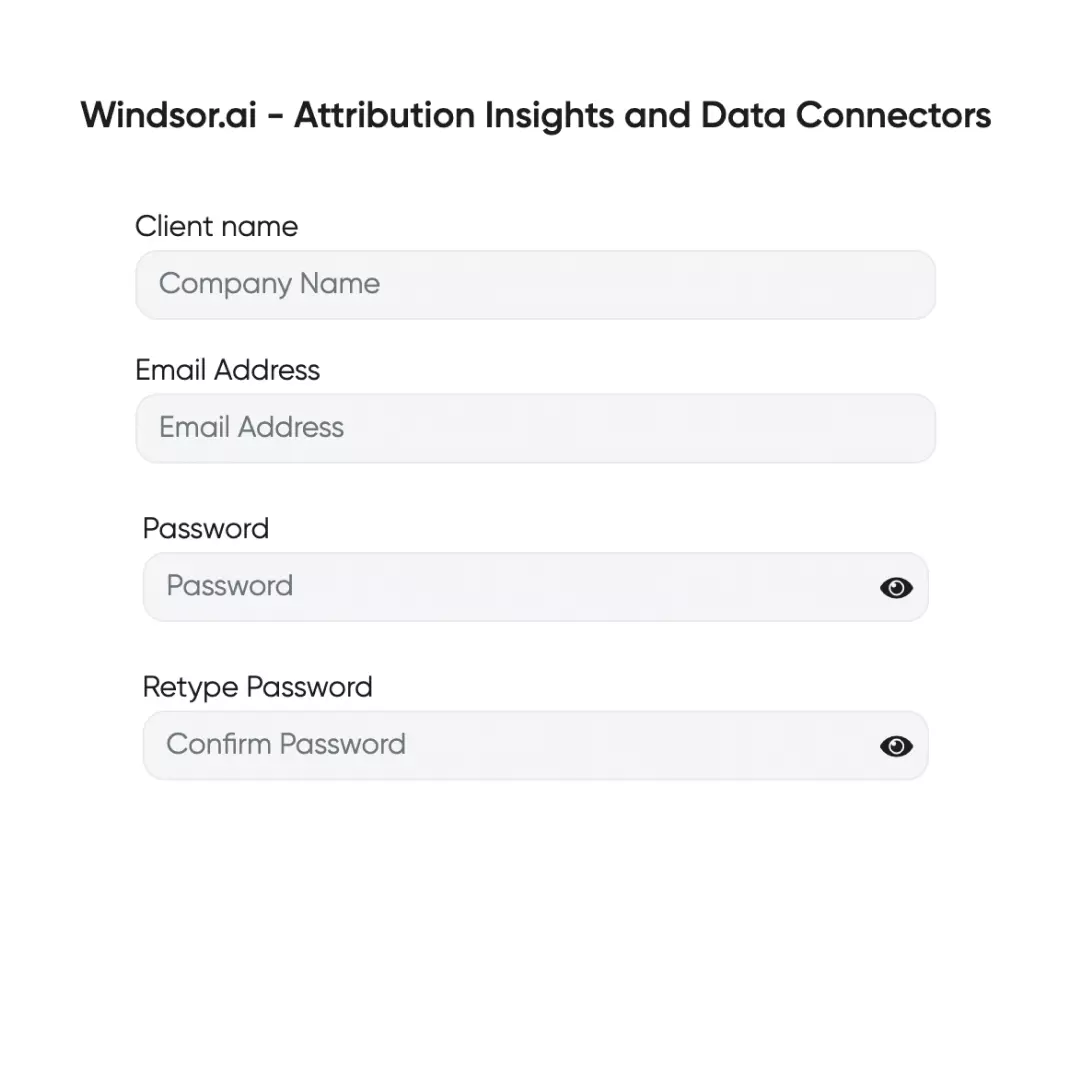
Register and log in to Windsor.ai
Create a new Windsor.ai account or log in if you already have one.
Select your data source
Choose TikTok Ads as your data source and grant access to Windsor.ai.

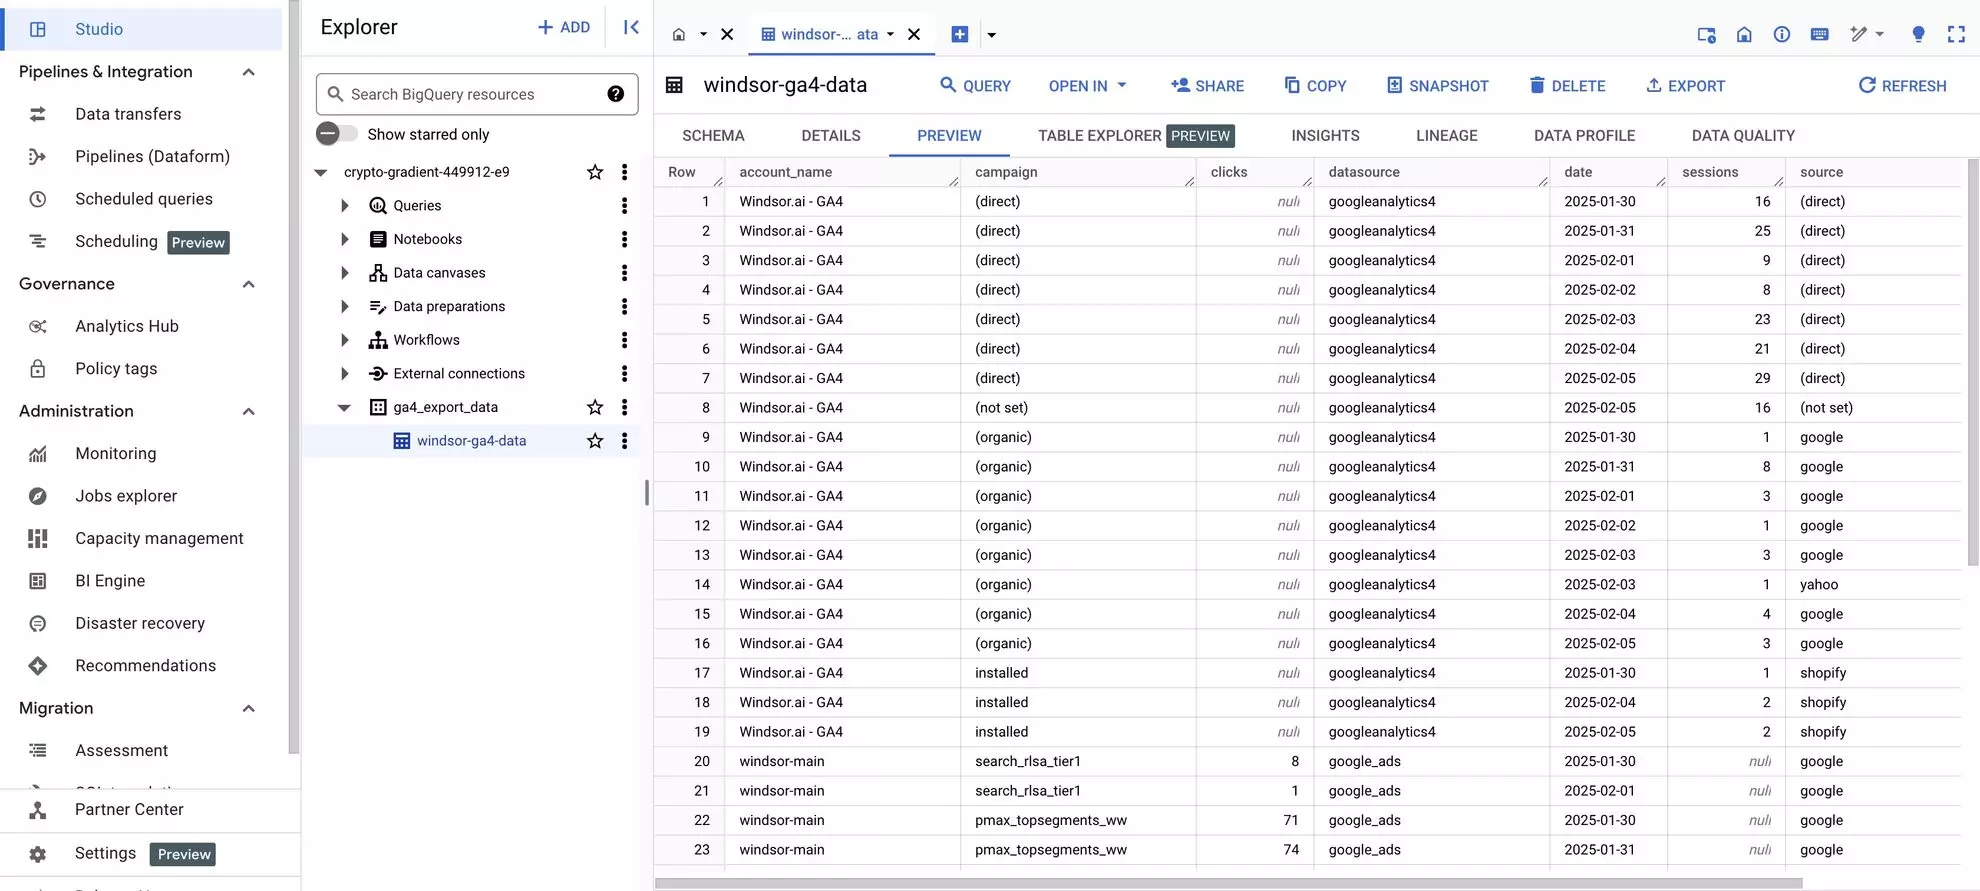
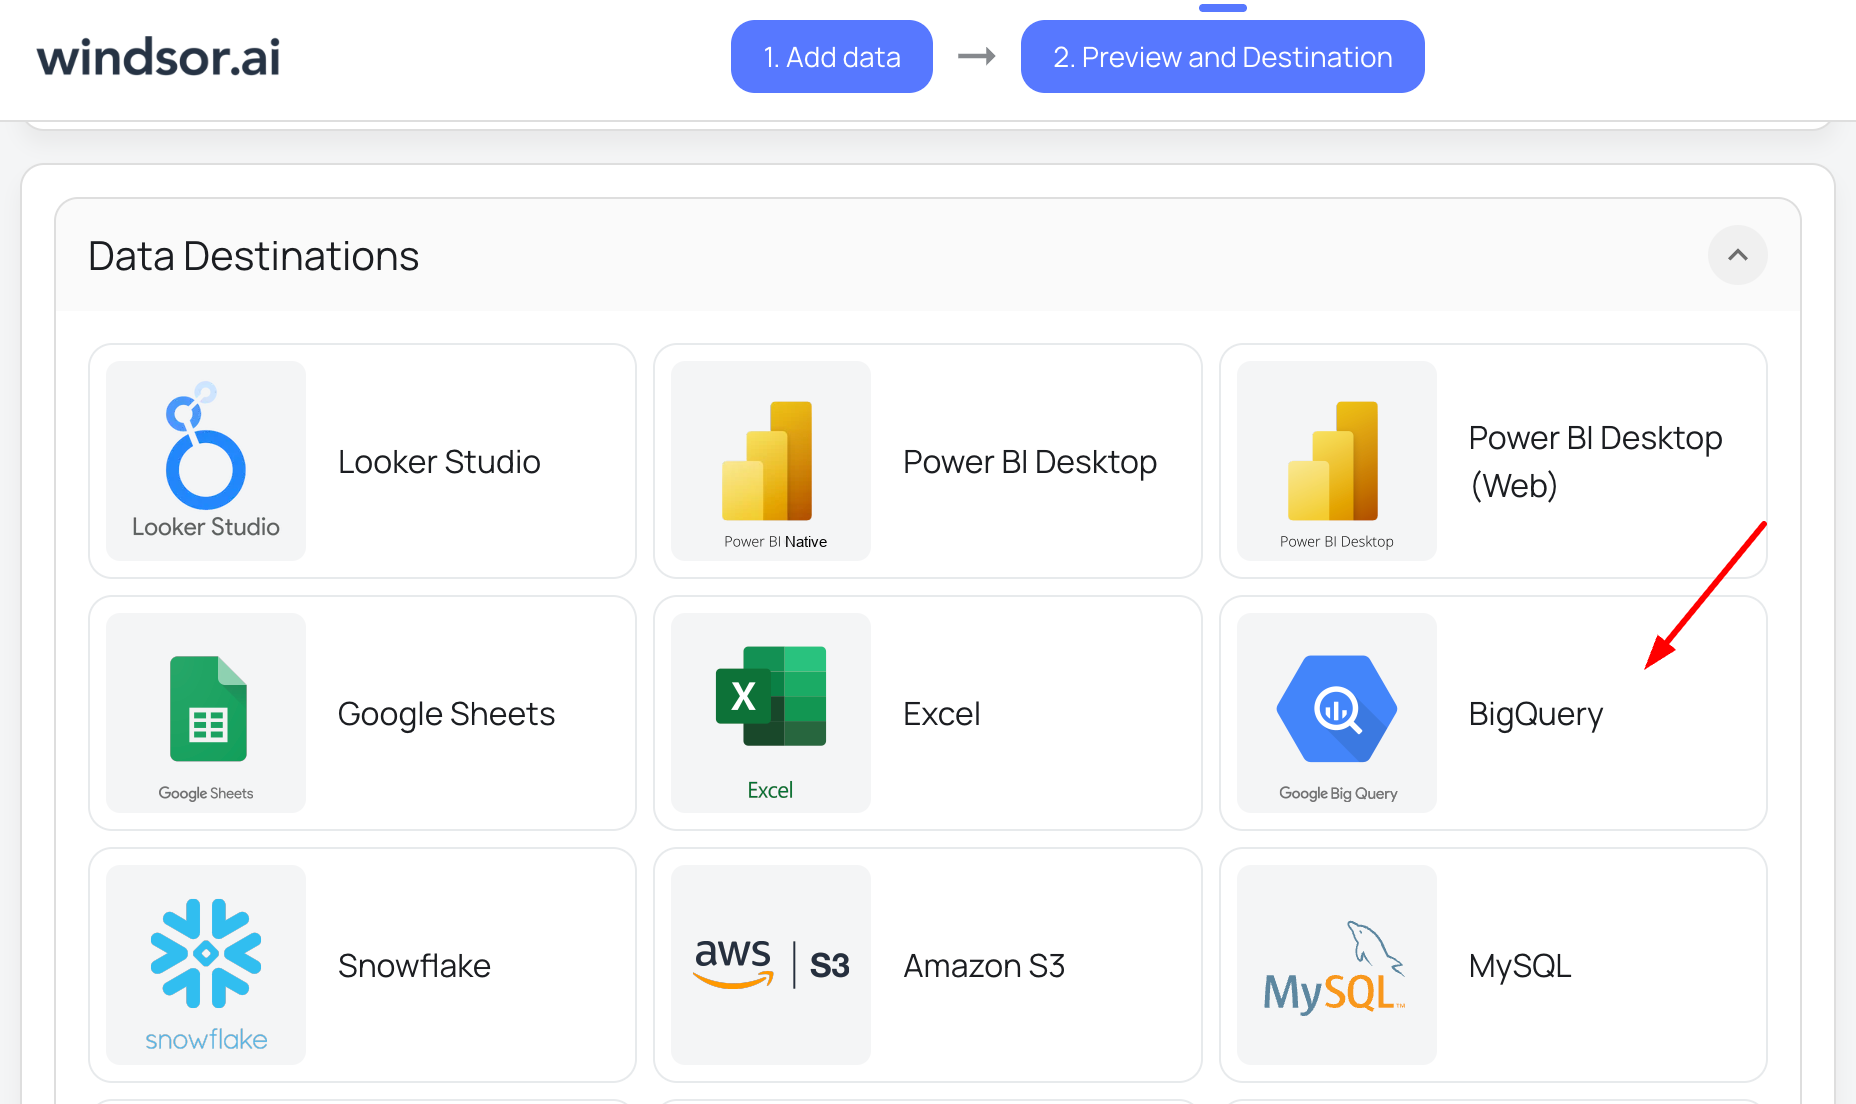
Select your destination
Set BigQuery as the destination for your data.
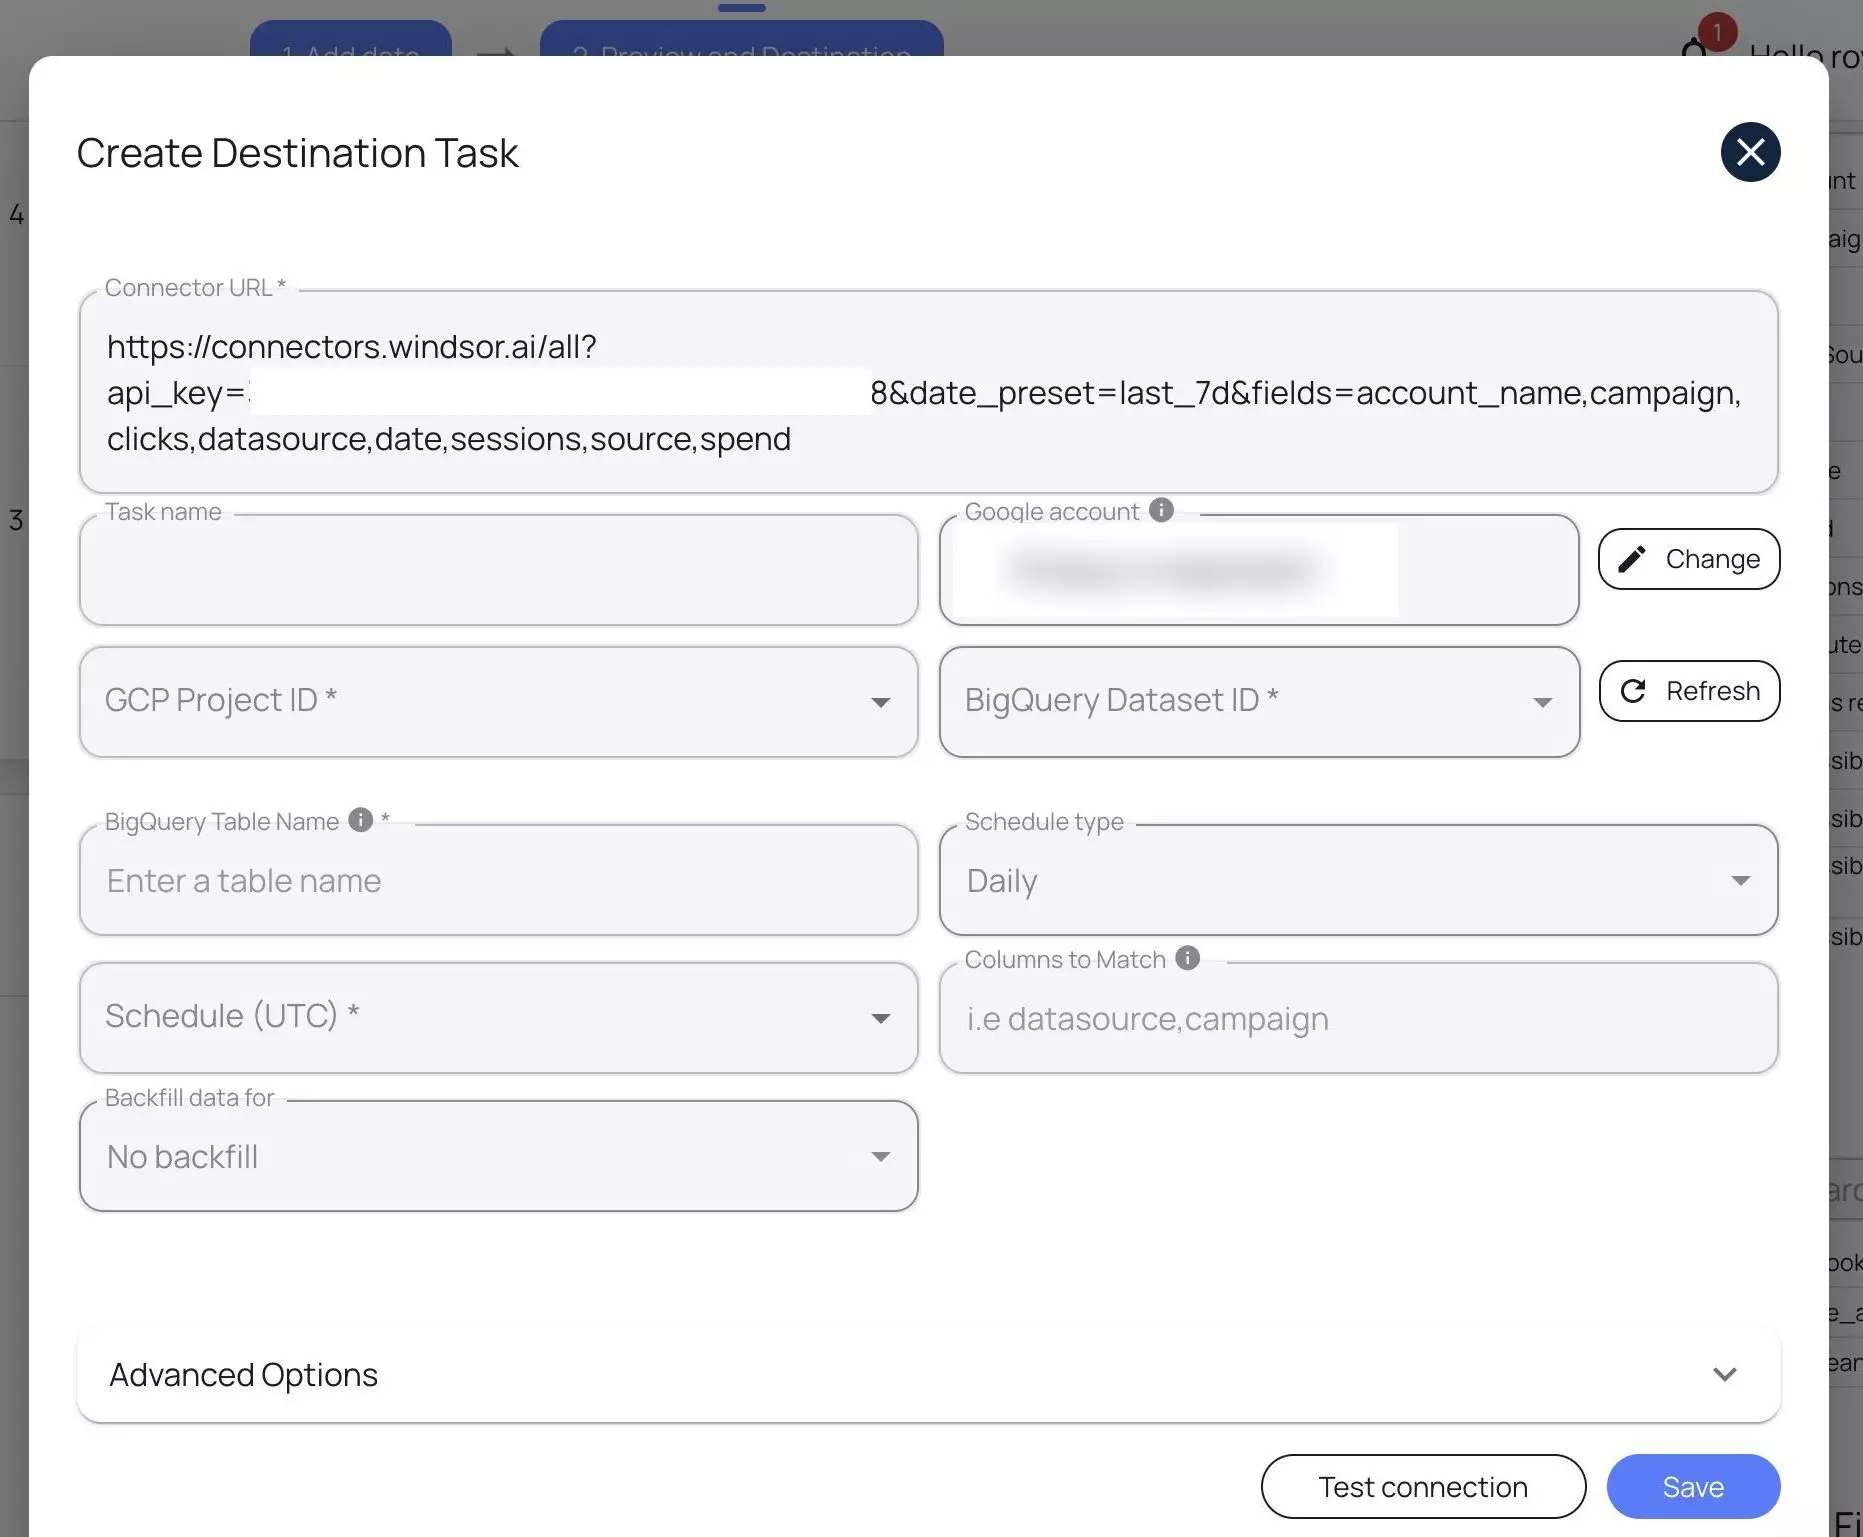
Create a destination task
Click on the “Add Destination Task” button, authorize your Google account, and fill out the required fields along with the advanced settings (optional). Save and run the task.
FAQs
What is BigQuery?
BigQuery is a fully managed, serverless data warehouse developed by Google, designed to handle large-scale data analytics and storage. It allows businesses to store, query, and analyze vast amounts of data quickly and efficiently, leveraging powerful machine learning and business intelligence tools. BigQuery integrates seamlessly with other Google Cloud services such as Google Analytics, Google Docs, and Looker Studio, enabling comprehensive data analysis and reporting. Additionally, it offers robust security features, including data encryption and access control, ensuring the privacy and integrity of your data.
Do you have helpful links to get started with integrating TikTok Ads and BigQuery using Windsor.ai?
Yes, we have helpful resources to help you get started. You can explore our official documentation and ready-to-use templates for seamless TikTok Ads to BigQuery integration with Windsor.ai:
How much time do I need to create the TikTok Ads and BigQuery integration?
With Windsor.ai’s easy-to-use, no-code connector, you can integrate TikTok Ads with BigQuery in just a few minutes, making the process quick and effortless for you.
How much does it cost to integrate TikTok Ads into BigQuery with Windsor.ai?
Windsor.ai’s pricing for TikTok Ads to BigQuery data integration can vary depending on your use case and data volume. We offer absolutely transparent, volume-based event pricing plans for diversified business needs and budgets.
What prerequisites do I need to integrate TikTok Ads with BigQuery?
To set up the TikTok Ads to BigQuery connector from Windsor.ai, you need the following prerequisites:
- TikTok for Business account with the necessary permissions
- Google Cloud Platform (GCP) account with BigQuery enabled
- Service account credentials for BigQuery
- Active Windsor.ai account
Tired of manual TikTok Ads data exports? Try Windsor.ai today to automate your reporting

