Destinations
 Data sources
 AI insights
 About us
 Careers
 Security
 Customer reviews
 Contact us
 Affiliate program
 Solution partners
 Template gallery
 Looker Studio templates
 Power BI templates
 Excel templates
 Google Sheets templates
 Tableau templates
 Facebook Ads templates
 Google Ads templates
 Data fields & Metrics
 AI prompt library & Guides
 Product documentation
 API documentation
 Case studies
 Blog
Blog Data models
 Windsor vs Supermetrics
 Windsor vs Funnel.io
 Windsor vs Fivetran
 Windsor vs Rivery
 Windsor vs Portermetrics
 Windsor vs Coupler.io
 Last updated: 31 August 2026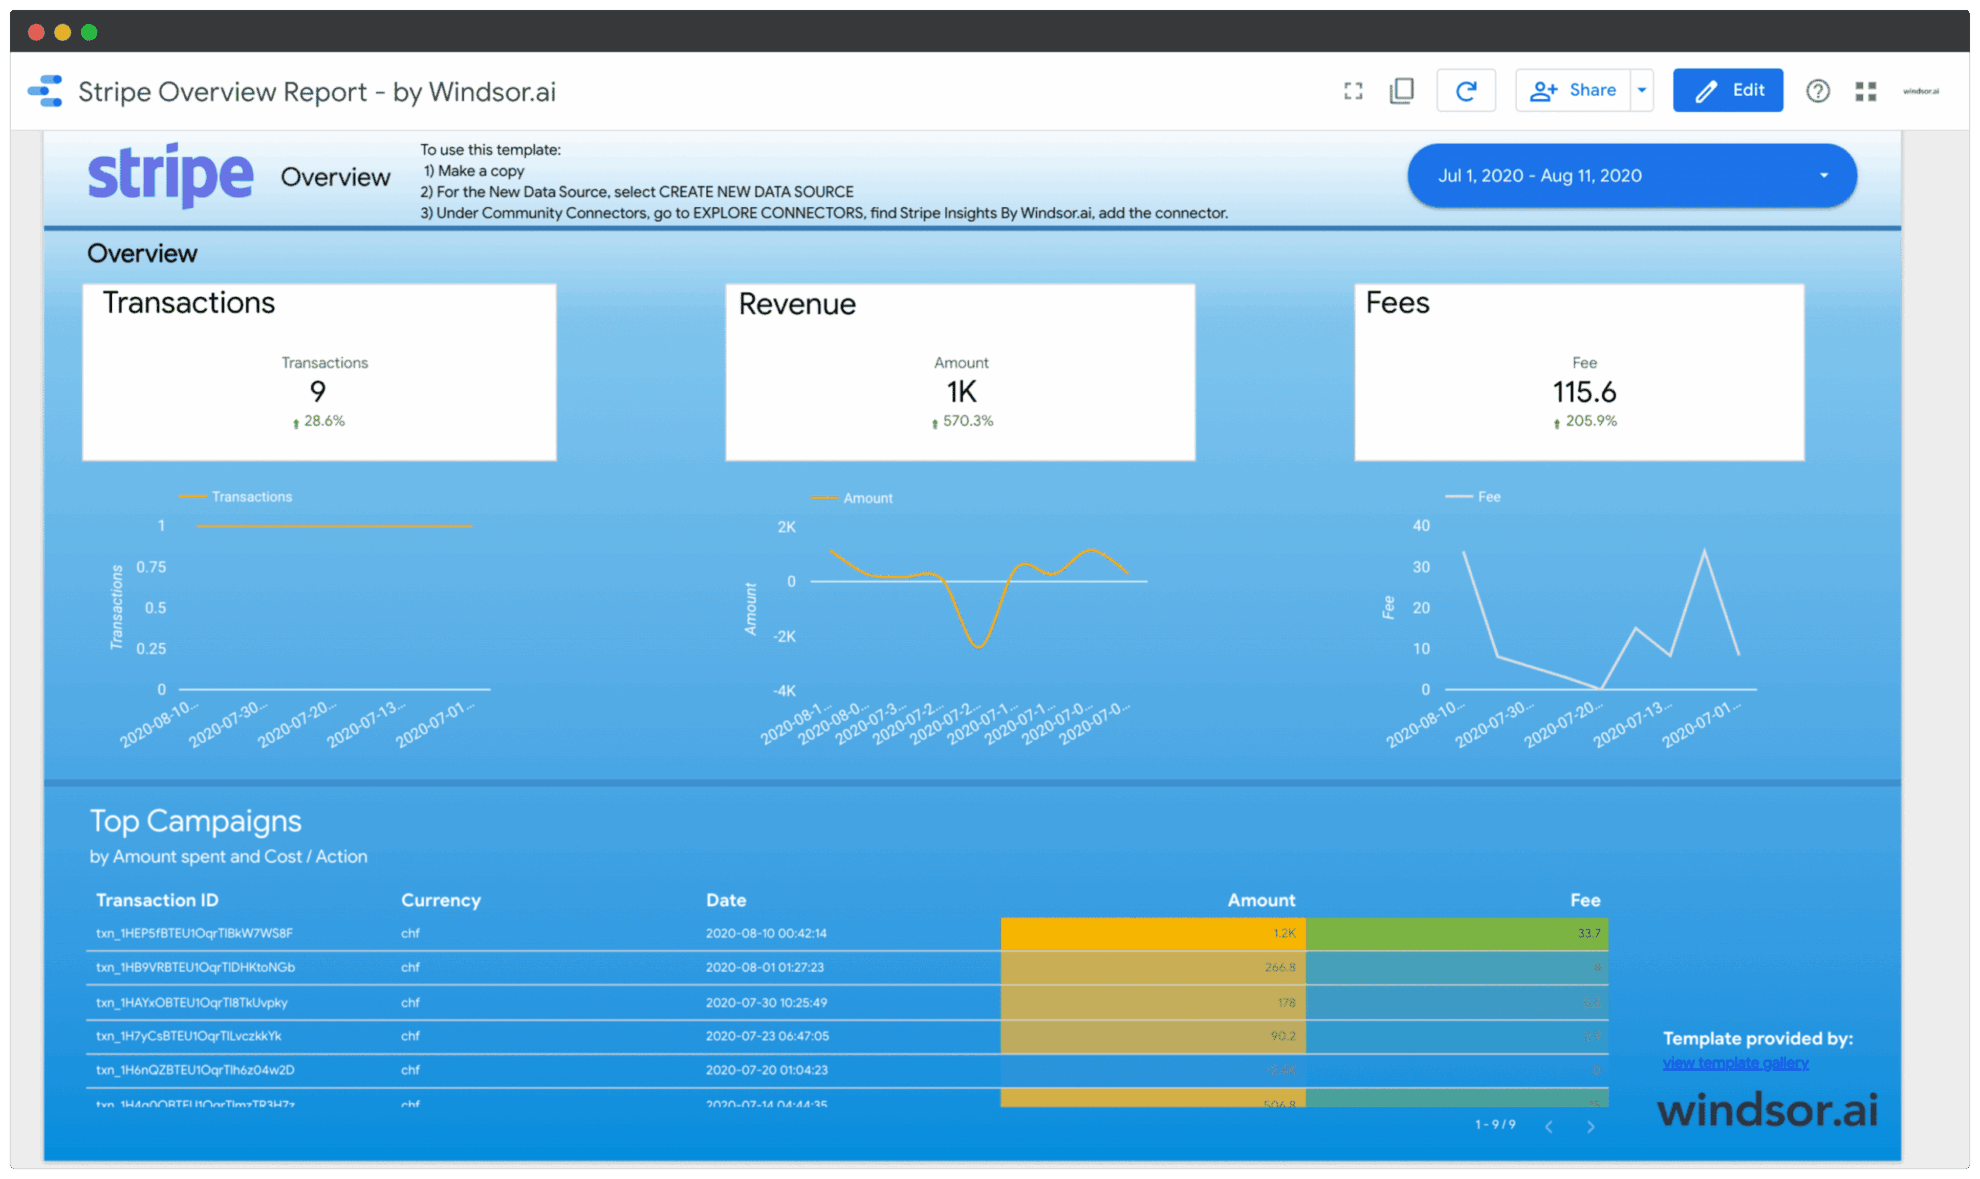




This Stripe Overview Report helps you to visualize your revenue data from Stripe. It directly connects to Stripe via API and loads all your transaction information. By default, the dashboard visualises transaction data such as transaction ID, fees, and dates. If you customize the dashboard you can start using the following dimensions:
- Transaction ID
- Transaction Description
- Transaction Status
- Customer Email
- Transaction Date and Time
- Transaction Fee
- Transaction Amount
To get started with the setup please follow the steps below. You can expect the whole process to take less than 5 minutes. It’s important that you follow the steps in the right sequence to make sure that you don’t waste any of your time. Before you start it is important that you have Stripe access and user rights to issue an API token to access the information in your Stripe account.
This dashboard connects to the following data source
- Stripe
To start using it
- Configure the Looker Studio Connector: Stripe Insights
- Create an API key in Stripe. Paste it into the API key field. Click Add
- Head to 2. Select Destination and click Finish
- Back in Looker Studio click on CONNECT, now click on CREATE REPORT
- Now your report is set up
Interested in getting other channels connected please check out our Marketing Template Gallery.