Introduction to Power BI Amazon Template
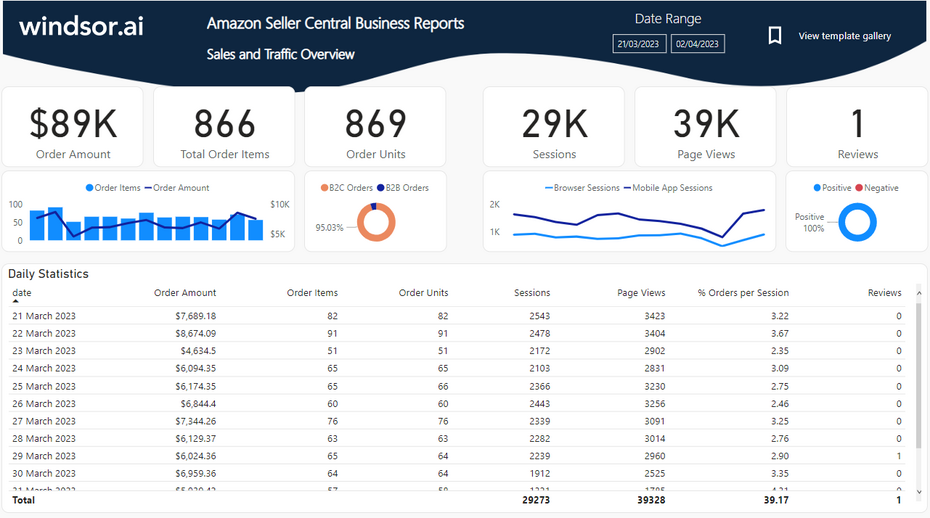
With our Power BI Amazon Overview Report template you can visualize your Amazon Seller Central / Amazon MWS data in Power BI. You only need to connect your data to Windsor.ai and enter your API Key given in the process of registration. You’ll have access to your Amazon MWS data and the whole process should not take you more than 5 minutes.

Try Windsor.ai today
Access all your data from your favorite sources in one place.
Get started for free with a 30 - day trial.
As a prerequisite to getting started, you’ll need access to Amazon MWS. Please make sure that you have the necessary user rights.
The template is available both as
Power BI Web Template
- Connect your Amazon Seller Central / MWS Data to Windsor.ai
Register for free or login if you already have an account.
- Choose Amazon Seller Central from the left-side menu, click on “Grant Amazon Seller Central Access” then follow the steps in the pop-up to sign-in and grant the required permissions.
- Select at least one Amazon Seller Central account from the drop-down.
- Click on Preview and Destination, choose Power BI Web, then copy your API Key.
- Install the Power BI Web App
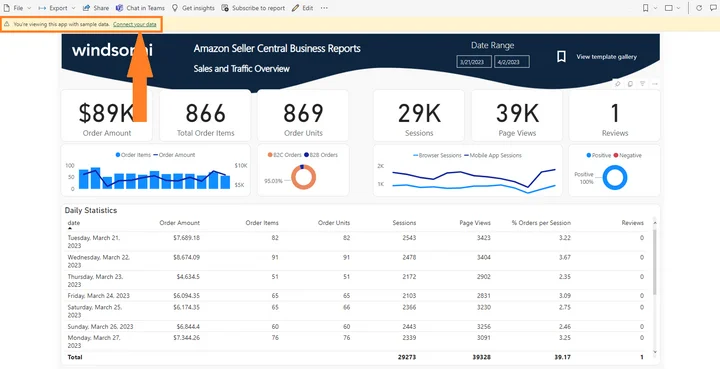
- Click on Connect in the Connect your data section

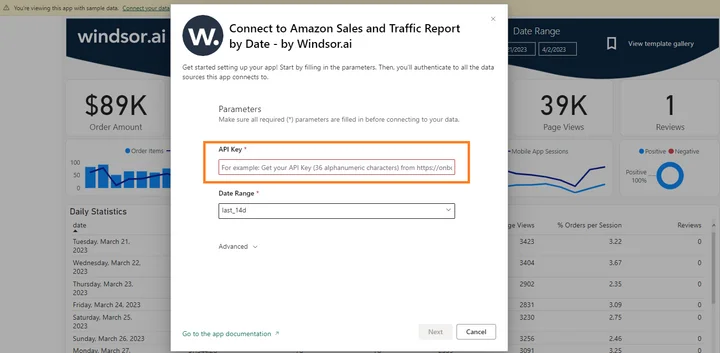
- Enter your API Key from Step 4.

- On the next screen click on Sign In
- Your data should be loading now. Depending on your data size this may take a minute or two.
Power BI Desktop
- Connect your Amazon Seller Central / MWS Data to Windsor.ai
Register for free or login if you already have an account.
- Choose Amazon Seller Central from the left-side menu, click on “Grant Amazon Seller Central Access” then follow the steps in the pop-up to sign-in and grant the required permissions.
- Select at least one Amazon Seller Central account from the drop-down.
- Click on Preview and Destination, choose Power BI Web, then copy your API Key.
- Download the Desktop Template
Download Power BI Desktop Template: Amazon Sales & Traffic Report
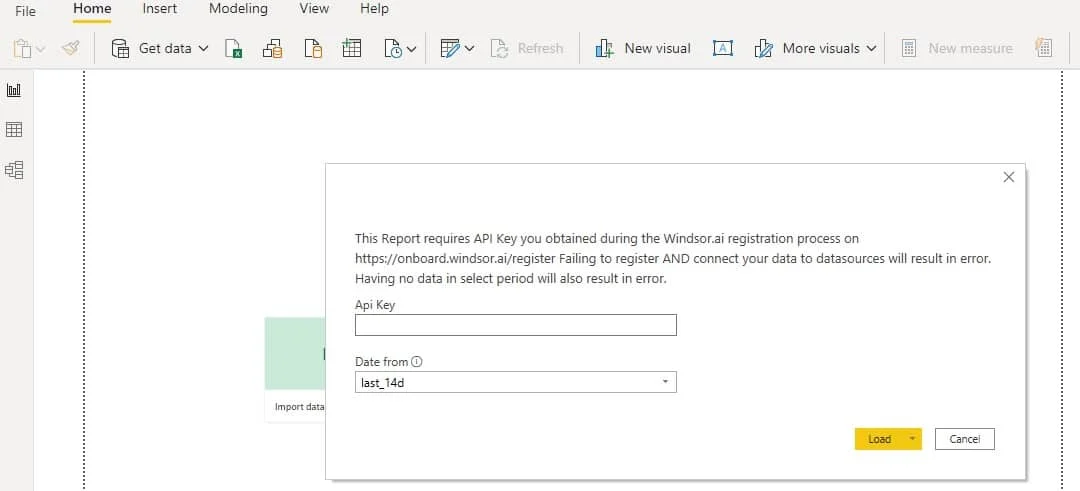
- When opening the template, on the start screen, paste your API Key from step 4:

Power BI Amazon Sales & Traffic Report Template: metrics and dimensions
Below are the predefined metrics and dimensions available in the template. However, you can any other field you need in the connection string.
Dimensions:
- Date
- Customer Type (B2B/B2C)
- Device Category (Mobile App/Browser)
- Source
Metrics:
- Order Amount
- Order Items
- Order Units
- Average Amount per Item
- Average Selling Price
- Shipped Orders
- Units Refunded
- Refund Rate
- % Sessions with Orders
- Sessions
- Page Views
- Reviews
The Power BI Amazon dashboard template can be customized with > 500 different dimensions, breakdowns and metrics. Head here to see a complete list: available metrics and dimensions.
It queries the data through our connector and makes it available in real-time.
You might also be interested in…


