 AI insights
 About us
 Careers
 Security
 Customer reviews
 Contact us
 Affiliate program
 Solution partners
 Looker Studio templates
 Tableau templates
 Facebook Ads templates
 Google Ads templates
 Data fields & Metrics
 AI prompt library & Guides
 Product documentation
 API documentation
 Case studies
 Blog
Blog Data models
 Windsor vs Supermetrics
 Windsor vs Fivetran
 Windsor vs Portermetrics
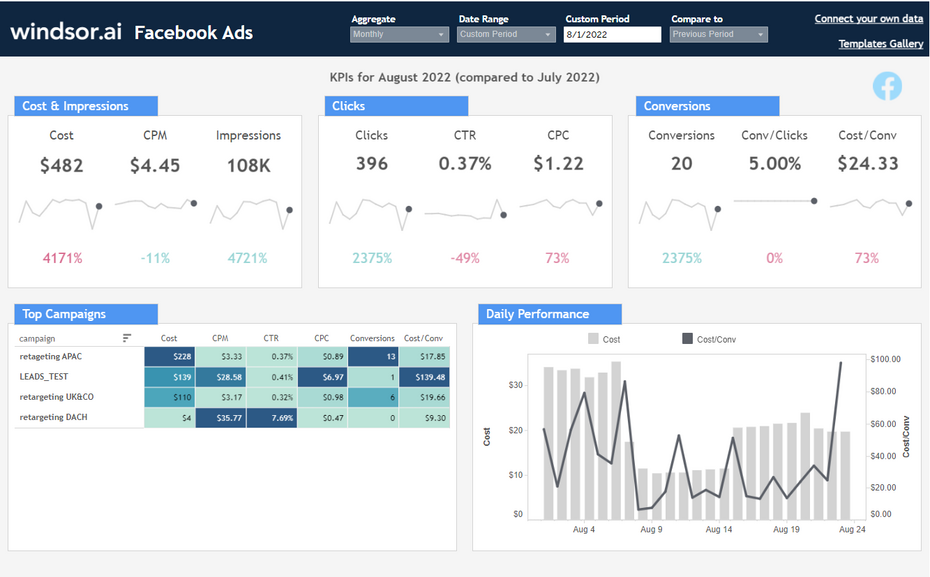
Running a Facebook Ads campaign is pretty easy, but analyzing the data from your campaigns and understanding it is much more difficult. There are so many metrics there, there are so many conclusions you could draw from a FB campaign, how can you be certain that you draw the right ones and scale up your FB marketing so that you get lower CPAs or more customers in the future?
Analyzing Facebook Ads Data – Why Tableau?!
Perhaps the answer is to export your Facebook Ads data to a visualization software that will help you understand and read your marketing data and make the most of it. And one such very popular software is Tableau. We are going to show you how to analyze Facebook Ads data into Tableau and specifically how to use the Tableau Facebook Ads Report Dashboard Template that’s available in Windsor.ai.
Pulling Data from Facebook Ads Manager
Facebook Ads campaigns are run through Facebook Ads Manager and the reports from each campaign can be pulled from there. The data itself can look pretty messy and there are dozens of available metrics. Or to be more precise, in addition to the Ad name, Adset name, Ad ID, CPC (cost per click), CPM (cost per mile) etc, Facebook Ads also offers more than 350 other ads metrics and ad terms.
It’s easy to get lost in the data
Now, different metrics are important in different kinds of campaigns and it also depends on the industry, what is considered a conversion in a given context and a few other factors. In other words, it is fairly easy to get lost in all the data, especially when you look at how it is presented in Facebook Manager. Even if you download a report as a .csv file, it wouldn’t be too easy. You might be able to find the numbers if you know what you’re looking for, but it would be pretty difficult to discover patterns, draw conclusions and improve your next campaigns on the basis of that data.
How Tableau Facebook Ads Report Dashboard Template Works
One of the options is using the Tableau Facebook Ads report dashboard template. How to start using it is explained below, here we will say a few more words about Tableau. We’re talking about a data visualization tool, but while there are many such tools, it is important to note that this one puts an emphasis on BI (business intelligence), so in essence, will enable you to look at your data in a way that helps you understand how you can have better and more successful campaigns in the future.
So, the Tableau Facebook Ads Report template lets you visualize your Facebook Ads using Tableau in a few clicks. Dimensions and metrics visualized in this report are
- Adset name,
- CPC,
- CTR,
- CPM,
- Campaign,
- Clicks,
- Spend,
- Impressions
There is a list of close to 300 metrics and dimensions available once you start customizing the Tableau Facebook Ads Report. To find the full list go to Available metrics and dimensions.
It queries the data through our connector and makes it available in real-time. Follow the steps outlined below to get your data connection.
To start using it
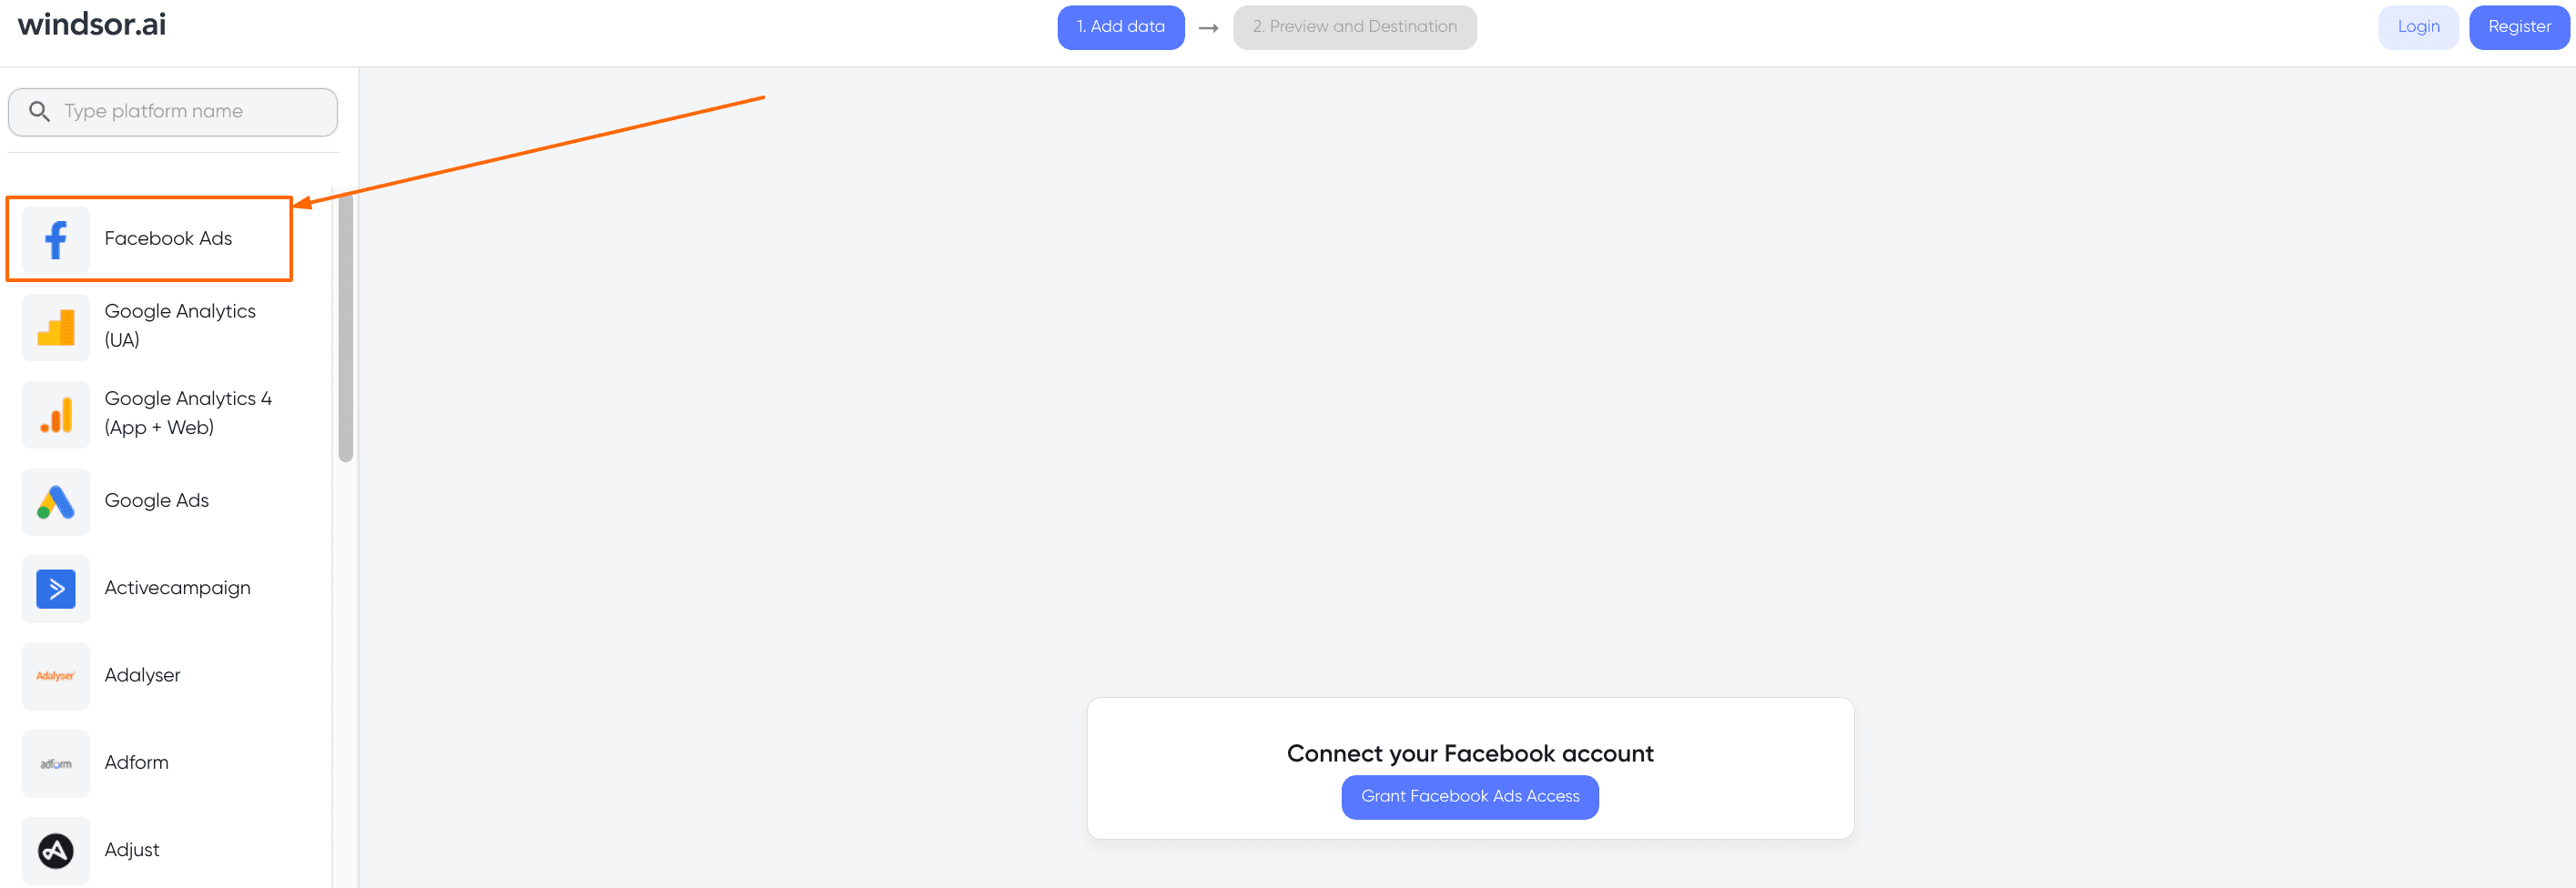
- Connect your data sign up for a free trial, or log into your existing account, and connect data sources.

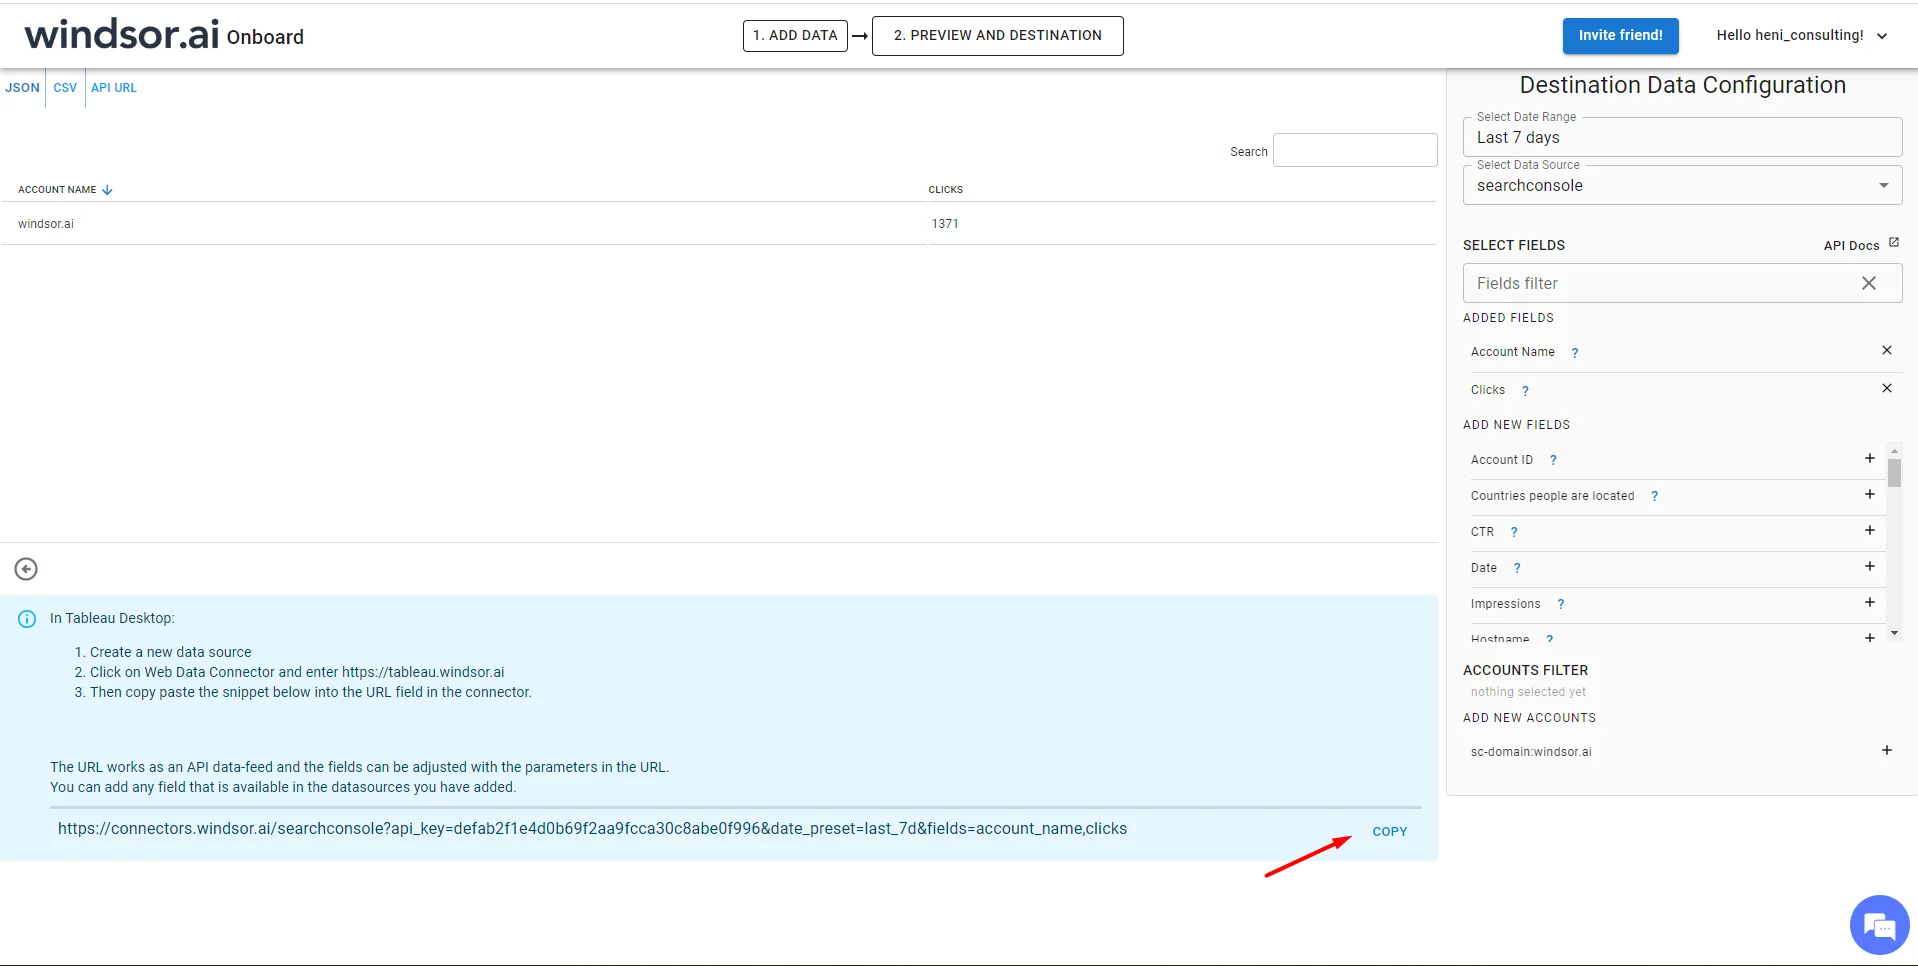
Remember to copy your API Key as show in the image above – This template will show data only if your Facebook account is connected
- Get the Template here
- Edit the connection in your dashboard copy to fetch your data.
- Copy this URL to Tableau (replace your API Key first)
https://connectors.windsor.ai/facebook?api_key=YOUR-API-KEY&date_preset=last_7d&fields=adset_name,cpc,ctr,cpm,campaign,clicks,spend,impressions,date,source
Here is how
PS! If you need other Tableau templates – see here.

Try Windsor.ai today
Access all your data from your favorite sources in one place.
Get started for free with a 30 - day trial.