 AI insights
 About us
 Careers
 Security
 Customer reviews
 Contact us
 Affiliate program
 Solution partners
 Looker Studio templates
 Tableau templates
 Facebook Ads templates
 Google Ads templates
 Data fields & Metrics
 AI prompt library & Guides
 Product documentation
 API documentation
 Case studies
 Blog
Blog Data models
 Windsor vs Supermetrics
 Windsor vs Fivetran
 Windsor vs Portermetrics
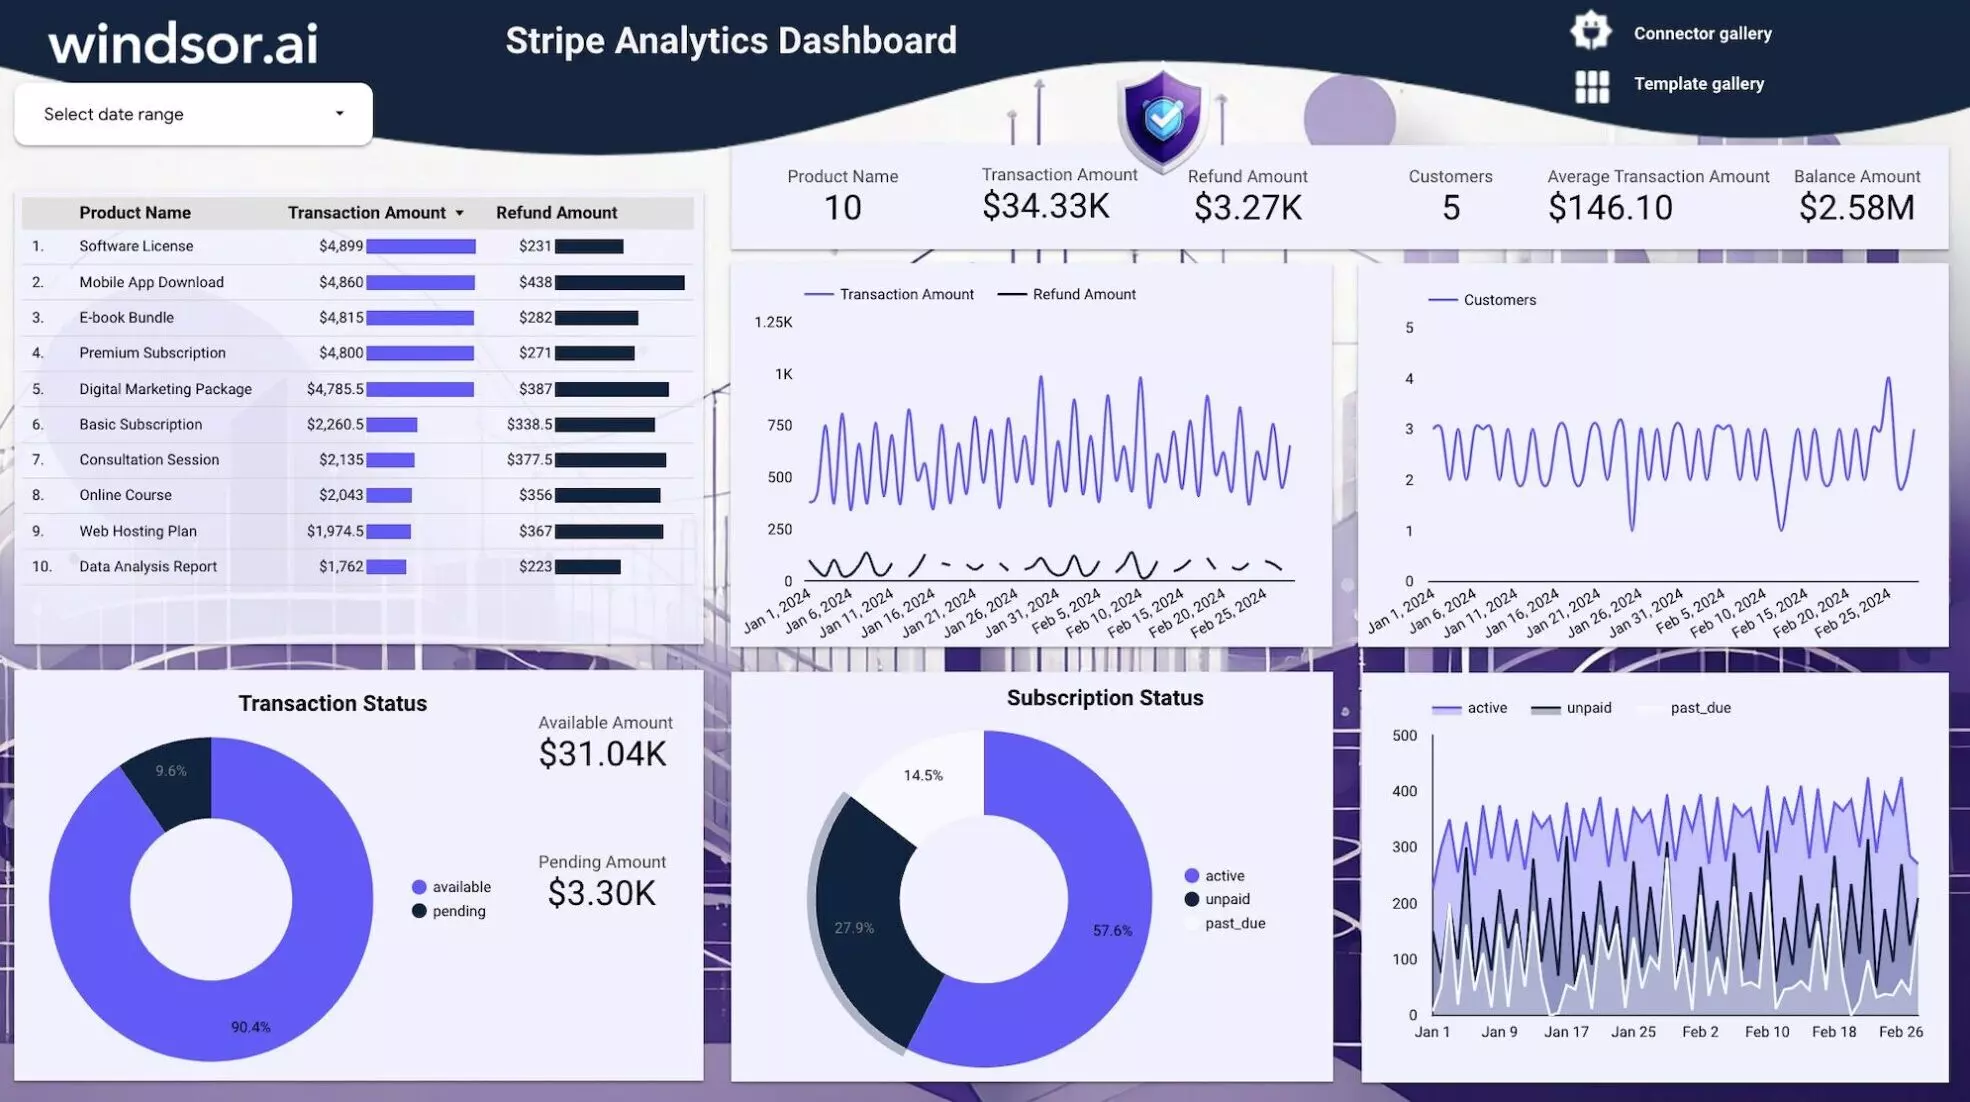
Access free Stripe Analytics dashboard template on Looker Studio through Windsor.ai. Enrich your marketing repo`rts and make smarter decisions that continuously enhance online payments. The templates are easy to use and can be customized to meet your business’s specific needs. You can choose the metrics that matter to you most to track goals better. Generating reports with the Stripe Analytics dashboard is faster, and you save more time to focus on analytics.
What is Stripe Analytics on Looker Studio Reporting Dashboard?
Stripe Analytics on the Looker Studio reporting dashboard is a tool that visualizes Stripe-related data. It helps you organize raw data into useful information, so you can understand the types of customers your business deals with, revenue generated, fraud risk, preferred payment methods, churn rate, transaction status, subscriptions, and more.
Stripe Analytics dashboard presents data attractively and in a simple format. It allows you to generate colorful charts, graphs, and tables based on your data, making it easier to understand business performance. You can learn what drives customer purchases, changes in subscription rates, preferred products, payout statuses, and transaction amounts, among other things.
Why Is Stripe Analytics Reporting Important?
Raw data often appears as an overwhelming mix of numbers and text that can be difficult to interpret at first glance. Reporting on Stripe Analytics data is, therefore, important to make the raw data more sensible.
As a business, making progress is hard if you don’t understand performance in key areas. With reporting, you can easily track how well your payment systems are working, whether a newly implemented payment method is gaining traction, and if there are any common issues clients face. Are you targeting a specific customer segment? Is the transaction volume increasing or decreasing? Why are people asking for refunds? Clear reporting not only answers these critical questions but also enables more strategic and intentional decision-making.
Benefits of Using Stripe Analytics Reporting Dashboards
The importance of using this realtime dashboard on Looker Studio cannot be emphasized enough. It’s a vital tool for your business that can be a game-changer in driving progress and efficiency. Check out the perks below:
Improved financial visibility
Stripe Analytics report templates let you visualize the main transaction data like revenues, refunds, sales, and payouts to help you understand financial performance. Discover the efficiency in cash flow and any bottlenecks that could interfere with operations. Manage your finances better for a healthy business.
Know your customers
Stripe Analytics express dashboard, helps you discover customer behavior and purchase patterns. With insights on what inspires purchases and customer loyalty, it’s possible to improve marketing strategies to appeal to specific demographics for higher conversion rates. You can even retain customers by offering personalized experiences, ultimately leading to business growth.
Boost collaboration
Reports on business performance can reach different department teams and stakeholders at the touch of a button, thanks to the dashboard’s shareable capability. When everyone accesses the same data simultaneously and in real-time, they can discuss key issues together. This improves collaboration and supports more unified cross-functional strategies for smoother business operations.
How to use it
- Configure the Looker Studio Connector: Windsor.ai
- Once you finish installing the connector open the Stripe Analytics Dashboard and make a copy of it (File -> Make a copy)
- Select the newly created data source.
- Now your dashboard is set up
FAQs
What is Stripe Analytics?
Stripe analytics helps turn your ecommerce and payment processing data into useful, actionable information. By highlighting key metrics like customer behavior, revenue growth, transaction volume, sales trends, and subscription rates, the platform helps businesses to assess their performance. The insights gained lead to improved decision-making that drives continuous growth.
What is Stripe Analytics used for?
Stripe analytics is essential for tracking and analyzing data related to customer transactions, payment trends, transaction volume, and more. This makes it easier to identify growth opportunities and optimize financial operations.
How much is Stripe Analytics Dashboard?
Windsor.ai offers the Stripe Analytics dashboard for free.
What is Looker Studio?
Looker Studio is a data analytics and visualization platform by Google that helps businesses tell their data stories. It features several widgets like charts, tables, graphs, and scatter plots for visualization and easy data interpretation. Looker Studio integrates with multiple platforms, allowing users to leverage their data for optimal performance.