 AI insights
 About us
 Careers
 Security
 Customer reviews
 Contact us
 Affiliate program
 Solution partners
 Looker Studio templates
 Tableau templates
 Facebook Ads templates
 Google Ads templates
 Data fields & Metrics
 AI prompt library & Guides
 Product documentation
 API documentation
 Case studies
 Blog
Blog Data models
 Windsor vs Supermetrics
 Windsor vs Fivetran
 Windsor vs Portermetrics
Google Ads Google Sheets dashboard template

Stay on top of your Google Ads performance with this free Google Sheets template: track live KPIs and top campaigns in an auto-updating dashboard.
Connect your account and start reporting in minutes; no scripts or manual exports required.
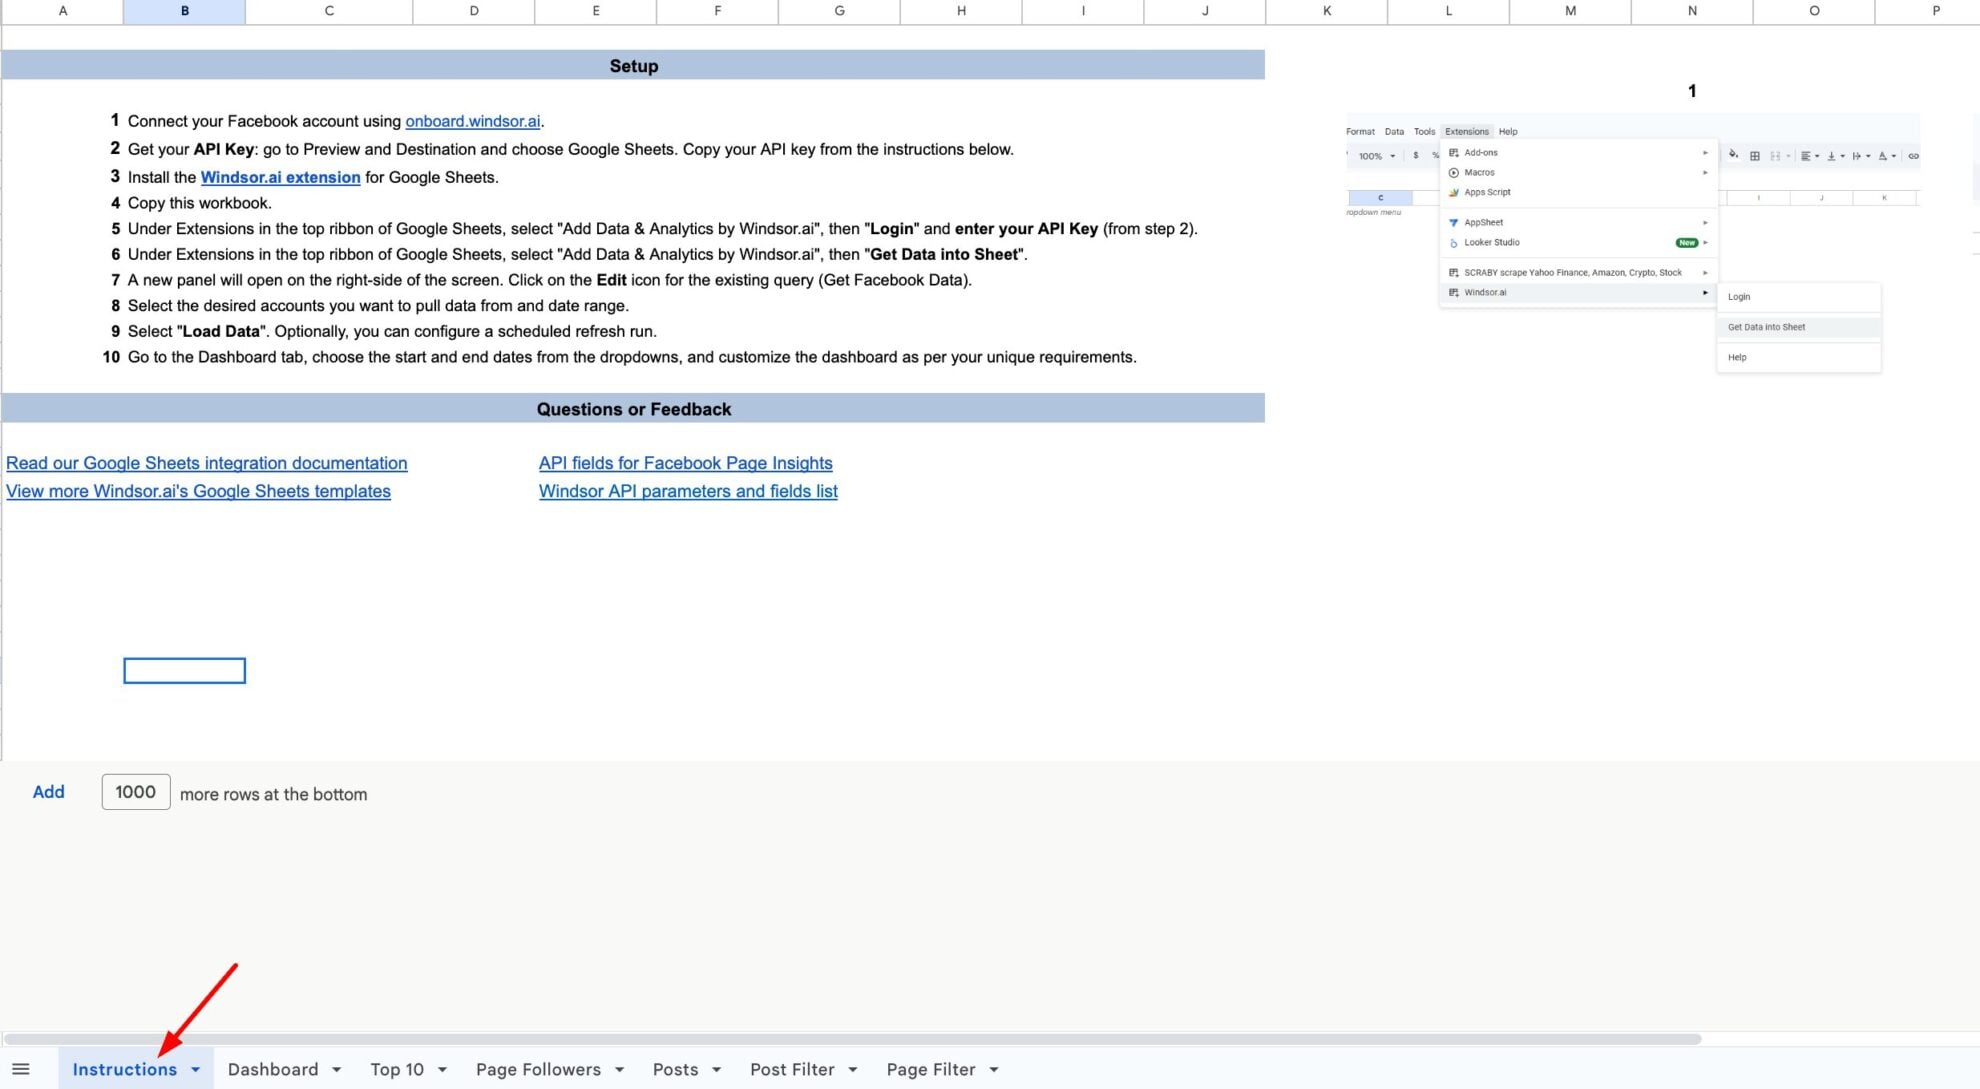
How to use this template: setup instructions
Prerequisites:
- Google Ads account
- Google account with Google Sheets access
- Windsor.ai account
- Windsor.ai extension installed in Google Sheets
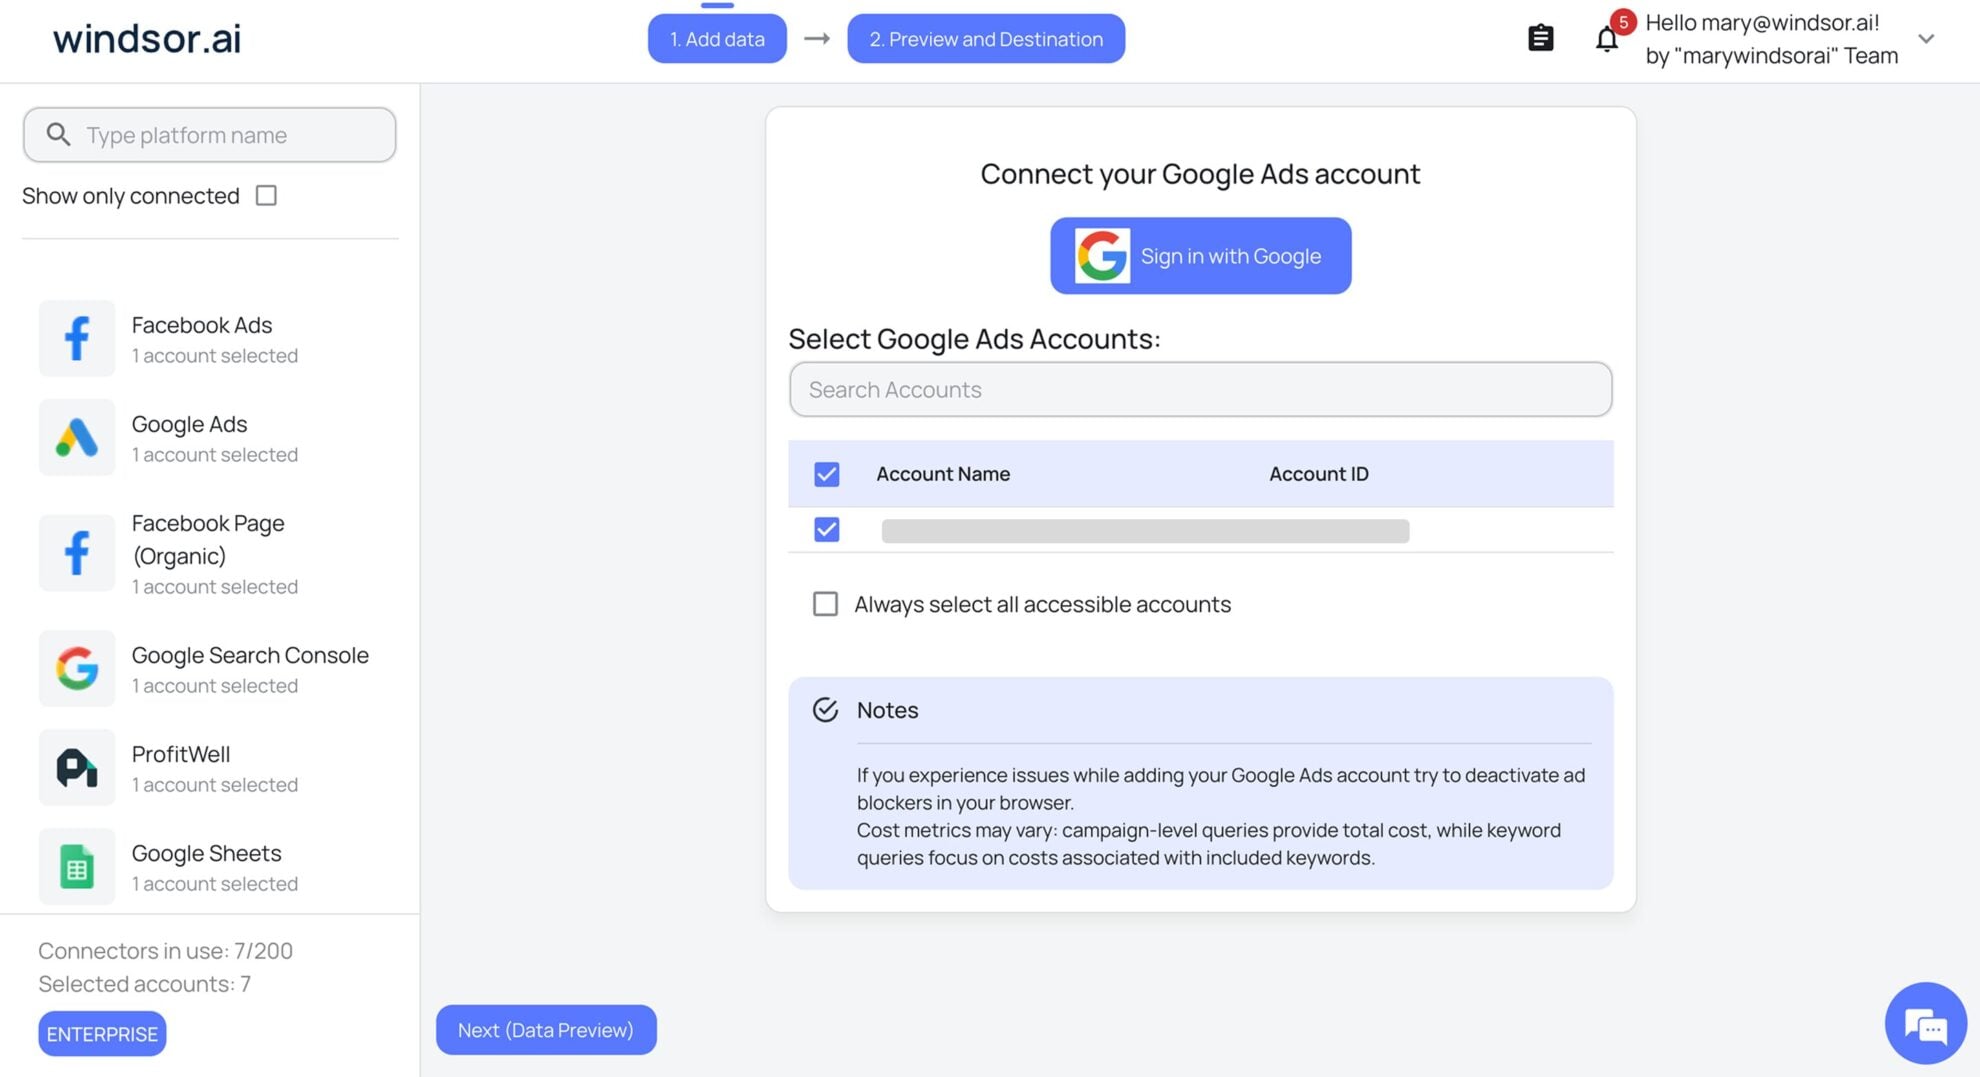
Connect your Google Ads data to Windsor.a
Register or log in to your Windsor.ai account, then connect your Google Ads account. From the list, select at least one Google Ads account from which you want to pull data.
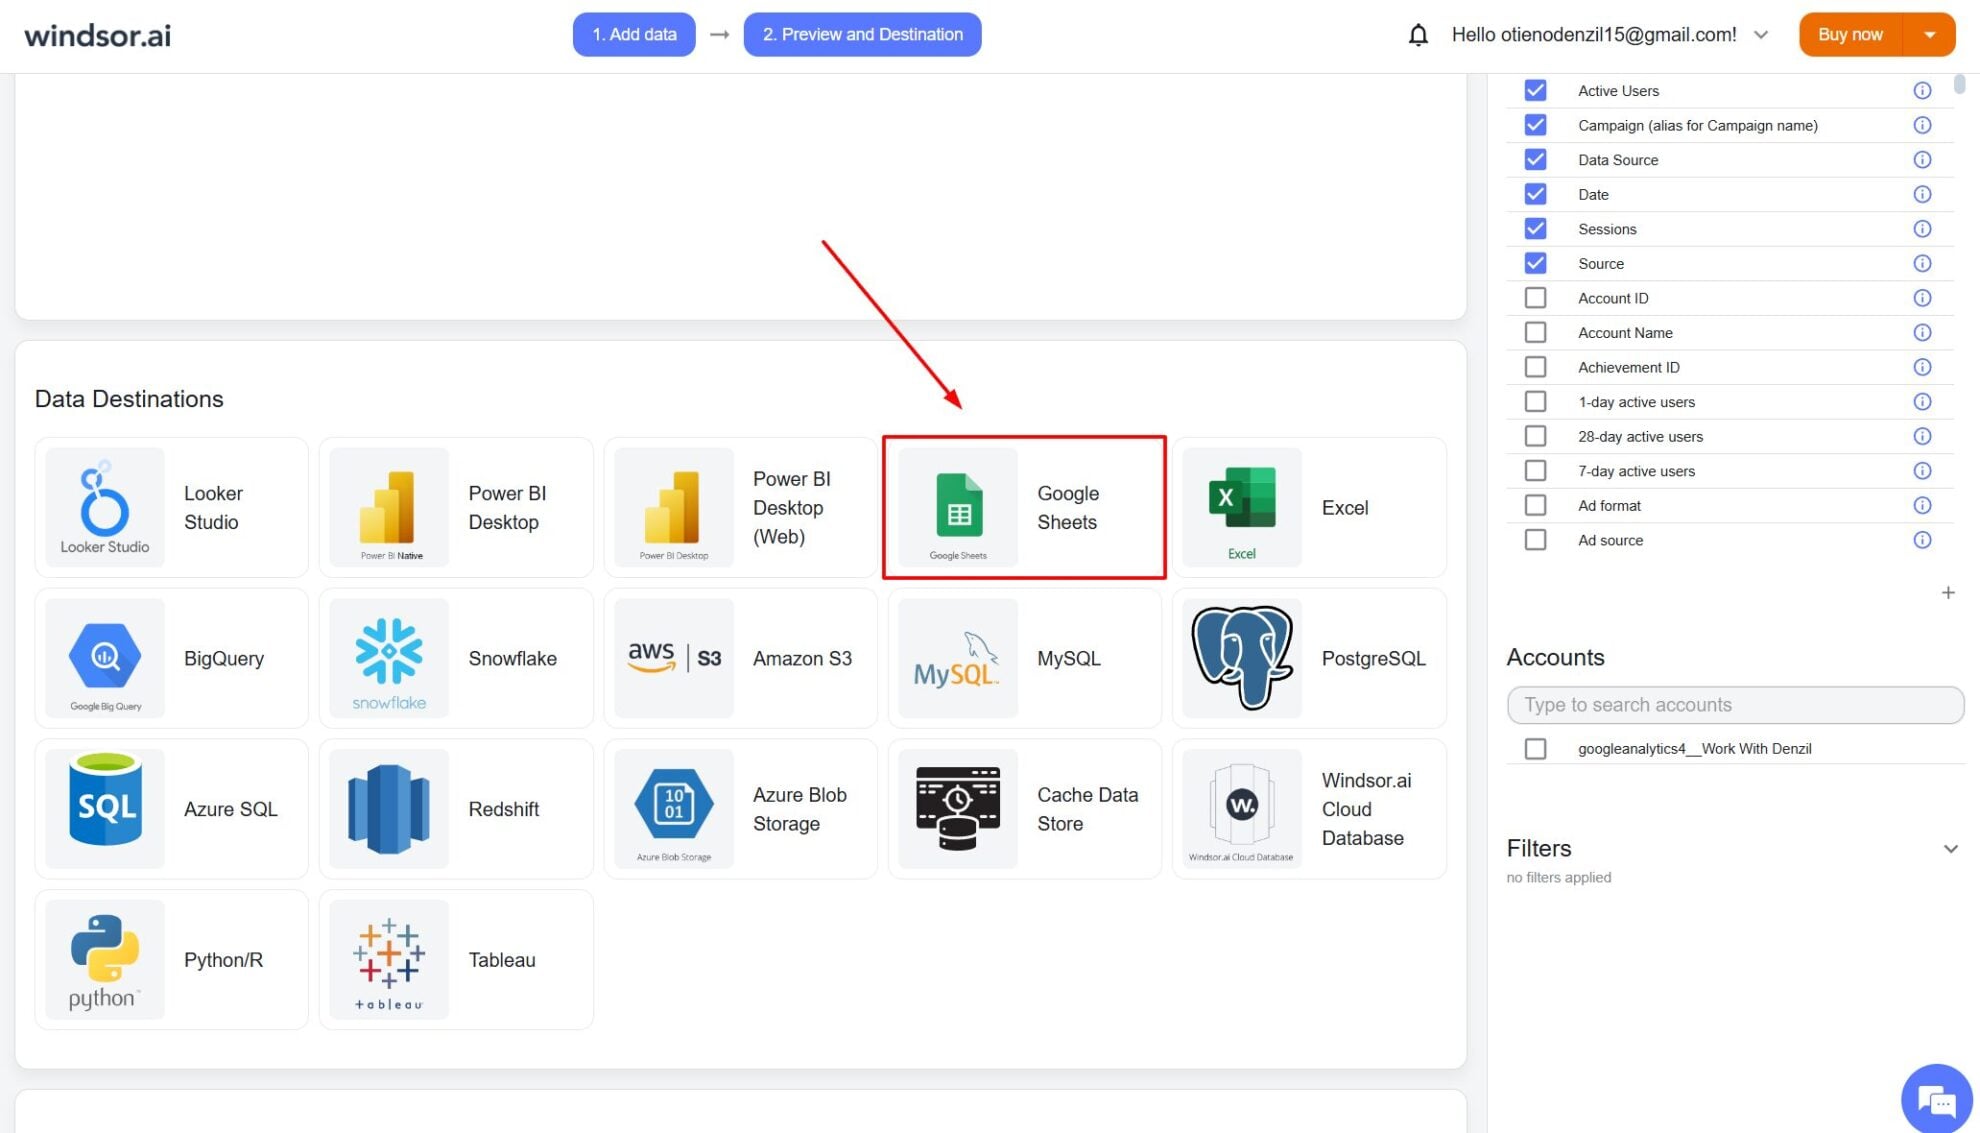
Choose Google Sheets as the destination
Click on Preview and Destination, choose Google Sheets, and copy your API Key from the instructions.
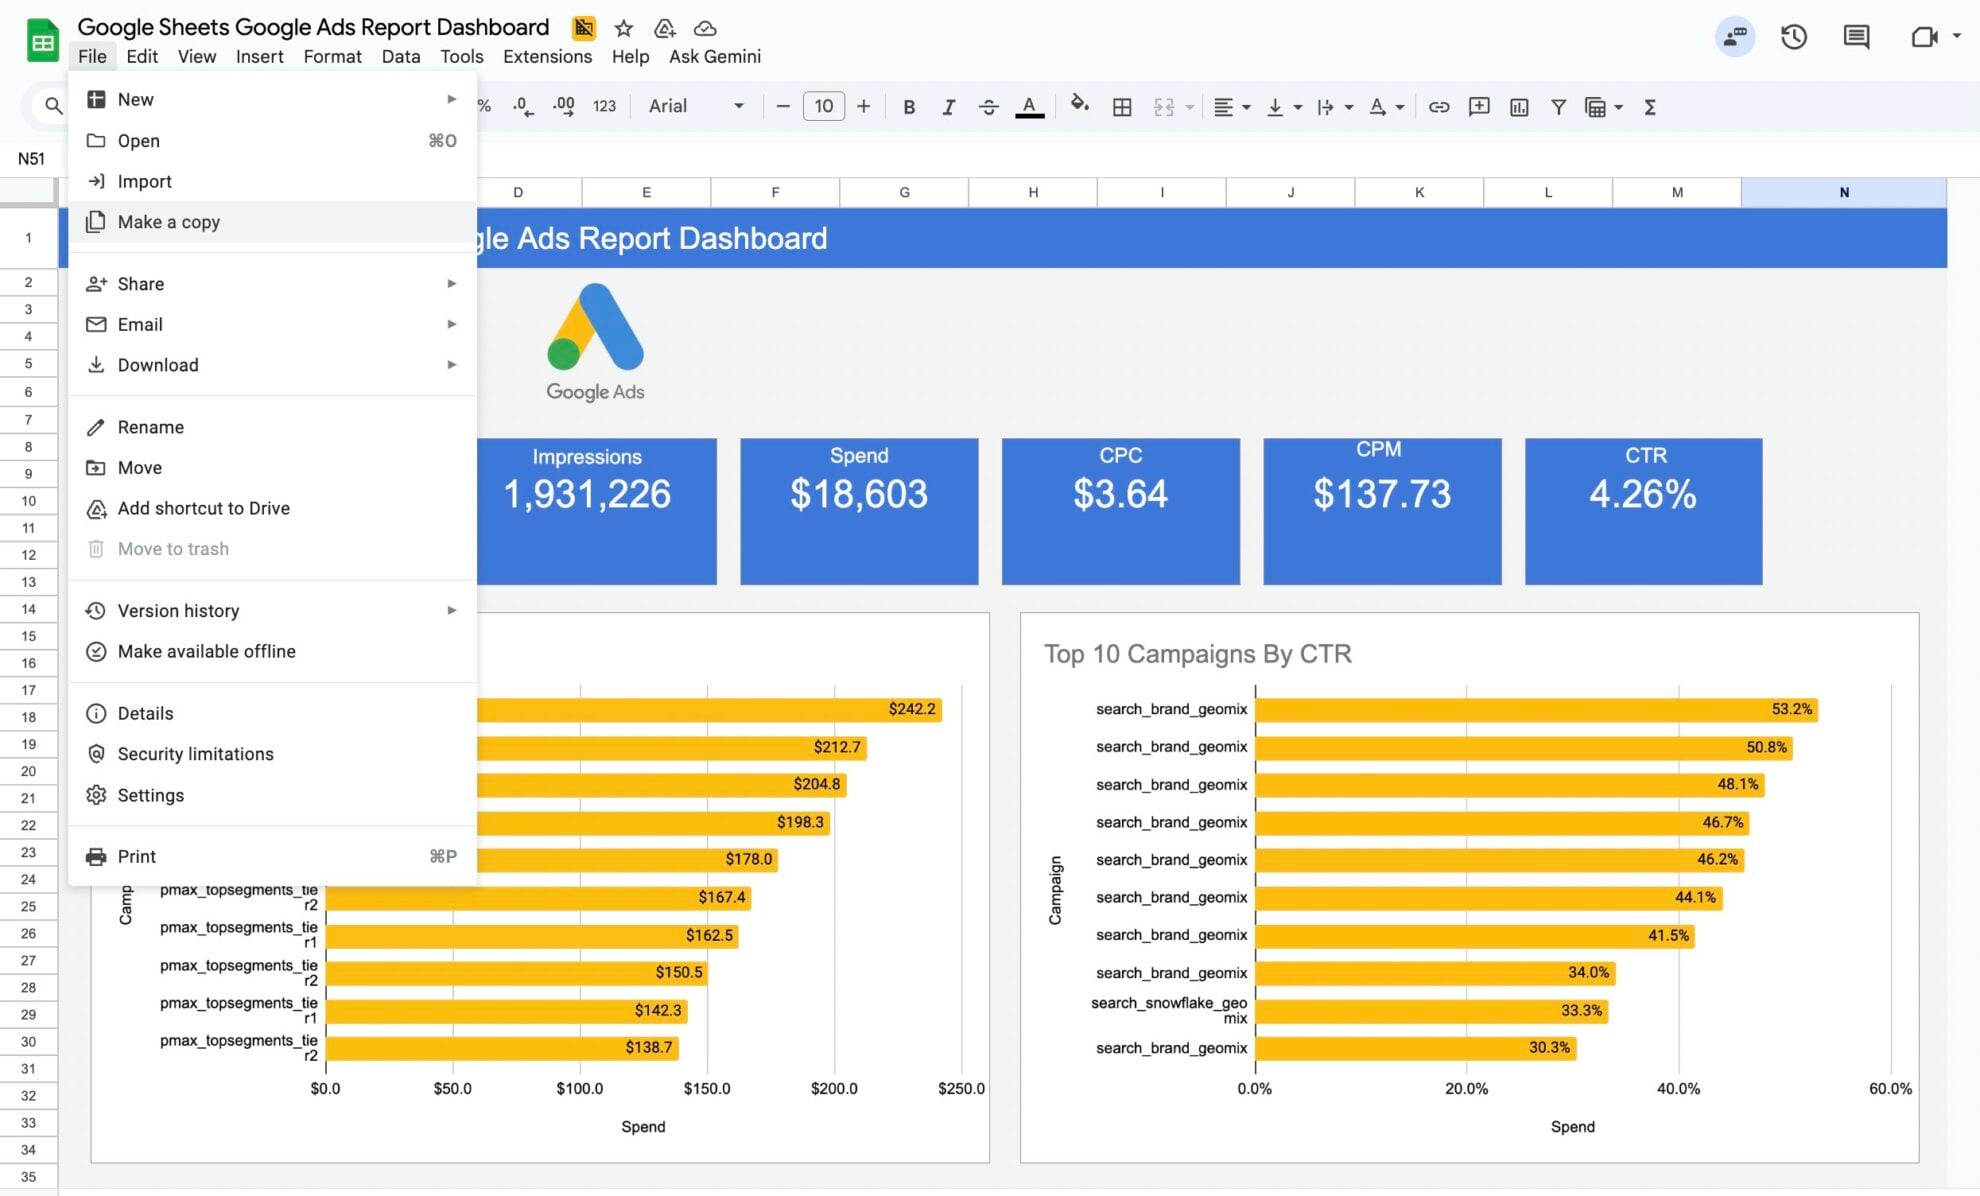
Copy this template
Open the Google Ads Google Sheets Dashboard Template. Make a copy to your own Google Drive so you can edit and customize it.
Sync the data
Follow the in-template instructions to link your live data feed from Windsor.ai to the dashboard. Paste your Windsor.ai API key when prompted to activate the data connection.
Google Sheets Google Ads dashboard template: metrics, dimensions, and breakdowns
This template is built for performance marketers, PPC managers, and agencies who need a fast, shareable view of Google Ads results.
All data is pulled automatically via Windsor.ai’s connector and updated on your preferred schedule in Google Sheets.
Metrics:
- Impressions
- Clicks
- Spend
- Average CPC
- Average CTR
- Average CPM
Dimensions & filters:
- Date range
- Campaign (top lists by campaign)
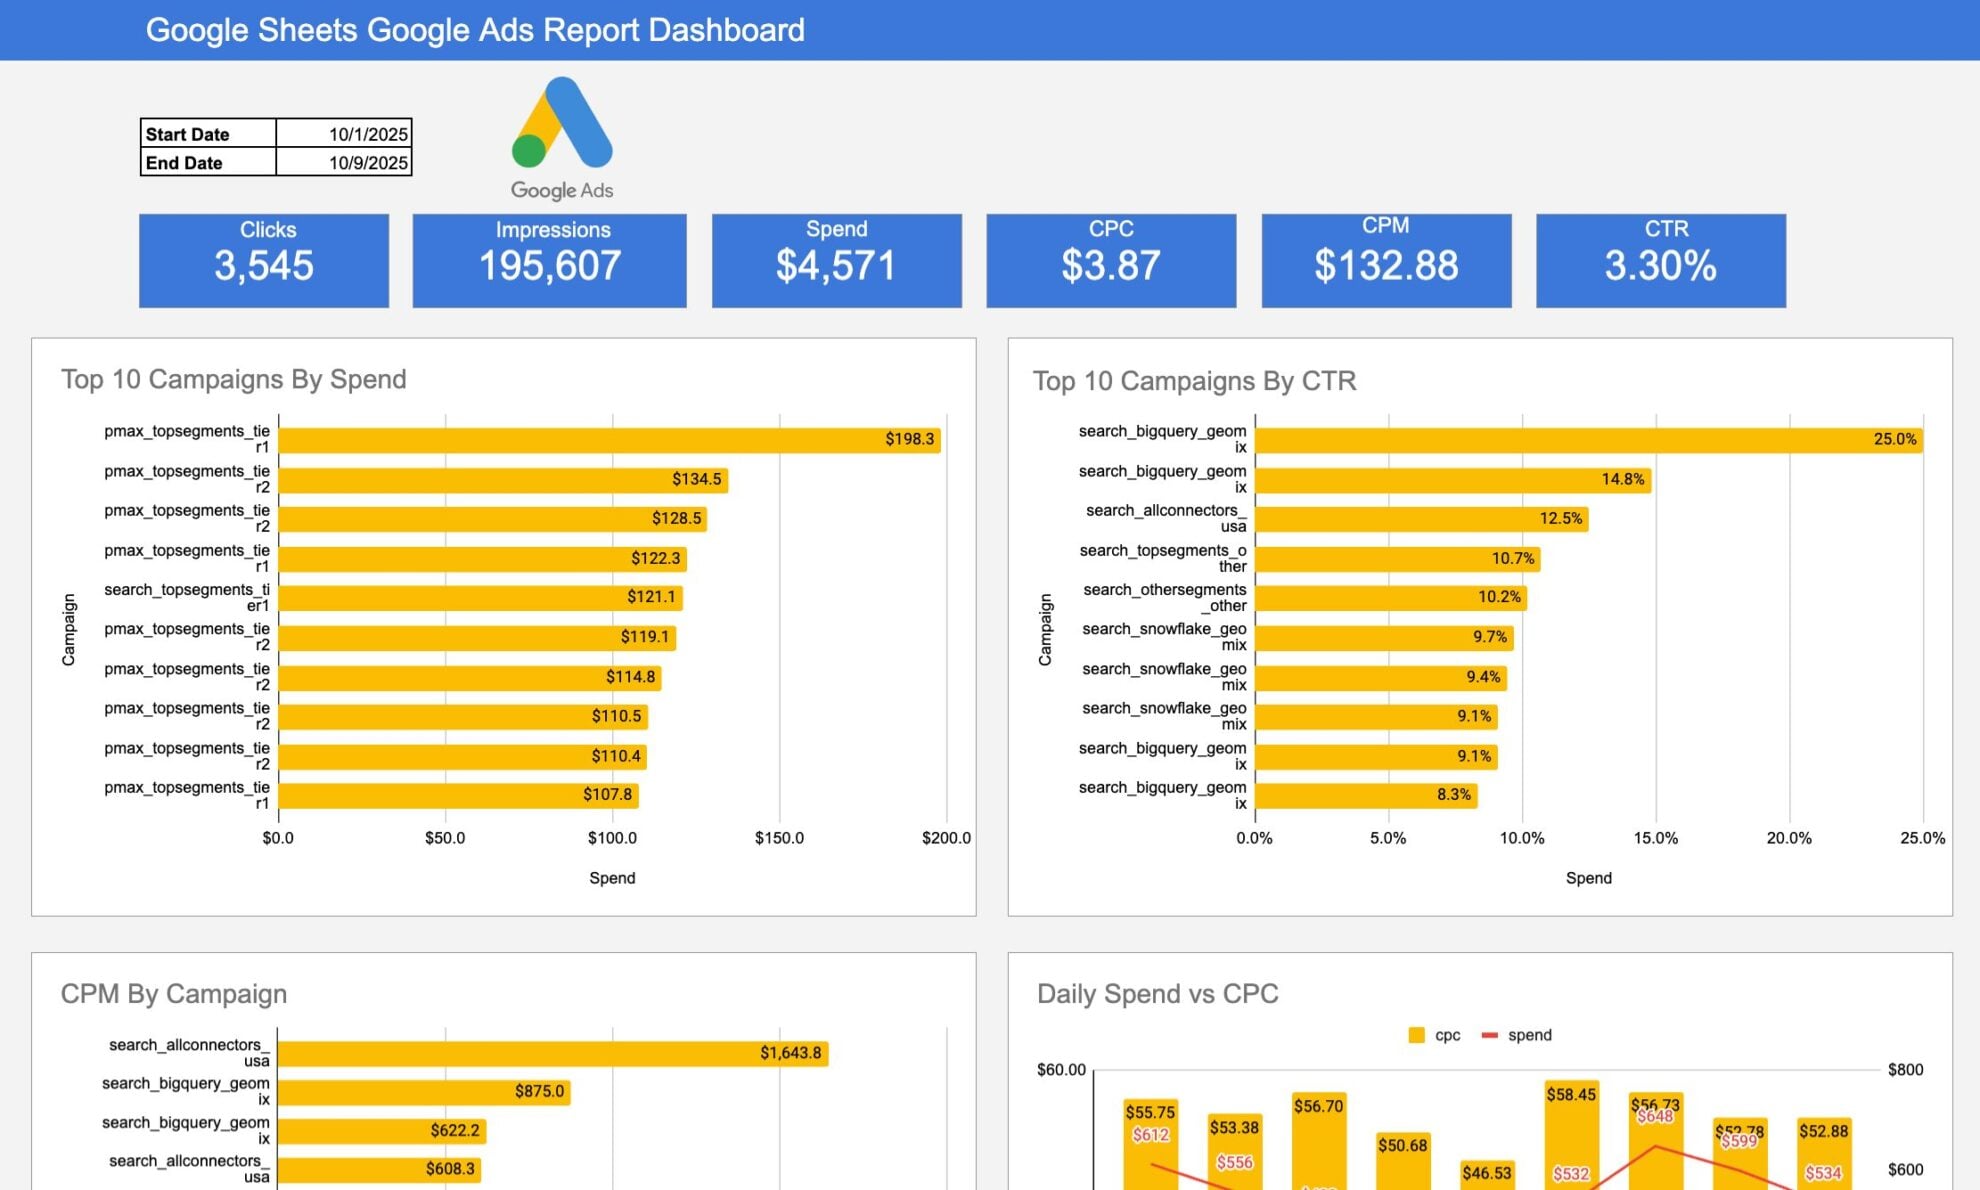
Dashboard overview
This Google Ads Google Sheets dashboard is made up of three main sections:
1) Overall performance overview
Get a high-level snapshot of your advertising account’s performance. Track total clicks, impressions, and spend as well as average CTR, CPM, and CPC within your selected date range.

2) Top 10 campaigns by spend
See where the budget concentrates and spot outliers that may need caps or creative refresh.

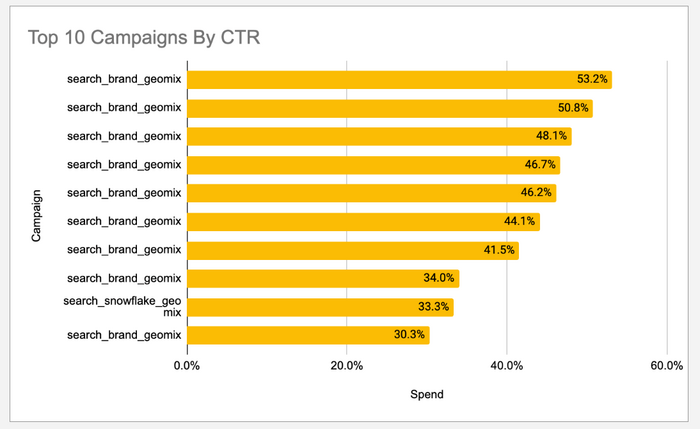
3) Top 10 campaigns by CTR
Surface the most engaging campaigns to replicate winning audiences/creatives.

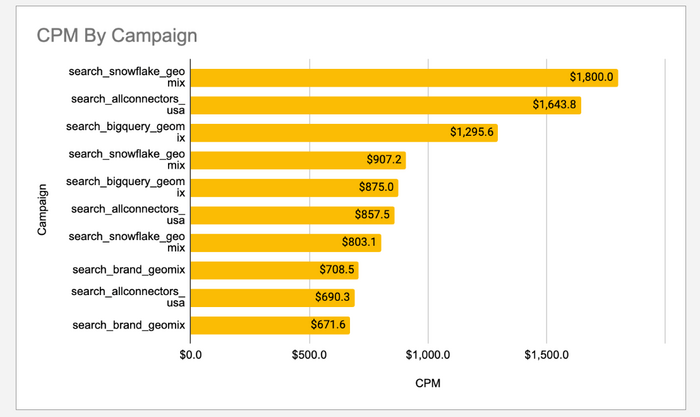
4) Campaigns by CPM
Compare cost per 1,000 impressions across campaigns to assess spend efficiency for reach and brand awareness.

4) Daily spend vs CPC
Track whether higher daily spend drives CPC up or down to refine pacing and caps.

FAQs
Do you have the detailed documentation for Google Sheets data integration with Windsor.ai?
Yes, you can find our step-by-step documentation for integrating data into Google Sheets with Windsor.ai here:
Why do I need to use this Google Ads Google Sheets template?
It’s built to track Google Ads performance in an auto-refreshing dashboard, ready for custom analysis and reporting—no manual data handling required. View how many clicks, impressions, and CTR your campaigns generate along with spend, CPC, and CPM metrics, over a certain period in the convenient, dynamic charts.
Can I track performance and spend by campaign?
Yes, the template provides detailed breakdowns of top campaigns by CTR, CPM, and spend, alongside overall account performance metrics.
How frequently is the data updated?
You can schedule dashboard updates daily, hourly, or at custom intervals, within the Windsor.ai Google Sheets extension.
Do I need to know any code to use this template?
Not at all. Windsor.ai’s templates are entirely no-code, and the setup takes just a few minutes.
Are there other paid media templates available?
Yes! Windsor.ai also offers dashboards for Facebook Ads, Instagram Ads, LinkedIn Ads, and more.
Is this Google Ads Google Sheets template free to use?
Yes, you can use any template from our gallery free of charge. The only fees might apply to data syncing using the Windsor.ai connector for automated data integration from a data source into Google Sheets. Here are our pricing plans.
Tired of juggling fragmented data? Get started with Windsor.ai today to create a single source of truth

