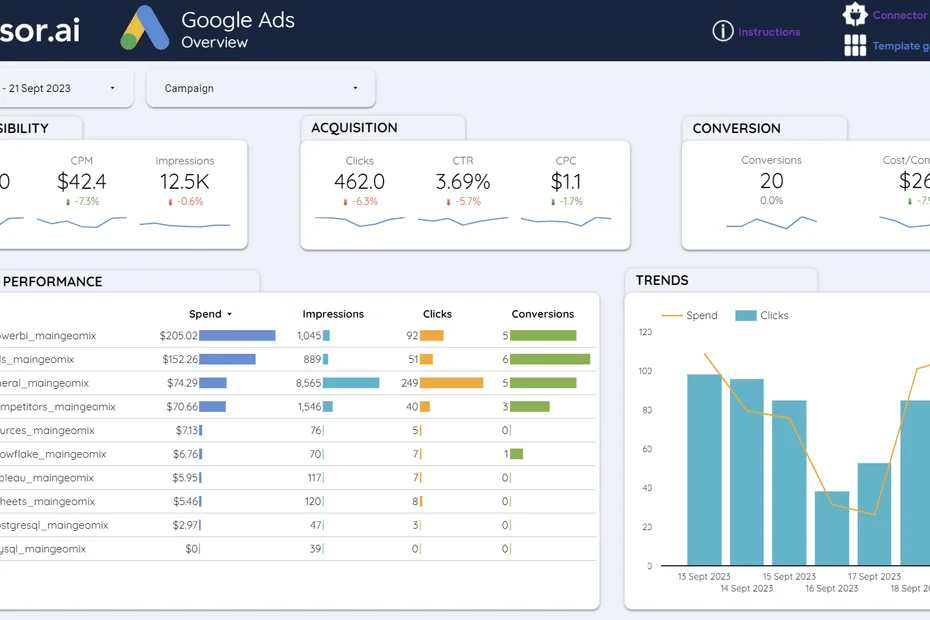
Unlock actionable insights with our free, customizable Google Ads Dashboard Template for Looker Studio. Easily connect, analyze, and visualize your advertising data in just a few clicks.
How to use the Google Ads Looker Studio Template
To get started, sync your Google Ads data with Looker Studio via Windsor.ai no-code connectors and follow a few simple steps to create your custom dashboard:
- Open the template by clicking on this link.
- Make a copy of the template (File -> Make a copy).
- For the new data source, select ‘Create new data source’
- Under ‘Community Connectors,’ click ‘Explore connectors.’ Search for ‘Google Ads by Windsor.ai‘ and add the connector.

Try Windsor.ai today
Access all your data from your favorite sources in one place.
Get started for free with a 30 - day trial.
Overview of the Google Ads Looker Studio Template components
This template will provide you with valuable insights into the performance of your Google Ads campaigns by answering key questions, such as:
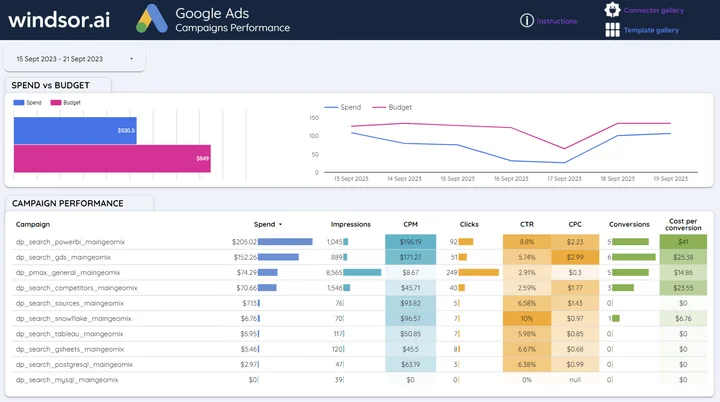
- How much are you spending on Google Ads, and how does it compare to your allocated budget?
- Which campaigns perform best, and which ones waste your ad budget?
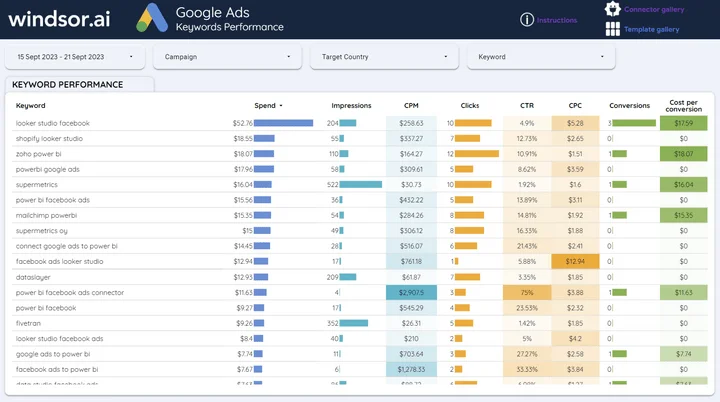
- What are your top-performing keywords, and which ones have less impact?
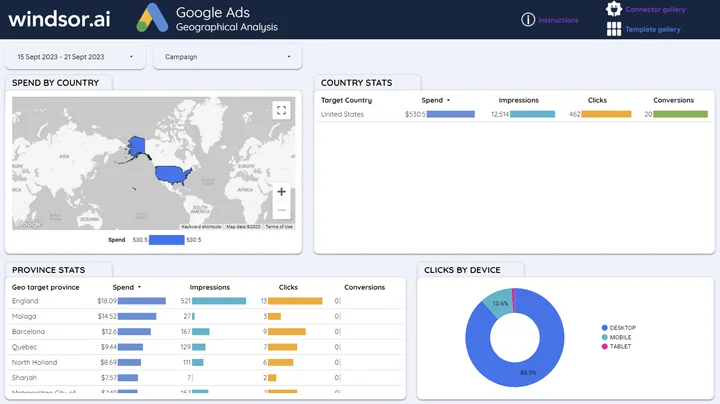
- Who is your audience, and how do different countries compare in terms of CPM, CTR, and conversion rates?
- How can you optimize your ad spending to maximize ROI?
- And much more.
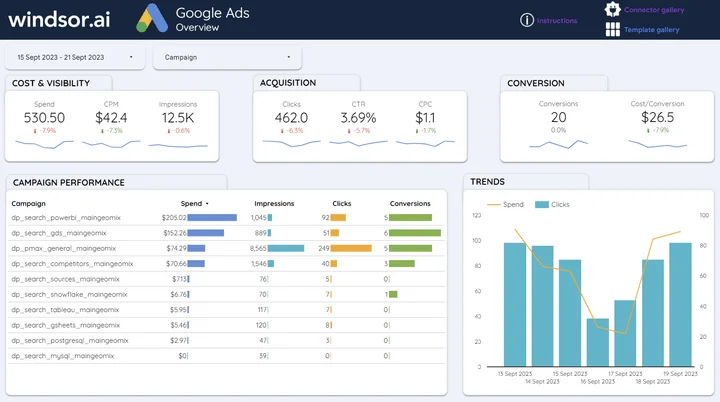
1. Overview page
2. Campaign performance page
3. Geo analysis page
4. Keyword performance page
If you’re looking to integrate additional channels or analytics insights with your Google Ads data to create a unified source of truth for your organization, visit our Marketing Template Gallery for more solutions.
Additional guides you might find helpful
Video
How to set up a Google Ads report in Looker Studio with Windsor.ai (Spanish)
Articles
Integrate data from popular marketing platforms with Looker Studio
Free Looker Studio Template Gallery
Best Free & Paid Looker Studio Connectors in 2024
Best Looker Marketing Dashboards in 2024
