Destinations
 Data sources
 AI insights
 About us
 Careers
 Security
 Customer reviews
 Contact us
 Affiliate program
 Solution partners
 Template gallery
 Looker Studio templates
 Power BI templates
 Excel templates
 Google Sheets templates
 Tableau templates
 Facebook Ads templates
 Google Ads templates
 Data fields & Metrics
 AI prompt library & Guides
 Product documentation
 API documentation
 Case studies
 Blog
Blog Data models
 Windsor vs Supermetrics
 Windsor vs Funnel.io
 Windsor vs Fivetran
 Windsor vs Rivery
 Windsor vs Portermetrics
 Windsor vs Coupler.io
 Last updated: 19 August 2026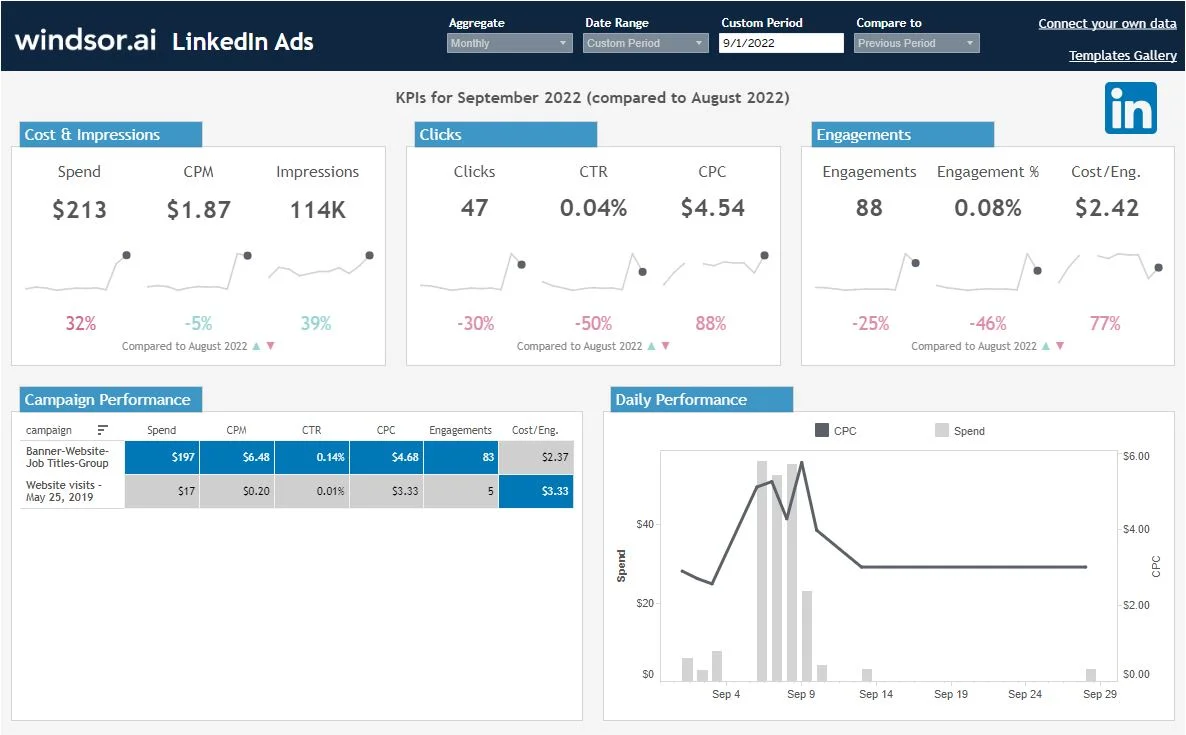




This Tableau LinkedIn Ads Dashboard template allows you to visualize your LinkedIn Ads data in Tableau in a few clicks.
Dimensions and metrics visualized in this report:
- Campaign Name
- Spend
- CPM (LinkedIn Ads Spend per 1000 Impressions)
- Impressions
- Clicks
- CTR (LinkedIn Ads Click-through rate)
- CPC (LinkedIn Ads Cost per Click)
- Engagements
- Engagement %
- Cost per Engagement
It also contains a powerful custom-built date selector, which isn’t available by default in Tableau.
How to use this template
Connect LinkedIn Ads to Windsor.ai
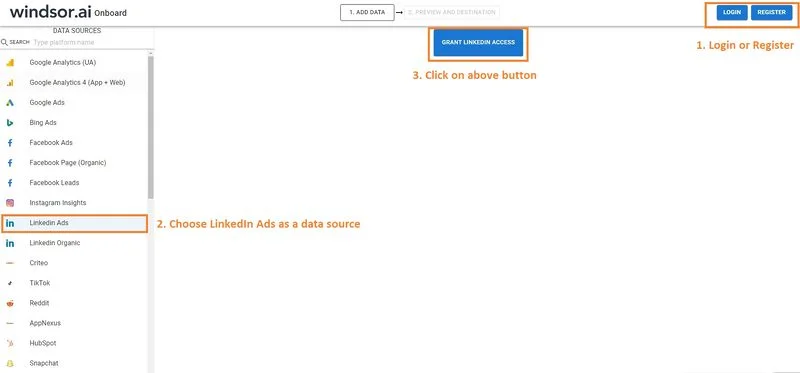
1. Connect your LinkedIn Ads Data to Windsor.ai here. Register or login if you already have an account.
2. Choose LinkedIn Ads from the left-side menu. If you want to see what other data sources you can connect to, you can find all the available data sources on this page.
3. Click on “Grant LinkedIn Access”. In the pop-up, connect to your LinkedIn account and grant the required privileges.
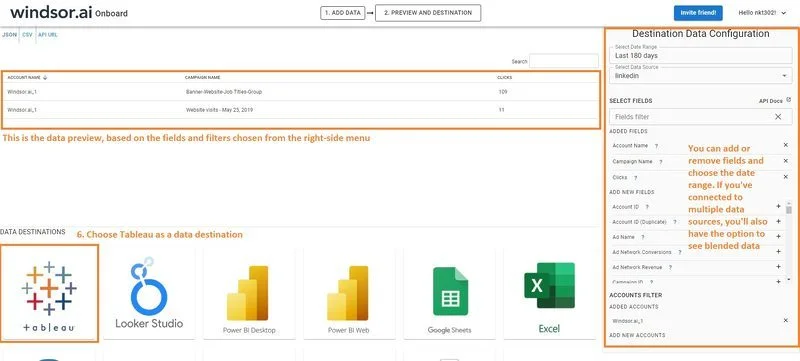
4. Choose at least one account from the drop-down.
5. Click on Preview and Destination.

6. Choose Tableau as a Destination. As you’ll probably see, there are many destination options. If you want to find out more details, you can check all the destinations that we cover.
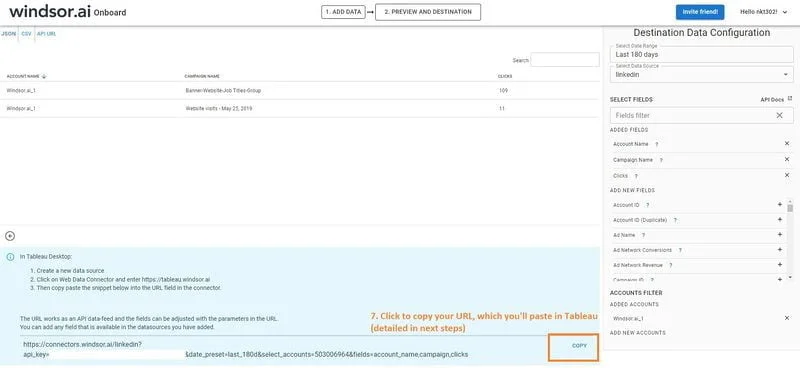
7. Copy the generated URL, you’ll need it later.
Connect LinkedIn Ads to Tableau through Windsor’s Web Data Connector
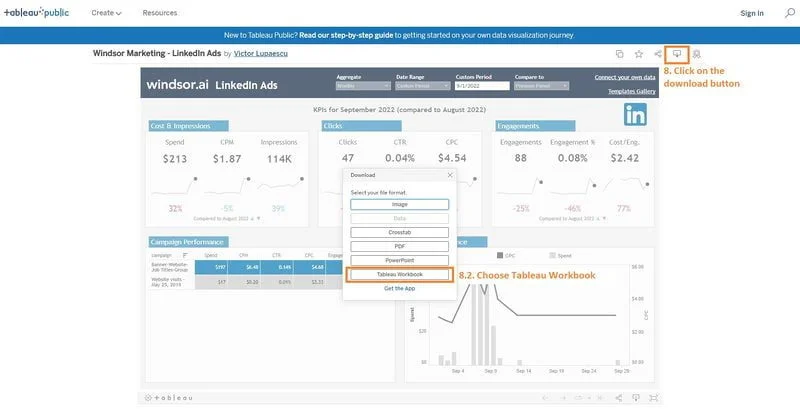
8. Download the template from here and open it in Tableau Desktop.
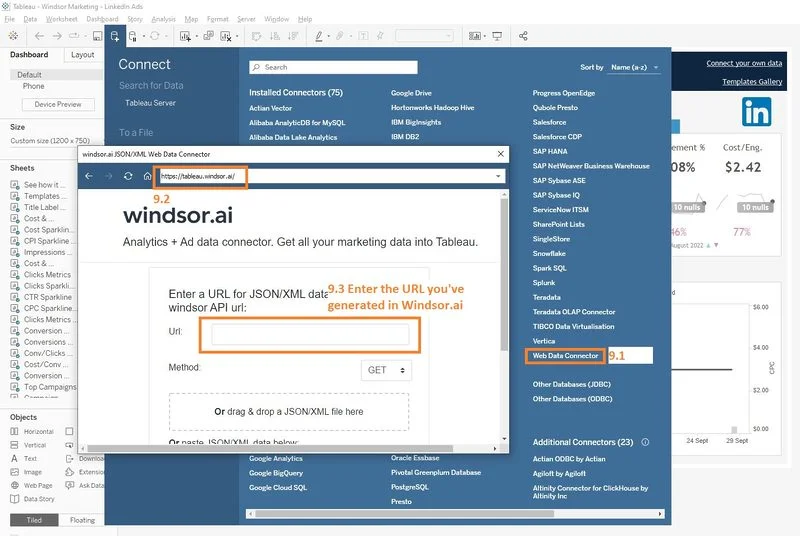
9. In Tableau Desktop, click on Data -> New Datasource.
Choose Web Data Connector -> enter https://tableau.windsor.ai -> enter the URL you’ve copied at step 7.
Note: If you want exactly the same fields as in the template, you can use this URL (replacing <API key> with your key from step 7):
https://connectors.windsor.ai/linkedin?api_key=<your_API_key>&date_preset=last_180d&fields=account_name,campaign,clicks,campaign_group_name,campaign_type,conversions,date,engagements,follows,impressions,likes,shares,spend
10. Once your data has been added, replace the existing data source with the newly created one (from Data – Replace Data Source).
That’s it. If you like this Tableau LinkedIn Ads Dashboard Template, you can check our collection of Tableau templates.

Get started for free
Access all your data from your favorite sources in one place.
Free forever plan, no credit card