 AI insights
 About us
 Careers
 Security
 Customer reviews
 Contact us
 Affiliate program
 Solution partners
 Looker Studio templates
 Tableau templates
 Facebook Ads templates
 Google Ads templates
 Data fields & Metrics
 AI prompt library & Guides
 Product documentation
 API documentation
 Case studies
 Blog
Blog Data models
 Windsor vs Supermetrics
 Windsor vs Fivetran
 Windsor vs Portermetrics
LinkedIn Page Google Sheets Report Template

This free LinkedIn Page to Google Sheets template lets you instantly visualize page views, audience insights, and top-performing posts—all in one auto-updating dashboard. No more manual data exports or complicated scripts—get comprehensive performance insights in under 2 minutes.
How to use this template: setup instructions
Prerequisites:
- An active LinkedIn Page with admin access
- Active Windsor.ai account with the API key
- Access to Google Sheets through a Google account
- Windsor.ai extension installed in Google Sheets
Connect your LinkedIn Page data to Windsor.a
Register or log in if you already have an account, and connect your LinkedIn Organic account. Select at least one account from the drop-down.

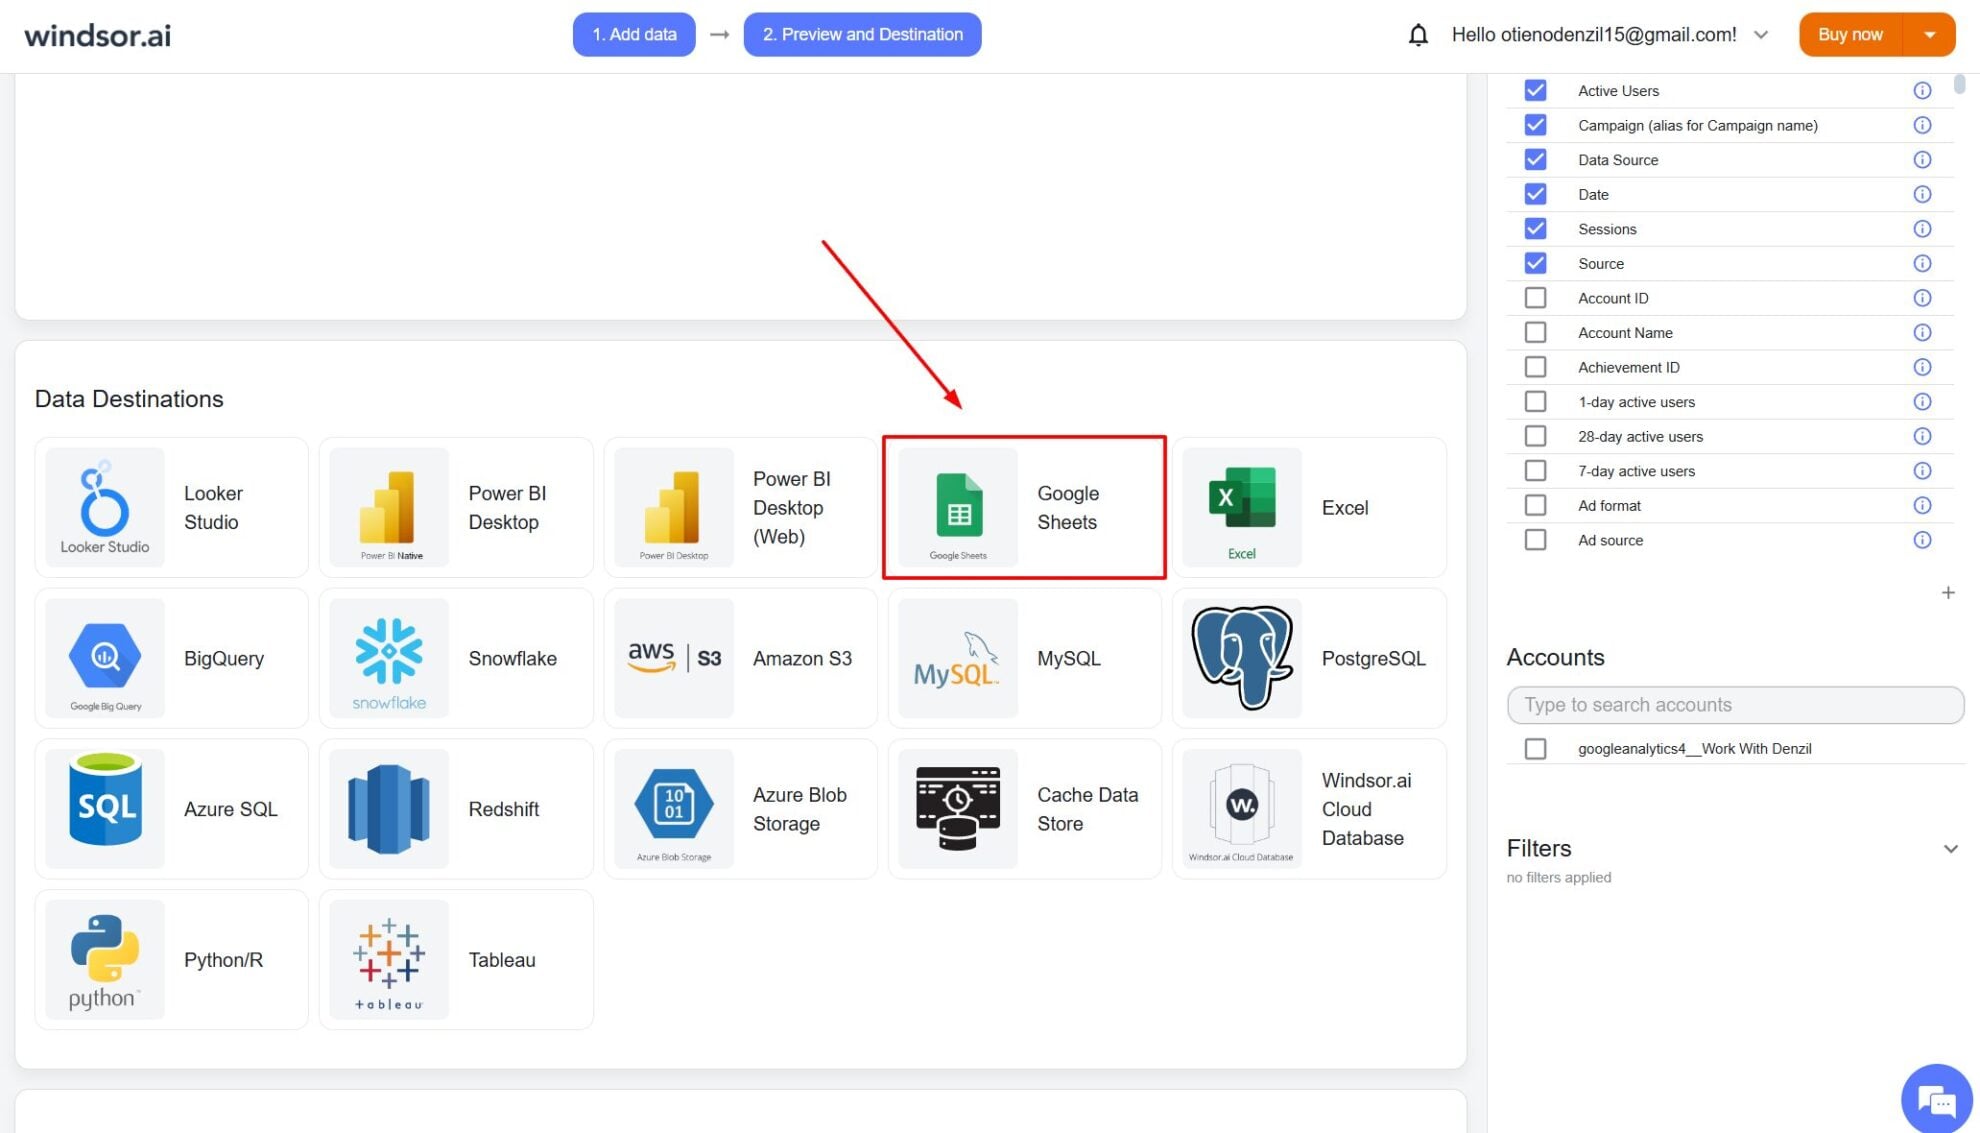
Choose Google Sheets as the destination
Click on Preview and Destination, choose Google Sheets, and copy your API Key from the instructions.
Copy this template
Open the LinkedIn Page Google Sheets Dashboard Template. Make a copy to your own Google Drive so you can edit and customize it.

Sync the data
Follow the in-template instructions to link your live data feed from Windsor.ai to the dashboard. Paste your Windsor.ai API key when prompted to activate the data connection.

Why use this LinkedIn Page Insights Google Sheets template?

Track key metrics without the busywork
Track key metrics without the busywork
Now you don’t need to log into LinkedIn every day to check post stats or profile views. Windsor.ai automatically pulls your key LinkedIn organic metrics into a Google Sheets dashboard—so you can easily monitor the latest page views, post performance, follower growth, and more, all in one place.

Get deep audience demographics insights
Get deep audience demographics insights
Understand exactly who your followers are and where they come from. This report breaks down your audience by country, industry, job specialization, and seniority—so you can fine-tune your LinkedIn content and campaigns for maximum impact.

Highlight your top posts
Highlight your top posts
See which posts generate the most engagement. This template automatically surfaces your top-performing content based on impressions, clicks, and interactions, so you can focus on what works best and replicate your success.

Customize the dashboard
Customize the dashboard
This pre-built dashboard is fully editable and easy to share. Customize visuals, apply filters, or duplicate tabs to fit your team’s specific reporting needs and brand guidelines.

Effective client reporting
Effective client reporting
Impress clients with clear, data-driven reports that highlight your impact. This template showcases key performance indicators and top-performing posts—automatically updated, beautifully presented, and easy for clients to understand at a glance.
Google Sheets LinkedIn Page dashboard template: metrics, dimensions, and breakdowns
This template offers multiple data views to help marketing teams, brand managers, and executives understand how their LinkedIn company page performs and resonates with their target audience, featuring key metrics and dimensions that matter most.
Metrics:
- Total page views
- Career views
- About page views
- Impressions by day
- Post engagement (comments, impressions, reactions)
- Top posts by performance
Dimensions:
- Date
- Post message
- Post type (text, image, video, link)
- Country of followers
- Audience details: job function, seniority, industry
Key dashboard components
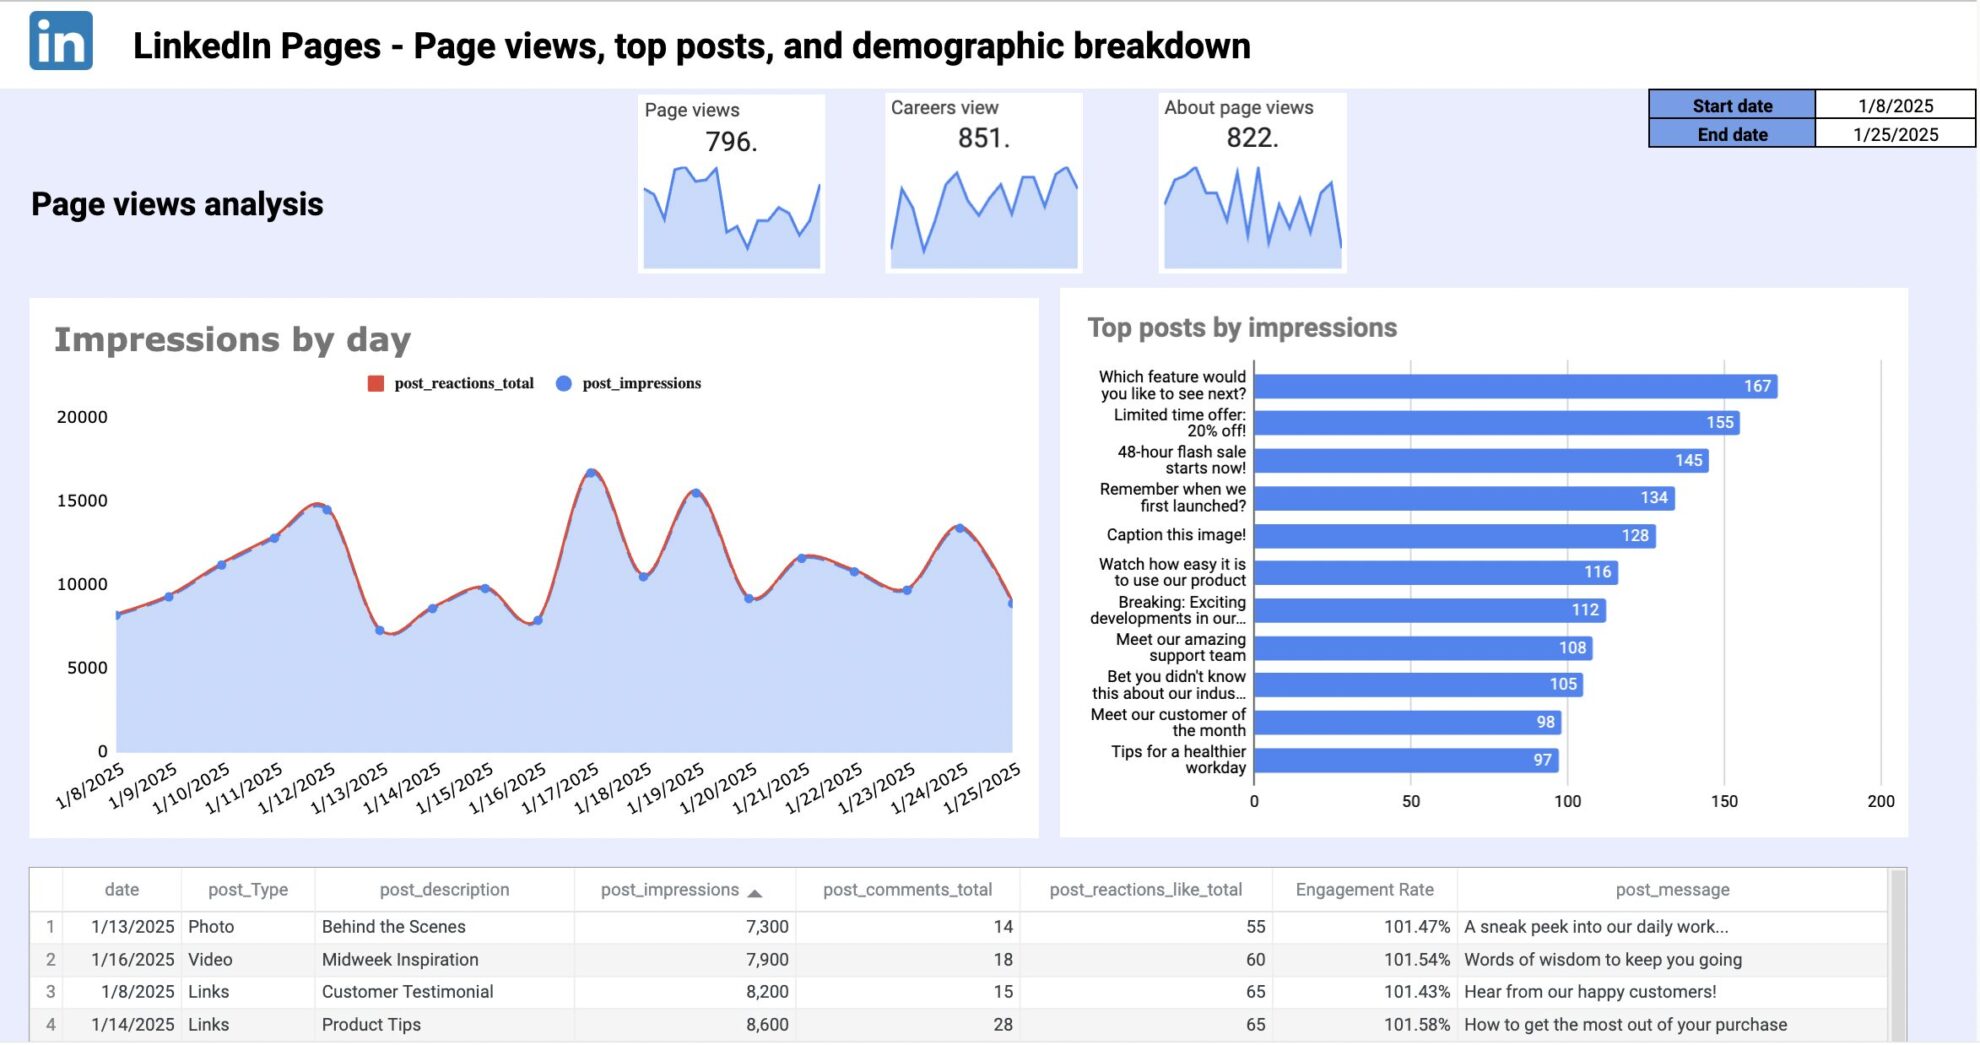
1) Overview section
A high-level summary of your page’s recent performance. See how many people viewed your page (including careers and about), how many new followers you gained, and your reach and engagement during the selected date range.
You can also visualize how your page views are trending daily, weekly, or monthly, which is great for identifying spikes after content drops or PR mentions.


2) Top posts table
Quickly see which posts had the biggest impact by sorting based on key engagement metrics like clicks, impressions, and reactions.


3) Follower demographics by country
A snapshot of your audience by location. See where your followers are based and monitor how your reach grows in key markets.


4) Audience details
Gain deeper insights into your audience, such as job function, industry, and seniority, so you can better tailor your content to their interests and needs.

FAQs
Do you have the detailed documentation for Google Sheets data integration with Windsor.ai?
Yes, you can find our step-by-step documentation for integrating data into Google Sheets with Windsor.ai here:
Do I need coding skills to use this template?
No coding required at all. This dashboard is built entirely in Google Sheets and connects via Windsor.ai’s no-code integration. You’ll just need to follow a few simple sync setup steps using your Windsor.ai API key.
Can I customize the layout and visuals of this dashboard?
Yes. You can easily edit graphs, adjust filters, add conditional formatting, or create custom tabs. It’s a fully flexible spreadsheet report.
How often is the data updated?
The data refreshes automatically based on the schedule you set in Windsor.ai—whether daily, hourly, or near real-time with a manual refresh.
Can I use this template with multiple LinkedIn Pages?
Yes. Suppose you manage multiple LinkedIn Pages and have admin access. In that case, you can configure the connector to pull data for each one and combine them in a unified dashboard or visualize separately in different tabs or sheets.
Is this Google Sheets template free to use?
Yes, you can use any template from our gallery free of charge. The only fees might apply to data syncing using the Windsor.ai connector for automated data integration from a data source into Google Sheets. Here are our pricing plans.
Does this template work for LinkedIn personal profiles?
No, it is designed specifically for LinkedIn Company pages.
Tired of juggling fragmented data? Get started with Windsor.ai today to create a single source of truth

