Connect Adform to Looker Studio
Directly connect Adform to Looker Studio, in minutes, and in an easy-to-use format.

About the Adform Google Data Studio Connector
The Adform Google Data Studio Connector pulls Metrics and Dimensions for Adform. The Insights are retrieved at the campaign level.
Once the user successfully logs into the connector he can then choose the metrics and dimensions he is interested to create a report on.
Prerequisites
To set up the connector, the user should have:
- An Adform account (Visit our privacy policy and terms of use)
- Google account for Adform to Looker Studio integration.
- A Windsor account. Start your free trial now.
How to connect Adform to Looker Studio?
Do you plan to connect and visualize your Adform in Google Data Studio? Follow the Tutorial Below:
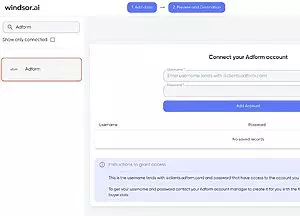
You need to select Adform as a Data Source and grant access to Windsor.ai. Select the fields on the right to later use in your data source. For example, you can include metrics such as Cost per Click, Cost per Action or Total Spend. Go to “Select Destination” and choose Google Data Studio. Once done, select “connect” and authorize access to your data source.
name type description Average Engagement Time NUMERIC This metric shows the average engagement time of visible banners. A banner is visible when at least X % of its area is visible in user's screen. X parameter is collected from Campaign Details page. Three timed events are considered during calculation - mouse-over time, video play time, and expansion time. Measurement is based on sampled data. Average Viewability Time NUMERIC This metric shows the average amount of time that users actually saw a viewable banner in their screen. TIP: A viewable impression is defined in the Ad Viewability settings, visible in the Campaign Details. Banner TEXT This dimension groups information by banner for Display campaigns, or by Adgroup for Search campaigns. Banner is an advertisement vehicle. The banner is displayed through different medias/publishers on different placements. Adgroup contains one or more keywords used in Search Engine campaigns. Banner Attribute1 TEXT This dimension groups information by Banner Attribute 1. Banner attribute is a user-defined property of a banner. Banner Attribute 1 is usually assigned to the banner batch column in Banner Overview page. Banner Size TEXT This dimension groups information by banner size. Banner size is shown as "width x height" in pixels, e.g. 300 x 250. Banner Type TEXT This dimension groups information by creative material type. Most common banner types include Flash, Image, Rich Media, Link, Keyword and other. Buy Type TEXT This dimension indicates the booking/buy types of the selected placement. Possible values - Impressions (CPM), Clicks (CPC), Viewable Impressions (vCPM), Days, Weeks, Months and Conversions. Campaign TEXT This dimension shows and groups information by campaign. The campaign is the base item in Adform system, it contains media, placements, banners. Campaign_ID TEXT This dimension groups data by Adform campaign ID. Campaign Type TEXT This dimension groups information by campaign type. Campaign type can be assigned in Campaign Details page, possible values - Display, Affiliate, Email, Social Media and other. Clicks NUMERIC This metric shows the number of clicks for the selected dimension. A click occurs when a user interacts with the advertisement by engaging a mouse button (usually the left) while the mouse pointer is hovering over the advertisement. Clicks To Landing Page NUMERIC This metric shows the percentage of clicks ending up as visits on the landing page for the selected dimension. Clicks Cross Device NUMERIC This metric shows the number of times that users clicked on a banner and were directed to an advertiser's destination. When selecting uniqueness levels, a user is considered unique across all their devices and identifiers. TIP - User engagements with rich media banners, e.g., click on video play start button, are not taken into account. Client TEXT Displays client/advertiser information. Used to group campaigns, in benchmarking reports etc. Conversions NUMERIC A tracked page can be defined as a Conversion - usually a page where a sign-up is confirmed or a sale is made. This metric shows the number of all Conversion pageviews displayed as a sum for all tracked conversion pages. Conversions for all Campaign interactions only NUMERIC Display site tracking statistics for all Campaign ad interaction only Conversions for all Non Campaign interactions only NUMERIC Display site tracking statistics for all Non Campaign ad interaction only Conversions for Download Pages NUMERIC Display statistics for Download page category only Conversions for Home Pages NUMERIC Display statistics for Home page category only Conversions for Info Pages NUMERIC Display statistics for Info Pages page category only Conversions for Landing Pages NUMERIC Display statistics for Landing Pages page category only Conversions for None defined category of Pages NUMERIC Display statistics for None defined page category only Conversions for post Click interactions only NUMERIC Display site tracking statistics for post Click ad interaction only Conversions for post Impression interactions only NUMERIC Display site tracking statistics for post Impression ad interaction only Conversions for Product Pages NUMERIC Display statistics for Product page category only Conversions for recent Click interactions only NUMERIC Display site tracking statistics for recent Click ad interaction only Conversions for recent Impression interactions only NUMERIC Display site tracking statistics for recent Impression ad interaction only Conversions for Sign Up Pages NUMERIC Display statistics for Sign Up page category only Conversions for Thank you Pages NUMERIC Display statistics for Thank you page category only Conversions Type 1 NUMERIC Conversions Type 2 NUMERIC Conversions Type 3 NUMERIC Conversions (all) NUMERIC A tracked page can be defined as a Conversion - usually a page where a sign-up is confirmed or a sale is made. This metric shows the number of all Conversion pageviews, displayed as a sum for all tracked conversion pages. It has predefined Uniqueness of 'No Repeat', which means that Conversion pageviews, generated by the same user within 15 minutes, are excluded. Cost NUMERIC This metric shows the cost value for the selected dimension (usually on a media, placement (line item) level). Please check documentation for more details. Cost By Sales NUMERIC This metric shows Cost value divided by Sales value. Cost is either booked or accumulated cost for the selected dimension, or RTB Budget Spent in case of Real Time Bidding campaign. Sales is a system variable and represents the returned value of a campaign. Cost Non View NUMERIC This metric shows the cost value taking into account the percentage of non-viewable and undetermined impressions. TIP - Check documentation for more details. Cost Post Click NUMERIC This metric shows the post click conversions cost. Cost View NUMERIC This metric shows the cost value taking into account the percentage of viewable impressions. TIP - Check documentation for more details. Country COUNTRY Geographical dimension, groups information by visitor's country e.g. Denmark, UK, USA, etc. Cov NUMERIC This metric shows the conversion rate for the selected dimension. Calculated as conversions divided from clicks, in percent. Ctr PERCENT This metric shows click-through rate for the selected dimension. It is a percentage of users who have been exposed to an advertisement and then clicked. Calculated as clicks divided from impressions, in percent. Ctr Adjusted NUMERIC This metric shows click-through rate for the selected dimension. It is a percentage of users who have been exposed to an advertisement and then clicked. Calculated as clicks divided from impressions, in percent. This metric considers all tag serving types such as Impressions, Invisible, Offile, etc. except for Clicks in order to assure consistent metric values. Ctr Unique NUMERIC This metric shows unique click-through rate for the selected dimension. It is a percentage of unique users who have been exposed to an advertisement and then clicked. Calculated as campaign unique clicks divided from campaign impressions, in percent. Ctr View NUMERIC This metric shows the percentage of impressions that resulted in a click, taking into account only those impressions that were actually in the users' screens. Date DATE This dimension groups information by date when a transaction happened. Device type TEXT Technical dimension, groups data by device type, which can be - Desktop and Laptop, Small Screen Phone, Smart Phone, Tablet, Other Mobile, Media Hub, Console, TV, eReader, Smart Watch, Smart Speaker. It shows what share of traffic comes from different device types. Effective Cost per Action NUMERIC This metric shows effective Cost per Conversion (ID Fusion) with the conversion pages listed as a sum. Here, the user may have interacted with the campaign and website on different devices. Effective Cost per Click NUMERIC This metric shows cost per click for the selected dimension. Cost is either booked or accumulated cost for the selected dimension, or RTB Budget Spent in case of Real Time Bidding campaign. Effective Cost per Thousand Impressions NUMERIC This metric shows cost per mille (thousand impressions) for the selected dimension. TIP: to report on eCPM (Reach) metric set Uniqueness as “Campaign Unique” and Cost type as “RTB” in metric settings. Engagements NUMERIC This metric shows the count of user interactions with a banner. User interactions are tracked as user-initiated banner events for Rich Media, Flash and Image banner types. Examples of user-initiated banner events are mouse-over (only if > 1 sec.), video play button press, close button press, etc. Not user-initiated banner events are not included into this metric, except for auto-expand event. Examples of not user-initiated banner event are Floating Banner Shown, 25% of Video Play, etc. EngagingImpressions NUMERIC This metric shows the sum of impressions, where at least one engagement occurred during each impression. Engagements are tracked as user-initiated banner events for Rich Media, Flash and Image banner types. Examples of user-initiated banner events are mouse-over (only if > 1 sec.), video play button press, close button press, etc. Event TEXT This dimension groups information by banner event name. Banner events can be implemented in flash banners in order to track user interactions with banners, such as expands, clicks on play button, etc. Events NUMERIC This metric shows how many times an event has been invoked in a banner. Events can be implemented in flash banners in order to track user interactions with banners, such as expands, clicks on play button, etc. Tip - use with dimension Event Name if several different events are implemented. Hour TEXT Time dimension, groups information by hour of the day (values from 0 to 23). Impressions NUMERIC This metric shows the number of tracked ads (formerly known as impressions) and includes both rendered and served-but-not-rendered ads. Both client-initiated and server-initiated measurement is taken into account. Only client-initiated measurement is compliant with Media Rating Council (MRC) guidelines. LineItem TEXT This dimension groups information by Line Item. Line Item is an advertisement spot on a media/publisher. Line Item End Date DATE This dimension displays Line Item end date collected from Mediaplan scheduler. Line Item ID TEXT This dimension groups data by Adform Line Item ID. Line Item Label 01 TEXT This dimension groups data by Line Item Label 01 Line Item Label 1 TEXT This dimension groups data by Line Item Label 10 Line Item Label 11 TEXT This dimension groups data by Line Item Label 11 Line Item Label 12 TEXT This dimension groups data by Line Item Label 12 Line Item Label 13 TEXT This dimension groups data by Line Item Label 13 Line Item Label 14 TEXT This dimension groups data by Line Item Label 14 Line Item Label 15 TEXT This dimension groups data by Line Item Label 15 Line Item Label 16 TEXT This dimension groups data by Line Item Label 16 Line Item Label 17 TEXT This dimension groups data by Line Item Label 17 Line Item Label 18 TEXT This dimension groups data by Line Item Label 18 Line Item Label 19 TEXT This dimension groups data by Line Item Label 19 Line Item Label 02 TEXT This dimension groups data by Line Item Label 02 Line Item Label 20 TEXT This dimension groups data by Line Item Label 20 Line Item Label 03 TEXT This dimension groups data by Line Item Label 03 Line Item Label 04 TEXT This dimension groups data by Line Item Label 04 Line Item Label 05 TEXT This dimension groups data by Line Item Label 05 Line Item Label 06 TEXT This dimension groups data by Line Item Label 06 Line Item Label 07 TEXT This dimension groups data by Line Item Label 07 Line Item Label 08 TEXT This dimension groups data by Line Item Label 08 Line Item Label 09 TEXT This dimension groups data by Line Item Label 09 Line Item Start Date DATE This dimension displays Line Item start date collected from Mediaplan scheduler. Measurable Impressions NUMERIC This metric shows the part of measured impressions that were actually in the users' screens, calculated as the percentage of viewable impressions in relation to measurable impressions Media TEXT Media/publisher is the provider of online advertising space, such as an online newspaper, social network site or other. Media Plan Amount NUMERIC This metric shows the spent amount visible in the Mediaplan. It can be set to show gross amount or net amount. Could be used to report on the cost and fee breakdown of a campaign. Media Plan Net Amount NUMERIC This metric shows the net spent amount visible in the Mediaplan. Total Pageviews NUMERIC This metric shows the number of all tracked pages (tracking points) pageviews, displayed as a sum for all tracked pages. Roi PERCENT This metric shows the return of investment. A positive value corresponds to capital growth, a negative value corresponds to capital decay, and a value of 0% corresponds to no change. It is calculated as (Sales - Cost) / Cost * 100%, or as (Sales - RTB Budget Spent) / RTB Budget Spent * 100% in case of Real Time Bidding campaign. Rtb Domain TEXT This dimension groups data by RTB domain. RTB domains show 2nd level URLs of publisher sites (e.g. cnn.com), where a banner was displayed when impression was registered. RTB domain values are tracked and sent to Adform by AdExchanges. Rtb Inventory Source TEXT Groups information by RTB Inventory Source. Inventory source is an ad exchange, which can be selected for running a Real Time Bidding campaign, e.g. Admeld, Microsoft Ad Exchange, etc. Real-Time Bidding Bids NUMERIC This metric shows the number of offers done by Adform in attempt to win an impression on an ad exchange auction. Real-Time Bidding Win Rate NUMERIC This metric shows the proportion of impressions (won bids) in total number of bids (attempts to win an impression). Calculated as Impressions / Bids in %. Sales NUMERIC This metric shows the sales value collected from all visits on tracked pages and is an Order level variable. Collected only if variable is implemented in Tracking points. It has predefined Uniqueness of 'No Repeat', which means that sales value form pageviews, generated by the same user within 15 minutes, are excluded. Total Sales NUMERIC This metric shows the sales value collected from all visits on tracked pages. Collected only if variable is implemented in Tracking points. Tag TEXT Tag is a small piece of code used to track online advertisements. This dimension groups information in relations to tags, it could be used to show rotators information. Total Cost NUMERIC This metric shows the cost value for the selected dimension (usually on a media, placement (line item) level). Please check documentation for more details. (Duplicate) Unique Impressions Percent PERCENT This metric shows the percentage of unique tracked ads(formerly known as impressions) in relation to all registered tracked ads Video views 100 NUMERIC This metric shows 100% of the interactions with video banners,where banner events are implemented. Interactions such as Play, Pause, Stop, Sound On,and others can be reported Video views 25 NUMERIC This metric shows at least 25% of the interactions with video banners,where banner events are implemented. Interactions such as Play, Pause, Stop, Sound On,and others can be reported Video views 50 NUMERIC This metric shows at least 50% of the interactions with video banners,where banner events are implemented. Interactions such as Play, Pause, Stop, Sound On,and others can be reported Video views 75 NUMERIC This metric shows at least 75% of the interactions with video banners,where banner events are implemented. Interactions such as Play, Pause, Stop, Sound On,and others can be reported Viewable Impressions NUMERIC This metric shows the number of eligible impressions that were actually in the users' screens. According to IAB standards, an impression is counted as viewable when at least 50 % of the banner area is visible in the user's screen for at least 1 second; at least 30% of the large (greater than 242,000 pixels) banner area is visible in the user's screen for at least 1 second; at least 50% of the in-stream video is visible in the user's screen for at least 2 seconds. This metric is accredited by Media Rating Council (MRC) only when reported together with 'Ad Creative Type' dimension. Visitors NUMERIC Shows the number of unique visitors in advertiser's website for the selected tracking setup. Visits NUMERIC Shows the number of visits in advertiser's website for the selected tracking setup.
Easily connect Adform to Looker Studio
See the value and return on every marketing touchpoint

Providing 50+ marketing data streams, we make sure that all the data we integrate is fresh and accessible by marketers, whenever they want.

Spend less time on manual data loading and spreadsheets. Focus on delighting your customers.