 AI insights
 About us
 Careers
 Security
 Customer reviews
 Contact us
 Affiliate program
 Solution partners
 Looker Studio templates
 Tableau templates
 Facebook Ads templates
 Google Ads templates
 Data fields & Metrics
 AI prompt library & Guides
 Product documentation
 API documentation
 Case studies
 Blog
Blog Data models
 Windsor vs Supermetrics
 Windsor vs Fivetran
 Windsor vs Portermetrics
Connect Adform to Snowflake
Easily integrate your Adform data into Snowflake with Windsor.ai’s ETL connector.
Our platform automates the flow of Adform data into Snowflake, bringing programmatic activity into a single warehouse for secure storage, advanced analytics, and cross-channel integration.
Forget CSVs. Stop copy/paste. Connect data in 2 minutes. No code required.


Centralize and analyze programmatic data with Adform to Snowflake integration
By connecting Adform to Snowflake via Windsor.ai, you can store programmatic data long term, combine it with other business datasets, and query it using SQL. Key benefits of this integration include:

Complex data processing
Complex data processing
Once Adform data is loaded into Snowflake, large volumes of programmatic records can be joined, aggregated, and transformed efficiently. Snowflake handles high data volumes without slowdowns as datasets and workloads grow.

Advanced SQL querying
Advanced SQL querying
Snowflake supports high-performance SQL querying on Adform data, making it easy to explore trends, compare performance, and run detailed queries across campaigns, placements, and time periods.

Automated ETL pipelines
Automated ETL pipelines
Windsor.ai automatically ingests Adform data into Snowflake, eliminating manual workflows and keeping your datasets structured for scalable querying and processing.

Secure data storage
Secure data storage
Store your Adform data securely in Snowflake with built-in encryption and access controls. This ensures long-term data retention while maintaining governance, reliability, and controlled access across teams.
Using Windsor.ai connector to import data from Adform into Snowflake
Syncing Adform data into Snowflake often requires complex setups, manual exports, or ongoing engineering support. Windsor.ai simplifies this process with a fast, cost-effective, and fully no-code solution.
Our automated ELT connector integrates Adform with Snowflake in minutes, delivering structured datasets for scalable storage and SQL-based analysis.
How to connect Adform to Snowflake in Windsor.ai
To set up the connector, make sure you have the following things in place:
- Adform account with the required permissions
- Configured Snowflake environment
- Active Windsor.ai account
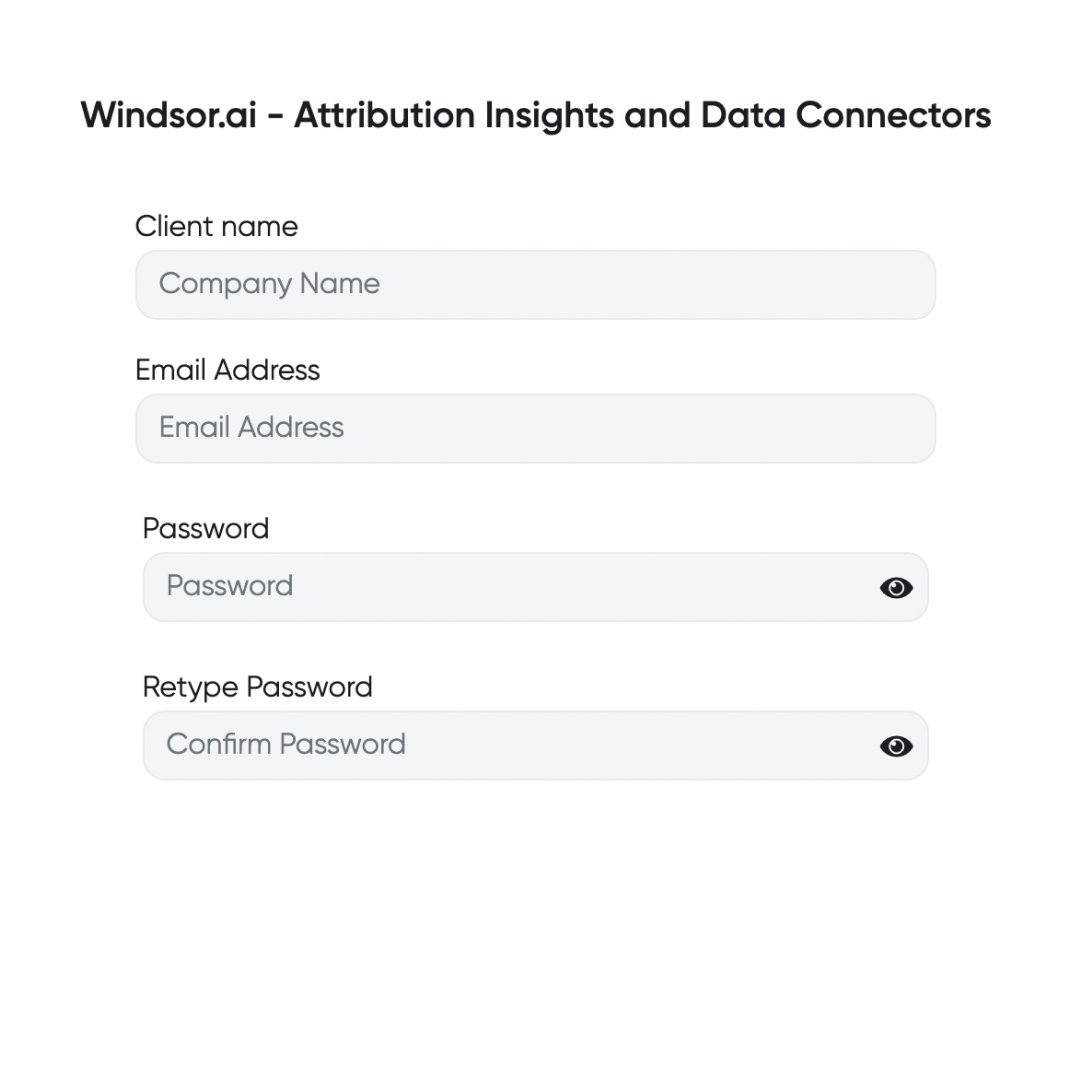
Register and log in to Windsor.ai
Create a new Windsor.ai account or log in if you already have one.
Prepare your Snowflake environment
Set up the database on the Snowflake side where you want to stream your data to, giving all the necessary permissions to Windsor.ai.

Connect a data source
In your Windsor.ai dashboard, connect Adform to Windsor.ai. Select the necessary account(s) you want to pull data from and click “Next.”

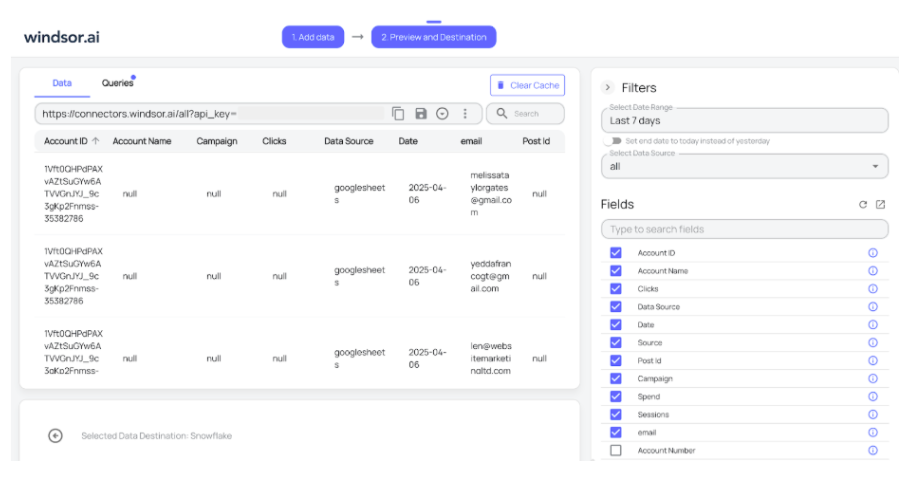
Set Snowflake as a data destination
In the preview and destination dashboard, select Snowflake and create a destination task. Enter all the essential details in the destination task table and save the task.

See the integrated data in Snowflake
Verify that your data is being added to the database by previewing the data table in your Snowflake account.

FAQs
What is Snowflake?
Snowflake is a cloud-native data warehouse designed for scalable data storage, processing, and analytics. It enables businesses to centralize and analyze large datasets efficiently using business intelligence tools. As a cloud-agnostic platform, Snowflake runs seamlessly on multiple cloud providers, including Amazon Web Services (AWS), Google Cloud, and Microsoft Azure, ensuring flexibility and high performance.
Do you have helpful links to get started with integrating Adform and Snowflake using Windsor.ai?
Yes, we have helpful resources to help you get started. You can explore our official documentation and tutorials for seamless Adform to Snowflake integration with Windsor.ai:
How much time do I need to create the Adform and Snowflake integration?
Windsor.ai provides a user-friendly interface and a powerful data connector that enables you to integrate Adform with Snowflake in under 5 minutes, making the process quick and hassle-free.
How much does it cost to integrate Adform into Snowflake with Windsor.ai?
Windsor.ai’s pricing for Adform into Snowflake integration can vary depending on your use case. We offer absolutely transparent, fixed pricing plans for diversified business needs and budgets, starting at just $19/month and coming with a 30-day free trial.
Tired of manual Adform data exports? Get started with Windsor.ai today to automate your reporting

