Connect ChartMogul to Looker Studio
Use Windsor codeless data tools to connect ChartMogul and Looker Studio. Gain deep insights into the performance of your go-to-market strategies based on the dynamic subscription data analytics platform. Automate business intelligence reports and learn new ways to monetize and optimize your subscription revenue and update strategies in real-time. The integration process requires no complex setup or technical expertise.

Why do I need ChartMogul and Looker Studio integration?
ChartMogul creates data stacks and analytics based on multiple applications commonly used by SaaS businesses. Looker Studio connects to the data stacks through intelligent data logic, enabling advanced analytics. The dataflow feature in Looker Studio also allows automatic syncing of data and automated reporting with real-time updates. The combined capabilities of ChartMogul and Looker Studio can benefit your business in the following ways:
Capitalize on subscription analytics
ChartMogul connects data from about 20 sources into a single unified subscription data analytics platform. It then combines the data with CRM metrics, allowing a complete view of the subscriptions pipeline. Synchronizing ChartMogul and Looker Studio deepen the view of subscription analytics by integrating marketing metrics into the analysis. The resultant infused data forms a rich business intelligence resource that the entity can capitalize on to make decisions.
Optimize monetization in your SaaS business
Data from ChartMogul plays a significant role in the monetization of services in your SaaS business model. Using data touchpoints like generated leads, trials, and subscriptions, it becomes possible for the business to measure success in the monetization of the services. Detailed analytics of the subscription data through Looker Studio can point to new opportunities for monetization. At the same time, the performance of the existing monetization model can point to ways in which the business can aggregate or disaggregate services for revenue maximization.
Advance your go-to-market strategies
Through Looker Studio’s business intelligence and analytics, your SaaS business can further develop and advance go-to-market (GTM) strategies. ChartMogul and Looker Studio avail the opportunity to create data models for different GTM strategies. Real-time capture of the performance metrics creates the opportunity to adjust the strategies and adapt them to market indicators. Business leaders like CEOs and founders can remain ahead of the market by using real-time updates for the adaptation of GTM strategies.
Enhance collaboration and teamwork
ChartMogul allows the integration of data from everyday apps used by teams in your organization. Looker Studio enables the creation of shared dashboards that can enhance collaboration and co-creation. Connecting ChartMogul and Looker Studio amplifies the extent to which the teams in your organization can work together on projects by having a complete view of the funnel. The more data the teams get to understand, the better the business decisions they implement.
Improve customer engagement
Engaged customers are satisfied customers. Using ChartMogul and Looker Studio enhances how you interact with your customers. Apart from the CRM feature in ChartMogul, customer engagement is also enhanced through an intelligent billing system. Analysis of CRM metrics through Looker Studio dashboards and visualizations points to opportunities for continuous improvement in customer engagement.
Prerequisites
To set up the connector, the user should have:
- ChartMogul account (Visit our privacy policy and terms of use)
- Google account for Looker Studio integration.
How to connect ChartMogul to Looker Studio
1. Register
Register or login if you already have an account.
2. Select your source
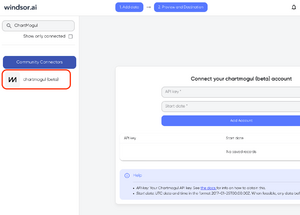
You need to select ChartMogul as a Data Source and Grant Access to Windsor.ai.

3. Select the fields on the right.
Select the fields on the right to later use in your data source.
4. Select Destination
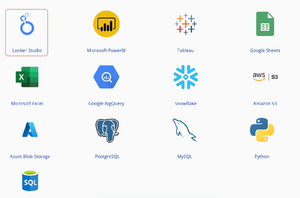
Go to “Select Destination” and Choose Looker Studio.

5. Sync and authorize data
Select “connect” and authorize access to your data source.
FAQs
What is ChartMogul?
ChartMogul is described as the first CRM that is tailor-made for B2B SaaS companies. The platform enables businesses to capture and analyze all subscription-based data. Such data may include sales leads, trials, and subscriptions. Since the data exists in separate data silos, ChartMogul plays the role of integrating the data from other applications and creating a unified dataset for advanced analytics. The features of ChartMogul allow for data exports to other applications, including Looker Studio.
What is Looker Studio?
Looker Studio is an online data analytics software by Google. Looker Studio allows users to import data from different applications for advanced data analytics and visualization. The power of Looker Studio is anchored in the dataflow designs since users can automate the syncing of data with little coding experience. Businesses that use Looker Studio enjoy the benefits of an online analytics platform that enables collaboration among teams.

Try Windsor.ai today
Access all your data from your favorite sources in one place.
Get started for free with a 30 - day trial.
Extract ChartMogul data to Looker Studio with Windsor.ai
See the value and return on every marketing touchpoint

Providing 50+ marketing data streams, we make sure that all the data we integrate is fresh and accessible by marketers, whenever they want.

Spend less time on manual data loading and spreadsheets. Focus on delighting your customers.