Multichannel marketing data analysis via Python using pywindsorai
Introduction
This post introduces pywindsorai, which can help you analyze your ad campaign performance over multiple channels simultaneously. Developers can use this tool to measure the performance of their campaigns, compare and contrast RoI between different marketing platforms. Being a Python library, they can then use this data directly with their favorite data analysis and visualization tools like NumPy / pandas, matplotlib, PyTorch, and even PySpark. They can then extract insights that could help optimize their marketing spend, and probably even generate valuable product feedback.
In this article, we will show two simple examples of how you can use pywindsorai and pandas to optimize your campaigns, in this case, by generating bar graphs created from the data from windsor.ai’s APIs:
- Generating top 10 best performing campaigns
- Compare campaign performance across platforms (Ex: Google vs Facebook).
Setup your windsor.ai account and API key
You need to get a free API key to access windsor.ai’s APIs. Register your account first and add a data source like Facebook ads and then get the API key. For more details check out our official API documentation and this article. Get the API key at https://onboard.windsor.ai
Install the dependencies
pip install pywindsorai pandas matplotlib
Loading the data and visualizing it
import pandas as pd
import matplotlib.pyplot as plt

from pywindsorai.client import Client
from pywindsorai.enums import LAST_7D
from pywindsorai.enums import FIELD_SOURCE, FIELD_CAMPAIGN, FIELD_CLICKS

api_key='c0eae325c8fb85a0c256da2cd08a27e81972'

client = Client(api_key)
campaign_clicks = client.connectors(date_preset=LAST_7D, fields=[FIELD_SOURCE, FIELD_CAMPAIGN, FIELD_CLICKS])
Example 1: Generating top 10 best performing campaigns
df = pd.DataFrame(campaign_clicks['data'])

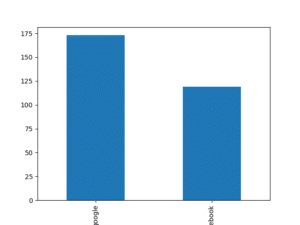
clicks_by_channel_df = df.groupby('source')['clicks'].sum().sort_values(ascending=False)
clicks_by_channel_df.plot.bar()
plt.show()

Example 2: Compare campaign performance across platforms
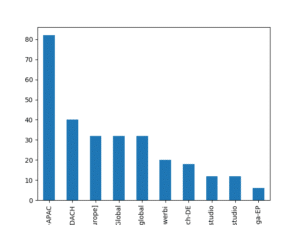
top_10_campaigns_df = df.groupby('campaign')['clicks'].sum().sort_values(ascending=False).nlargest(10)
top_10_campaigns_df.plot.bar()
plt.show()

Of course, you can do a lot more data analysis than these two simple examples. But we hope this post gives you a good idea. Let us know what you’re building on top of pywindsorai, we’d love to hear! 🙂


