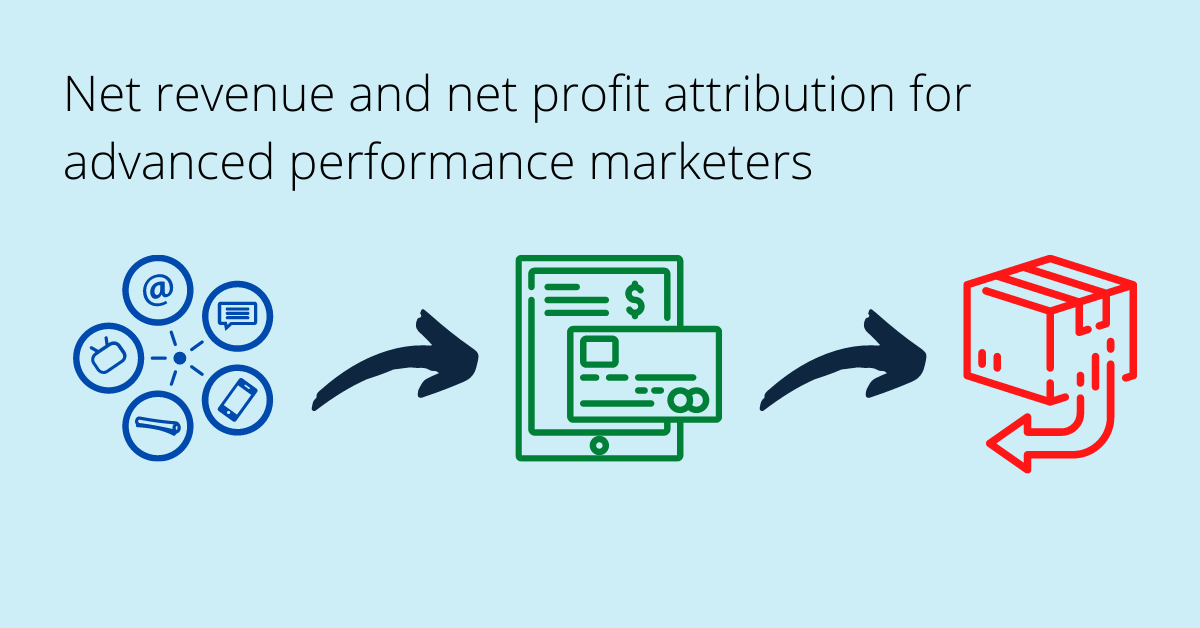
Net revenue and net profit attribution for advanced performance marketers

Do you have many returns or cancellations on your ecommerce transactions? This is a very common pattern in most of Europe and parts of Asia. Your ecommerce platform (Shopify, Magento, …) will likely tell you a different story than Google Analytics Ecommerce.
You are not alone with this challenge. We receive many questions on this topic and also worked on some solutions to this. Especially in performance marketing we often rely on Google Analytics e-Commerce revenues. In particular when it comes to media optimisations.
We call this net revenue attribution.
The second topic, question I want to go into here is what we call net profit attribution. To get to net margin attribution we deduct the cost of the product from the retail price. Having this metric available for channel, campaign, keyword analysis is very useful.
So how to get there?
1. Streaming all your data into one place
Let’s start with net revenue attribution
Standard channels
With standard channels I mean:
| Google Ads | Facebook Ads | Bing Ads |
| LinkedIn Ads | TikTok Ads | AdRoll Ads |
| Criteo | RTB House | Twitter Ads |
| AppNexus | Google Display & Video 360 | Google Campaign Manager |
| Taboola | Outbrain | Shopify |
For any of these channels head to our platform and set up a trial (free for 30 days, more than enough to get insights).
Now for the remaining channels, which are not supported I recommend using a data sync via Google Sheets. Google Sheets is part of the table above.
In case you have too much data to fit into a Google Sheets file or have restrictions on using Google Sheets, I recommend using our API or Zapier.
API
Analytics and media data should all be covered in the standard channels. Let’s focus on how you can push updates to store transactions into our platform. The API documentation can be found here. You need to have your user name and API key ready.
Here a POST request to insert the net revenue from your ecommerce platform:
curl --location --request POST 'https://api.windsor.ai/<user name>/batch/<user name>_attribution/public/crm_conversions?api_key=<API key>' \ --header 'Content-Type: text/plain' \ --data-raw '[{ 'order_date': <date of transaction goes here (optional)>,
'crm_type': 'Transaction - Net Revenue','transaction_id': <Google Analytics Transaction ID>,
'net_revenue': <net revenue> }]'
You want to use that to create the record. To update a record after you created use the following:
curl --location --request PUT 'https://api.windsor.ai/<user name>/batch/<user name>_attribution/public/crm_conversions?api_key=<API key>&transaction_id=<Google Analytics Transaction ID>' \ --header 'Content-Type: text/plain' \ --data-raw '[{ 'order_date': <date of transaction goes here (optional)>,
'crm_type': 'Transaction - Net Revenue','transaction_id': <Google Analytics Transaction ID>,
'net_revenue': <net revenue> }]'
Zapier
This is the last option, which I recommend using only if the two above don’t work. Zapier charges by execution, which in our case is a row of data, so you better be careful. Especially when you have a lot of transactions.
We have a few pre configured Zaps which I list here:
Alternatively just go to the main Windsor.ai page in Zapier and start by creating two jobs. One for new orders from your ecommerce store and one for updates to existing orders (in case they get cancelled or modified).
That’s it. Now you have your net revenue attribution set up
Now let’s move on to net profit attribution
You basically follow the same set of instruction like the above but you would name the conversion type (crm_type in case you use the API) ‘Transactions – Net Margin’.
A request would look like this:
curl --location --request POST 'https://api.windsor.ai/<user name>/batch/<user name>_attribution/public/crm_conversions?api_key=<API key>' \ --header 'Content-Type: text/plain' \ --data-raw '[{ 'order_date': <date of transaction goes here (optional)>,
'crm_type': 'Transaction - Net Margin','transaction_id': <Google Analytics Transaction ID>,
'net_revenue': <net margin> }]'
2. Model the data and get your insights
Once you have your data connected your data you will need to wait for 8 hours for the data to appear in the dashboard.
In case you can’t wait for that long, drop us a message in the chat and we’ll make sure we’ll load your data immediately.
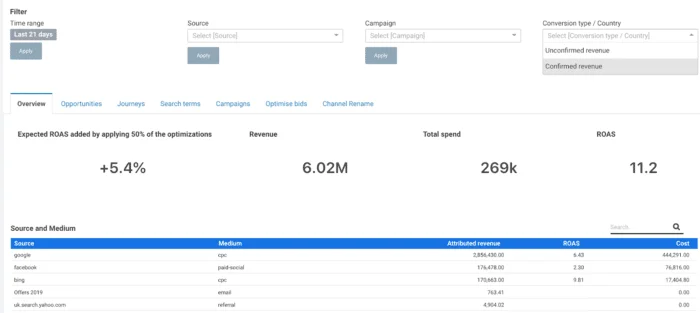
You will be able to see the new conversion types appearing in the following dropdown:

Now you can select what outcome you want to analyse your data set on.


