 AI insights
 About us
 Careers
 Security
 Customer reviews
 Contact us
 Affiliate program
 Solution partners
 Looker Studio templates
 Tableau templates
 Facebook Ads templates
 Google Ads templates
 Data fields & Metrics
 AI prompt library & Guides
 Product documentation
 API documentation
 Case studies
 Blog
Blog Data models
 Windsor vs Supermetrics
 Windsor vs Fivetran
 Windsor vs Portermetrics
Connect Wrike to Power BI
Quickly integrate Wrike with Power BI using Windsor.ai’s ETL connectors.
Our platform automates Wrike reporting, helping you analyze team activity and project data in detail, resolve issues faster, and improve project management.
Forget CSVs. Stop copy/paste. Connect data in 2 minutes. No code required.


Enhance project management with Wrike to Looker Studio integration
Connecting Wrike to Power BI with Windsor.ai centralizes your tasks, projects, and team activity for in-depth analysis, offering the following benefits:

Automate reporting
Automate reporting
Windsor.ai automatically syncs your key Wrike metrics into Power BI within a few minutes. Eliminate manual exports and always work with fresh, analysis-ready data.

Enhance collaboration
Enhance collaboration
Power BI’s dashboards are easy to share across marketing, finance, and operations teams, enhancing cross-department coordination and accelerating decision-making.

Increase efficiency
Increase efficiency
Analyze task progress, due dates, priorities, and responsibilities with Power BI’s visualizations. Spot delays, resolve issues quickly, and improve team efficiency to keep project execution on track.
Using Windsor.ai connector to import data from Wrike into Power BI
Integrating Wrike with Power BI can be complex, time-consuming, and expensive. Windsor.ai removes this complexity with a fast, fully no-code ELT connector designed for efficiency and scale.
In just a few clicks, our platform syncs Wrike with Power BI, giving teams a unified, real-time view of tasks, timelines, and project performance.

How to connect Wrike to Power BI in Windsor.ai
Windsor.ai supports two Power BI integration methods: Desktop and Web.
Follow our step-by-step guide and video tutorials to get started quickly.
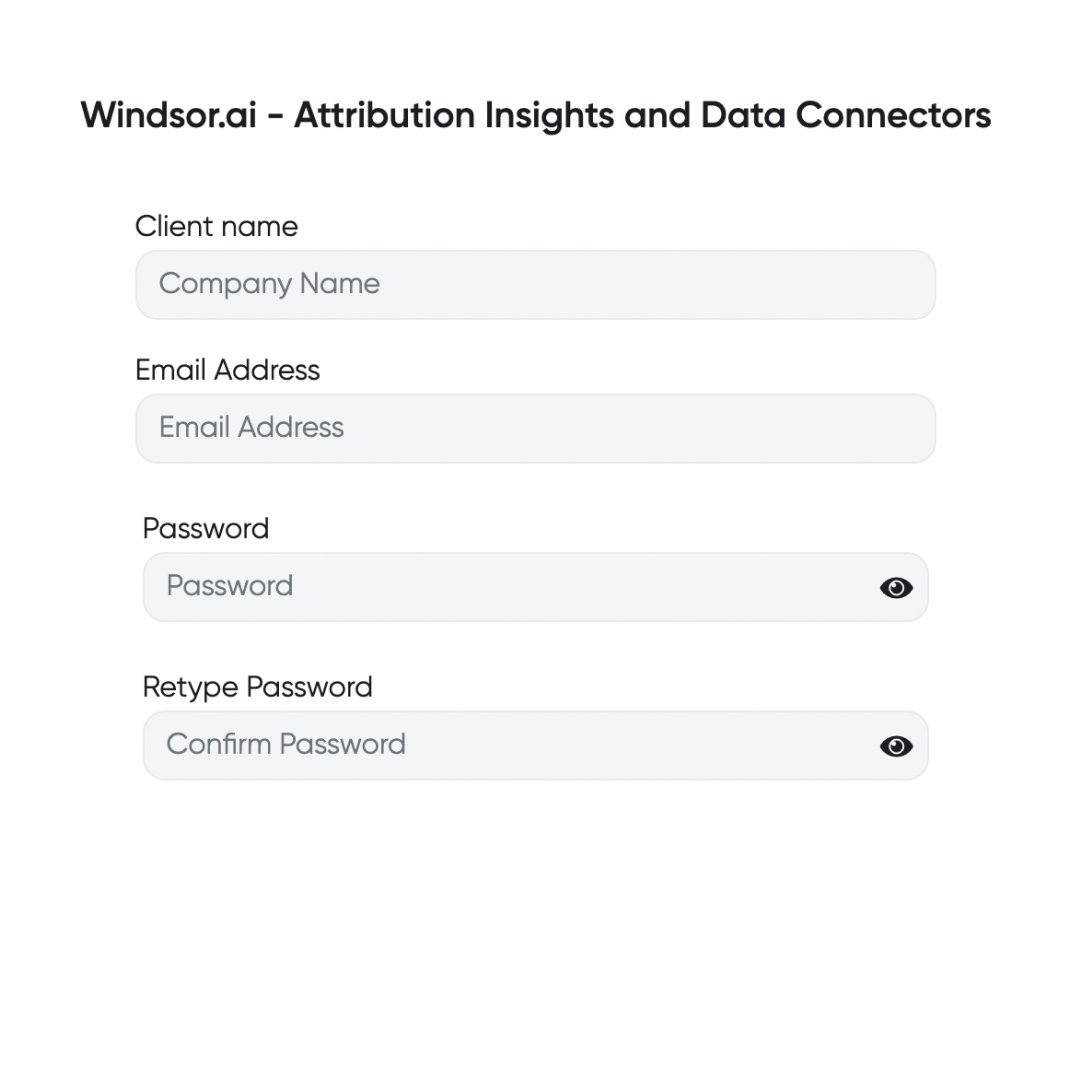
Register and log in to Windsor.ai
Create a new Windsor.ai account or log in if you already have one.
Select your data source
Choose Wrike as your data source and go to the Preview screen.

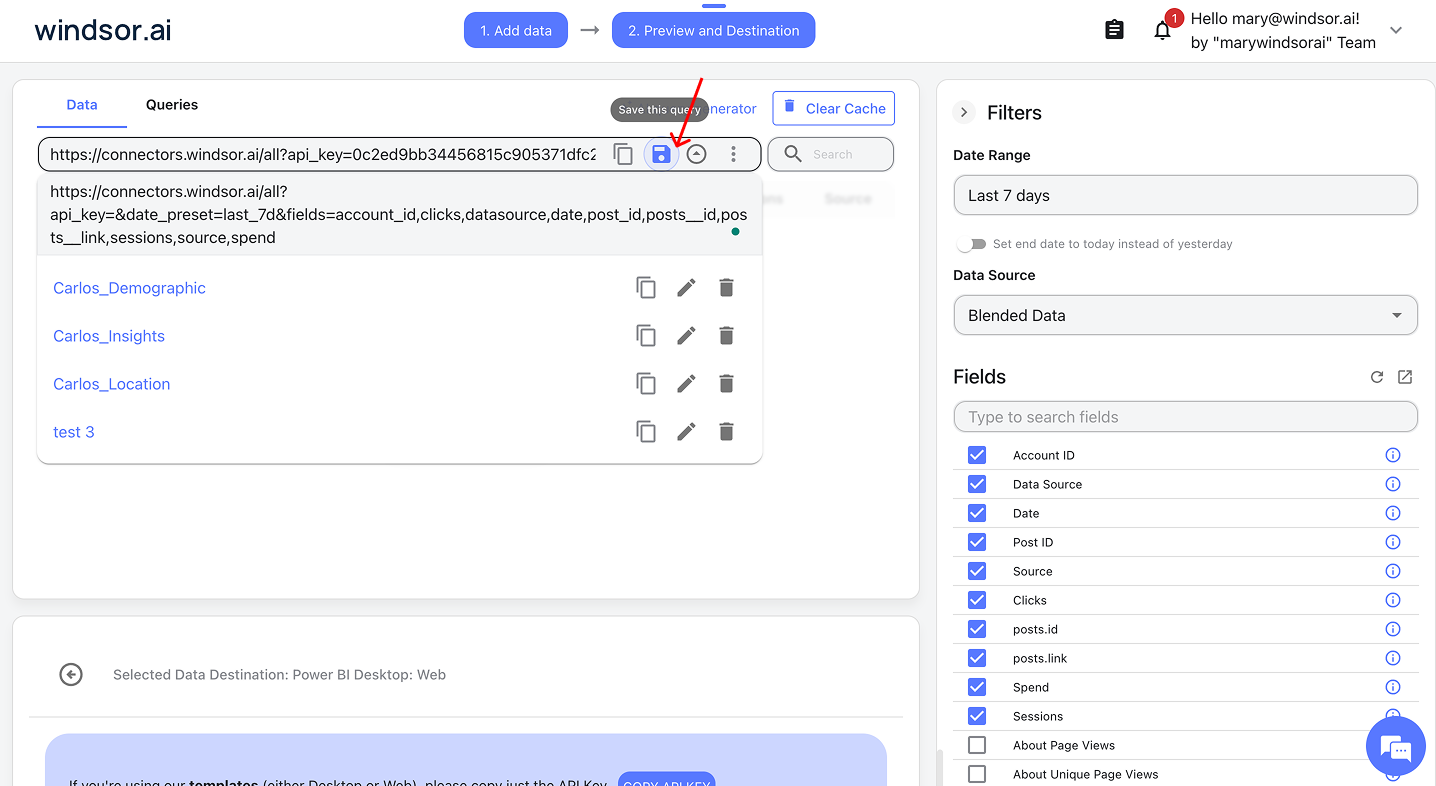
For Power BI Desktop: Save your query and select it in the app
- Save a query if you’re building a custom report in Power BI Desktop
- In Power BI Desktop, go to Get Data → Windsor → Sign in
- Select your saved query from Windsor and click Load
Video instructions: https://www.youtube.com/watch?v=Zf-3JYC1d1Q.
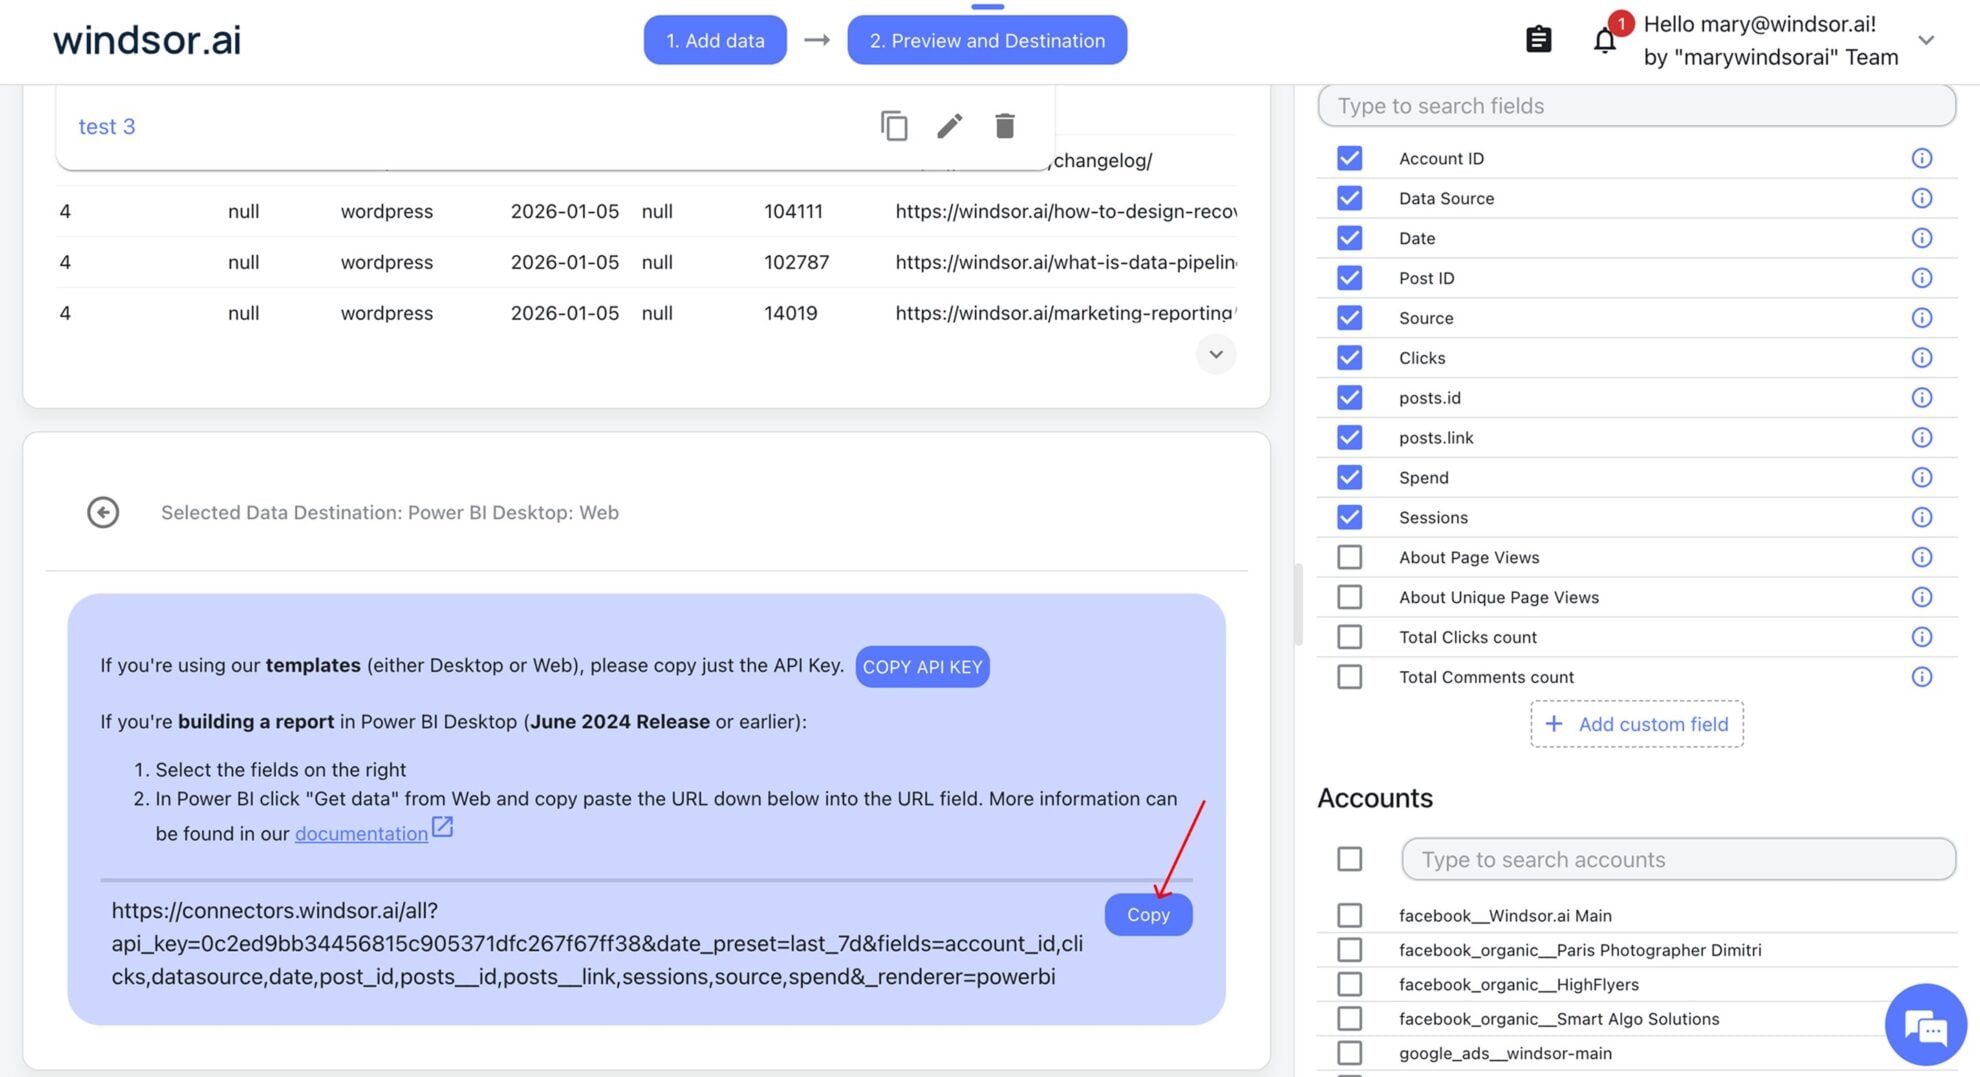
For Power BI Web: Copy your Windsor query URL
- Copy your query URL if you’re using Power BI Web
- In Power BI, go to Get Data → Web, paste your copied query URL, and click Ok
- Let the dashboard auto-load data
Video instructions: https://www.youtube.com/watch?v=L1NeAKUwqXk.
Build and refresh your report
Congratulations, you’ve connected your Wrike data to Power BI via Windsor.ai. Now, you can visualize it in the preferred way.

FAQs
What is Power BI?
Power BI is a popular analytics tool developed by Microsoft for small and large businesses alike. It provides software services, connectors, and apps that work collectively to convert data into easy-to-interpret reports and dashboards. The insights gained can then be used to enhance an organization’s decision-making processes. Power BI also allows users to connect to hundreds of data sources, visualize, and share reports with the relevant people.
Do you have helpful links to get started with integrating Wrike and using Windsor.ai?
Yes, we have helpful resources to help you get started. You can explore our official documentation and ready-to-use templates for seamless Wrike to Power BI integration with Windsor.ai:
How much time do I need to create the Wrike and Power BI integration?
Windsor.ai provides a user-friendly interface and a powerful data connector that enables you to integrate Wrike with Power BI in under 5 minutes, making the process quick and hassle-free.
How much does it cost to integrate Wrike into Power BI with Windsor.ai?
Windsor.ai’s pricing for Wrike into Power BI data integration can vary depending on your use case. We offer transparent pricing plans tailored to diverse business needs and budgets.
Tired of manual Wrike data exports? Try Windsor.ai today to automate your reporting

