Plotting Google Ads Using Python

Besides the services Google Ads Management offers, developers need to utilize easily accessible APIs to fetch data for third party applications. One of the platforms that offers such services is Windsor.ai. The main goal is to simplify the process of data collection through its platform, and in this case, an API which helps bring your ads into python.
In this tutorial, an introduction to creating a Windsor account followed by fetching and plotting data using python will be depicted. Moreover, what is best about this method is that there are no prerequisites to achieve the goal and that one does not really need to be a programmer to plot the data.
Access to Google Ads
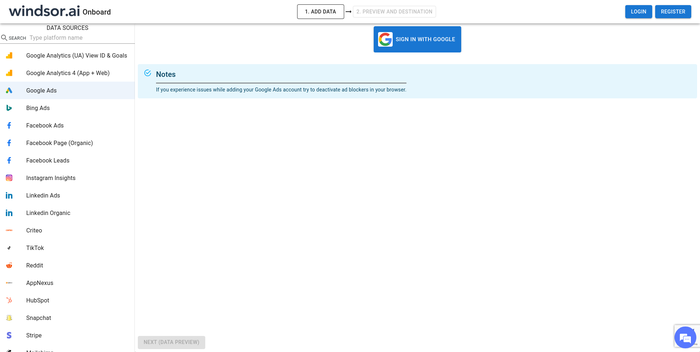
Firstly, let’s start by visiting https://onboard.windsor.ai/ and signing in with your Google Account. This will ensure that your Google Ads API will work with the new API.

Retrieve Access Token
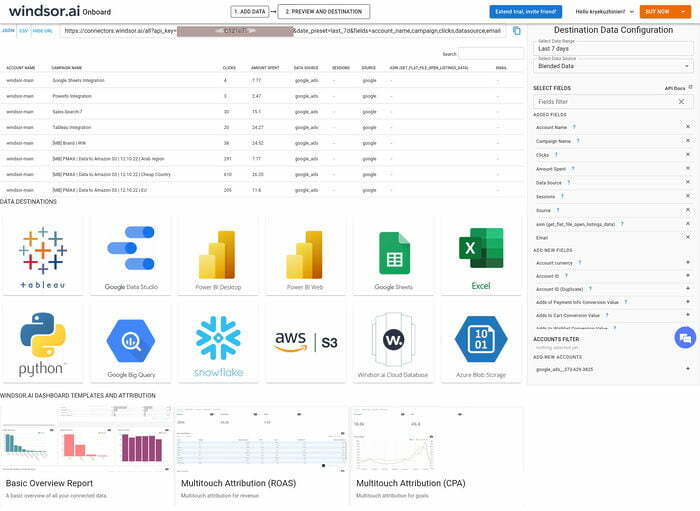
Next, copy the API Token provided in the query url as shown in the image below.

Fetching Google Ads Data
Further, we have access to the dataset and all we need to do is write the python codes to fetch the data into our application. In this tutorial, for simplicity reasons, I will be using the python package pandas. However, you do not need to install this package if you do not plan to do advanced data wrangling.
The packages needed to run the python code are: GoogleAdsWindsorApi, pandas, and plotly. If you do not have them installed, then you can run the following in a terminal:
pip install GoogleAdsWindsorApi pandas plotlyThen, we are ready to run our code. Firstly, make sure to import the libraries
from GoogleAdsWindsorApi.client import Client
import pandas as pd
import plotly.graph_objects as go
Once the libraries are loaded, the next step is to decide what data we want. For this tutorial, I will go ahead and select the last 7 days of data with columns such as account_name, campaign, clicks, datasource, email, source, spend. The full list of possible columns to select can be found in the following link https://windsor.ai/connector/google_ads/.
API_KEY = "your key"
client = Client(API_KEY) campaign_clicks = client.connectors(
    date_preset="last_7d",
    fields=[
        "account_name", "campaign,clicks", "datasource", "email", "source", "spend"
    ]
)
Lastly, getting the full dataset is a simple as running:
dataset = pd.DataFrame(campaign_clicks["data"])
dataset.head()
Which returns the following dataframe:
account_name 	campaign 	     clicks 	datasource 	email 	source spend
windsor-main 	Powerbi Integration  0 	        google 	        None 	google 	0.00
windsor-main 	Automate reporting   0          google 	        None 	google 	0.00
windsor-main 	google sheets  	     0 	        google 	        None 	google 	0.00
windsor-main 	Sales-Search-7 	     20 	google 	        None 	google 	8.28
windsor-main 	competitors 	     0 	        google 	        None 	google 	0.00
Plotting Data
Plotting the Google Ads data is a fairly trivial task too. To see the ratio between the number of clicks and the amount spent for each ad campaign, run the following lines:
fig = go.Figure(data=[
    go.Bar(name="Number of Clicks", x=dataset["campaign"], y=dataset["clicks"]),
    go.Bar(name="Amount Spent", x=dataset["campaign"], y=dataset["spend"])
])
fig.update_layout(barmode="group", width=1200)
fig.show()
This yields the graph below:

Conclusion
To sum up, Windsor provides the opportunity to use their own API without the need to go through the tedious process of obtaining a Google Ads API token. Moreover, this solution allows for integration of multiple ad platforms such as Google, Facebook, TikTok and more. For a full list of parameters for the Windsor API, please visit the connectors page: https://connectors.windsor.ai/.
Read also:
Connect Google Ads to Google Sheets
Connect Google Ads to Power BI
Google Ads Google Data Studio Connector
Connect Google Ads to BigQuery
Connect Google Ads to Snowflake
Free Google Ads Dashboard Templates


