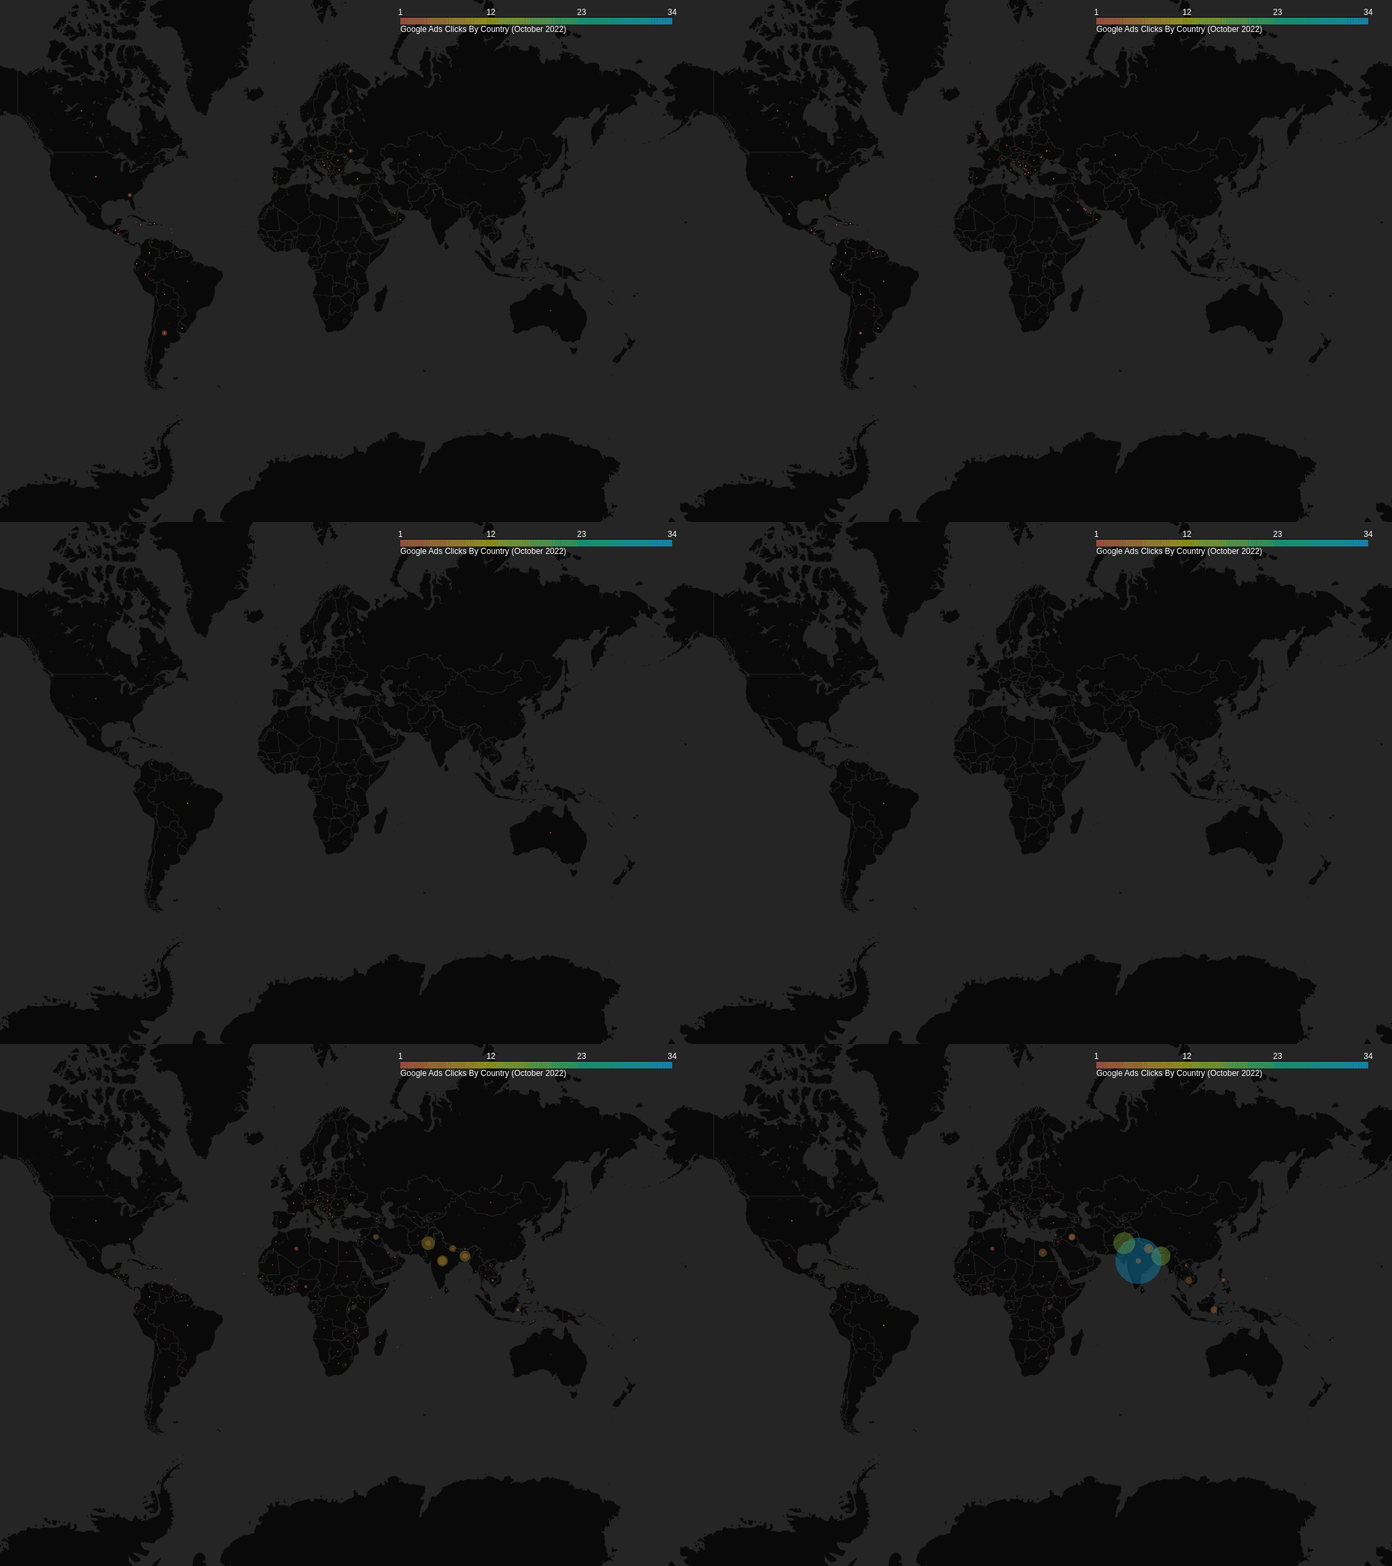
Creating an Animated World Map of Ad Impressions and Clicks

Sometimes you may want to share with your colleagues, friends, and family the achievements and successes your business has achieved. Despite the monetary aspect, success can be measured through the engagement people are having with your product. In this post, we will focus on building a world map of ad impressions, specifically, clicks to observe in which countries people visit the services we provide.
Prerequisites
There are three prerequisites for this project:
- Creating a free account to import various ad platforms into python. You can add the account by visiting the following page: Windsor Onboarding.
- Installing chromium or firefox drivers for selenium.
- Cloning the following GitHub repository whose modules we will be using: Code Repository
Ad Impressions and Clicks
Running the code is pretty simple. Firstly, install the dependencies in the requirements.txt file. You can do that by running pip install -r requirements.txt. Next, you can either use your own dataset or fetch the data directly into python using Windsor’s token. The dataset used here are Google Ads with column information such as date, country, source, campaign, and clicks. The important data here are date (time-series), country name, and clicks (numeric values). You can fetch similar data by running
import pandas as pd
from pywindsorai.client import Client


client = Client(api_key="your-token-key")
request = client.connectors(
    date_from="2022-10-01",
    date_to="2022-11-01",
    fields=["date", "country", "source", "campaign", "clicks"],
    connector="google_ads"
)
dataset = pd.DataFrame(request["data"])
If you already have your dataset, you can read it as a csv file too. Then you can generate latitude and longitude by
from map_converter import Map
# Create map
generator = Map()
# If dataset does not have latitude and longitude, find them.
dataset = generator.get_lat_long(dataset, location_column="country")
Lastly, create an animated html file and save it as gif.
 # Create HTML map
generator.create_map(
    data=dataset,
    caption="Google Ads Clicks By Country (October 2022)",
    normalize=True
)
# Convert map to gif.
generator.to_gif(driver_option="Chrome", duration=500)
Result
The final products are an HTML file and a gif image which can be found in the same working environment of the code.
Implementation
The implementation is done by using Folium and TimestampedGeoJson maps. The file is saved as html using default folium methods. However, the conversion from html to gif is done using Selenium. Make sure that you have your Google or Firefox drivers installed. You can install them by using apt install chromium-chromedriver or apt-get install firefox-geckodriver. This works by opening a browser tab (in hidden state) and taking multiple screenshots of the html. The file png files then are converted to a single gif image.


