 AI insights
 About us
 Careers
 Security
 Customer reviews
 Contact us
 Affiliate program
 Solution partners
 Looker Studio templates
 Tableau templates
 Facebook Ads templates
 Google Ads templates
 Data fields & Metrics
 AI prompt library & Guides
 Product documentation
 API documentation
 Case studies
 Blog
Blog Data models
 Windsor vs Supermetrics
 Windsor vs Fivetran
 Windsor vs Portermetrics
 Last updated: 8 June 2026

One of the most common problems with Amazon Ads is not that you don’t have enough data. It’s that you have too much of it.
Hidden deep within your Amazon Seller Central account, buried under layers of Campaign Manager tabs and Bulk Operations files, is the secret to your next 20% growth. But right now, that secret is trapped in a spreadsheet you don’t have time to open.
Most advertisers spend their weeks playing data janitor. They download, they filter, they pivot. Then they manually look for the leaks, such as the ASINs bleeding budget, the bidding wars they can’t win, and the high-ACOS campaigns that are quietly eating their profit.
What if you could get instant AI analysis across your entire Amazon Ads account, along with actionable insights and recommended next steps?
By automatically connecting Amazon Ads to Claude via the Windsor MCP, you stop being a data entry clerk and start being a strategist.
🚀 Start for free at Windsor.ai and build your first Amazon Ads to Claude integration right now.
You can audit your entire business through natural language and generate clear, visual reports like this one in just seconds.
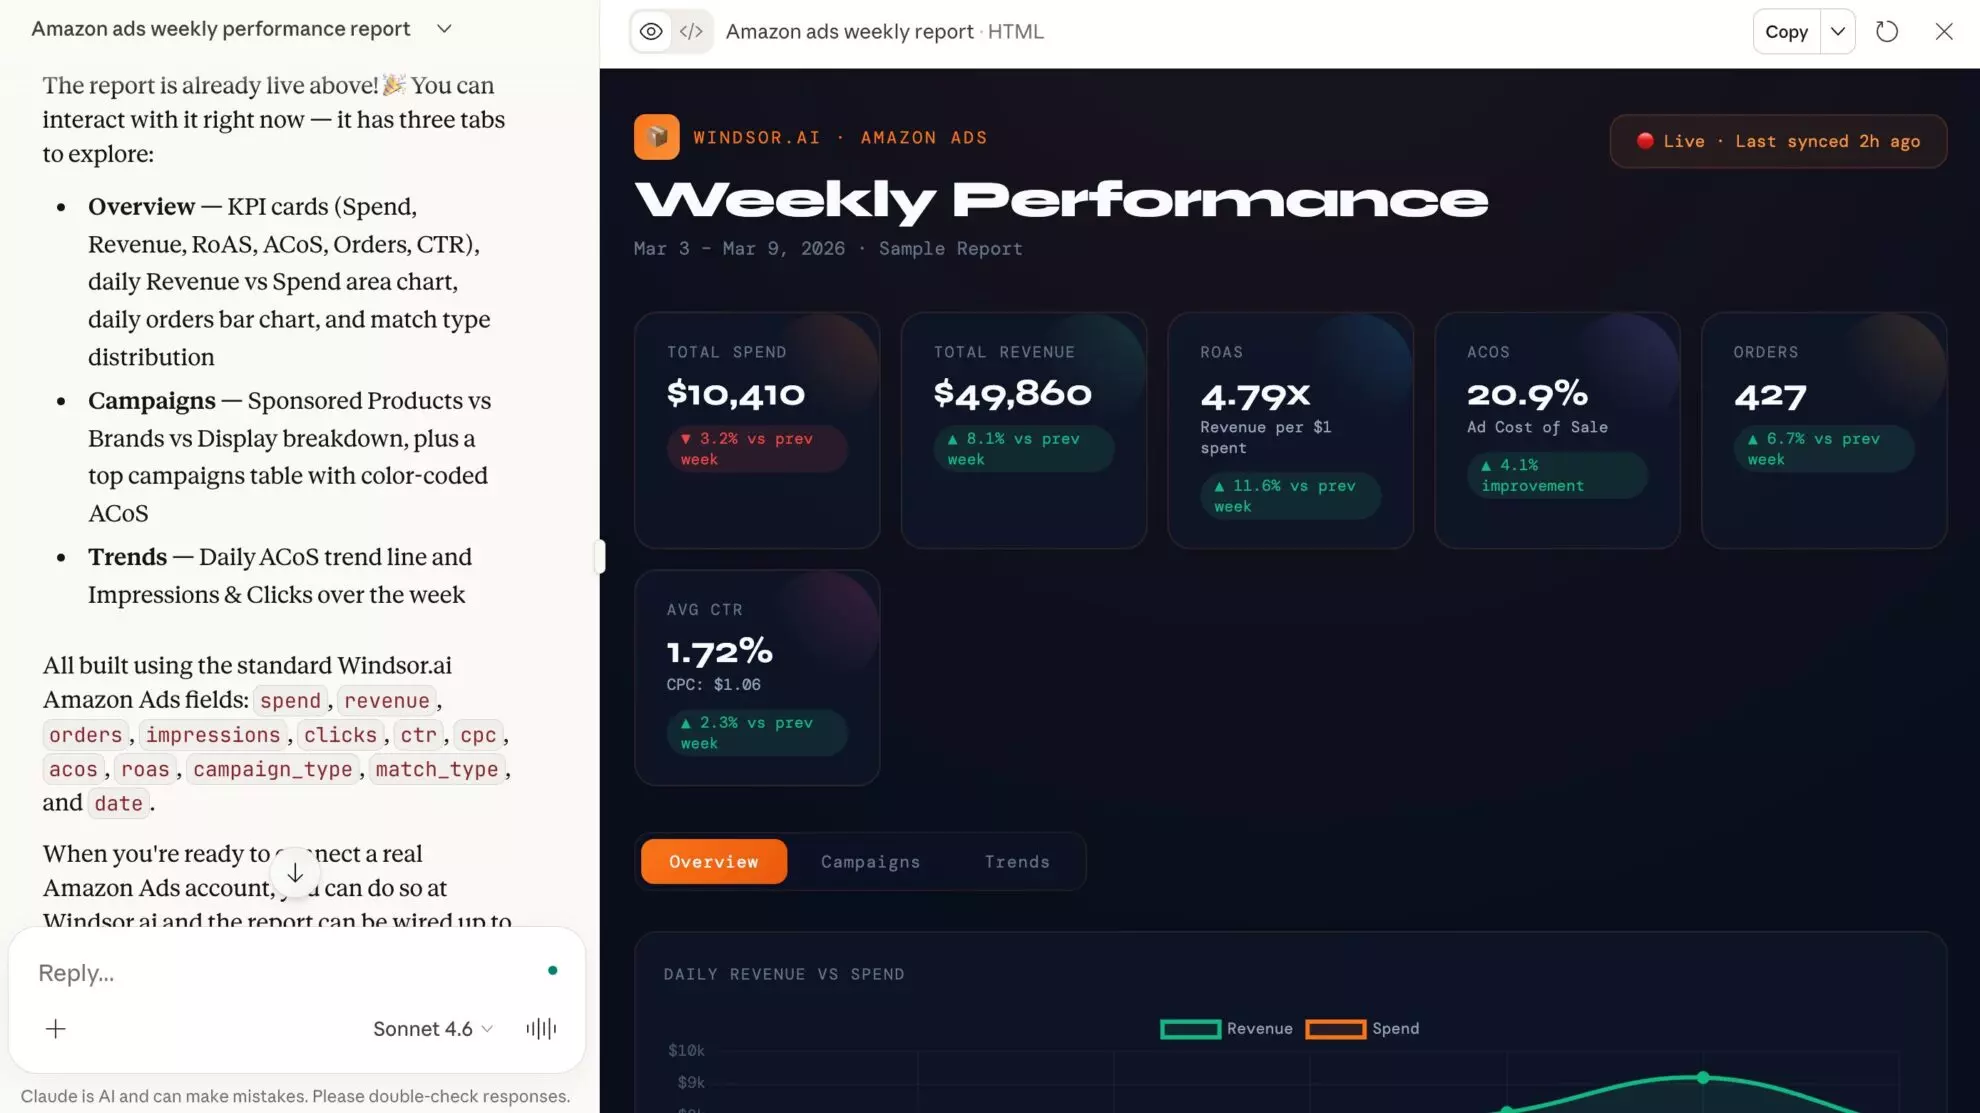
With Amazon Ads to Claude integration, you can simply ask:
- “Which products have a high Click-Through Rate but a conversion rate below my break-even point?”
- “Which seasonal campaigns should I kill based on the last 14 days of SKU-level profit?”
- “Claude, find the ‘attribution gap’—which auto-campaigns are cannibalizing my organic sales?”
Claude doesn’t just read numbers; it understands your brand context. In moments, it surfaces optimization levers you’d normally spend hours hunting for manually.
Stop digging through spreadsheets and start making winning decisions. Here’s how Windsor.ai bridges the gap between raw data and impactful insights in under a minute.
The 60-second setup to connect Amazon Ads to Claude via Windsor MCP
Just three super simple steps. No code. No developer needed.
1. Go to onboard.windsor.ai and select Amazon Ads as your data source.
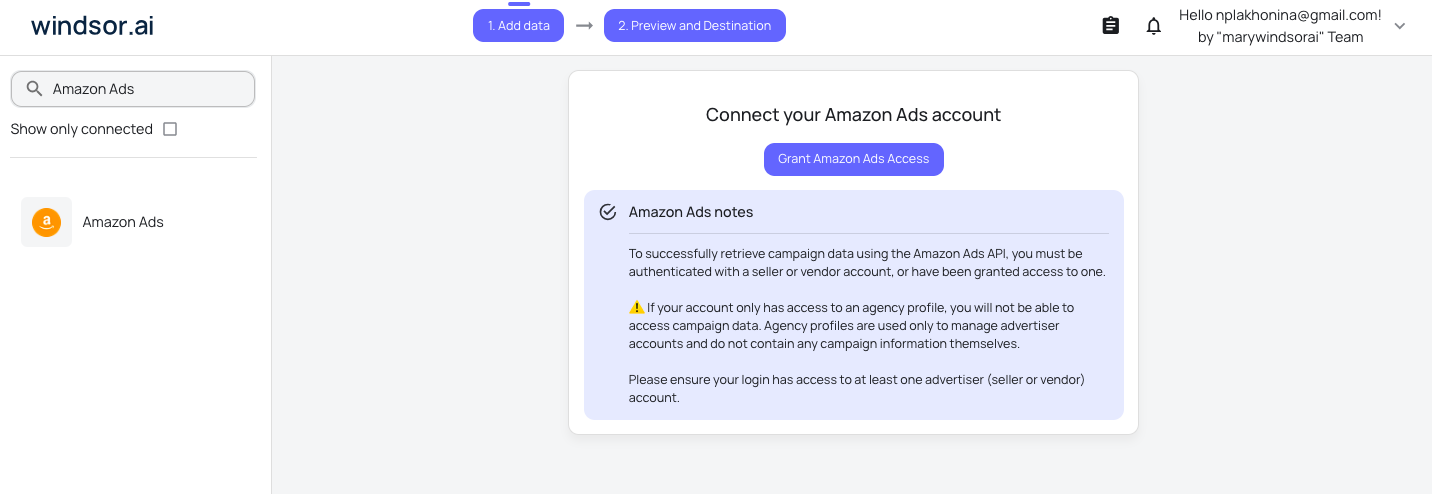
2. Connect your Amazon Advertising account via the standard OAuth flow.
3. In Claude, open the Windsor.ai connector and click Connect.
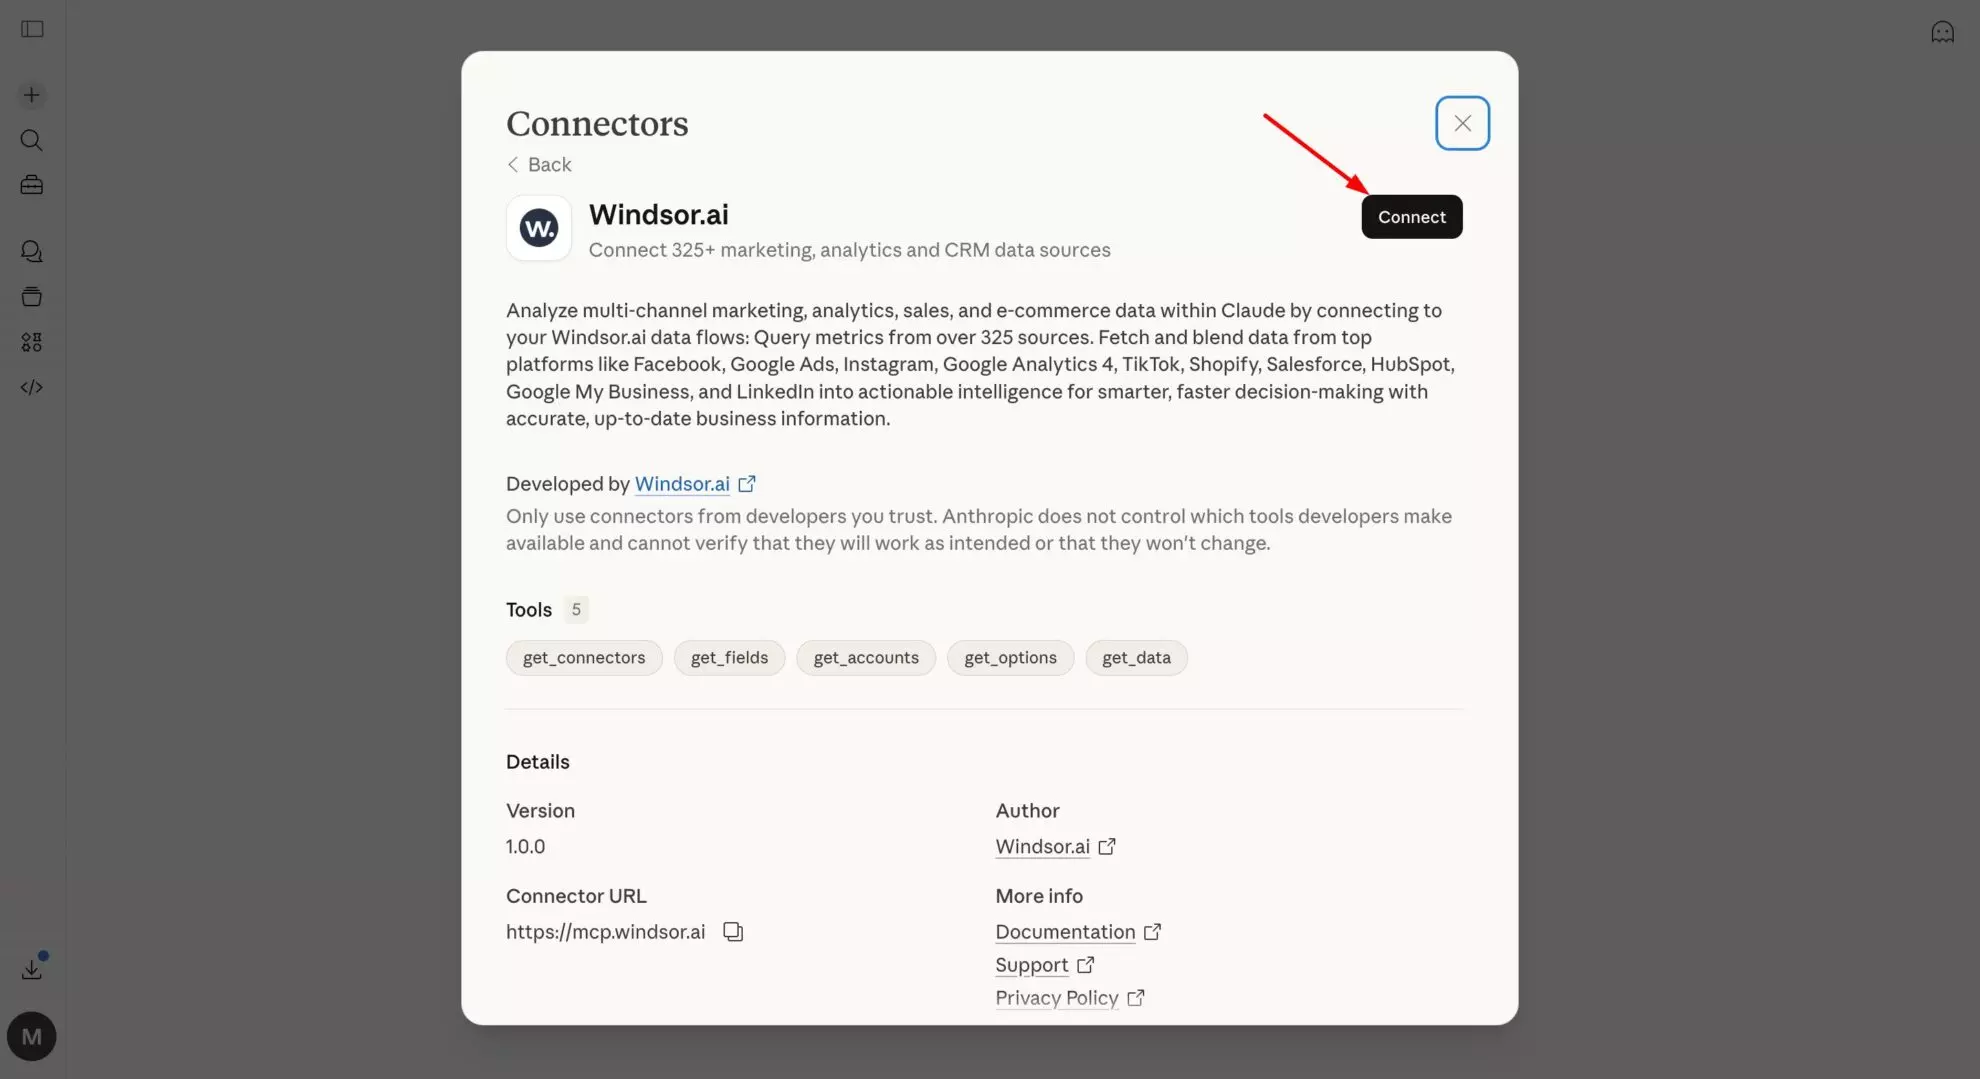
That’s it. Your Amazon Ads data is now live inside every Claude conversation and ready for automated reporting and analysis.
📖 Full guide: windsor.ai/documentation/windsor-mcp/how-to-integrate-data-into-claude/.
What to ask Claude about your data: Amazon Ads analytics prompt ideas
There’s a lot you can do with your Amazon Ads data in Claude—whether it’s generating a simple weekly performance report or tackling more advanced campaign-level analysis across all ad types, without exporting CSVs or stitching data manually.
Feel free to copy and paste these prompts directly into your Claude chat to get started immediately.
💡 These analyses are based on campaign-level advertising data. More advanced use cases (e.g., product-level profitability, organic impact, or targeting analysis) require additional data sources such as Amazon Seller Central or product-level datasets.
1. Identify wasted spend at the campaign level
Find campaigns that are spending heavily but not generating efficient returns.
Prompt:
Analyze my Amazon Ads account for wasted spend over the last 30 days.

Account: [ACCOUNT_ID]
Target ACOS: [YOUR_TARGET — e.g. 25%]

Pull all active campaigns ranked by spend descending.

For each, show: spend, sales, ROAS, ACOS, orders, clicks, CTR, CVR, and CPC.

Classify each campaign into one of three categories:
- "Efficient" — ACOS below target and CVR above 5%
- "Low engagement" — CTR below 0.3%, high impressions but few clicks (traffic is being shown but not attracting attention — likely a targeting, creative, or bid relevance issue)
- "Poor conversion" — CTR is acceptable but CVR is below 5% (clicks are coming in but shoppers aren't buying — likely a listing quality, price, review, or landing page issue)

For each flagged campaign:
- Show its share of total account spend
- Calculate the revenue lost vs what it would generate at target ACOS
- Identify whether the waste is concentrated in specific ad groups, keywords, or match types if the data allows Produce a ranked waste report — highest-spend inefficient campaigns first

End with a plain-language summary of the top 3 budget leaks and what type of fix each one requires.
2. Track performance trends over time
Understand whether your performance is improving or declining.
Prompt:
Show my Amazon Ads performance trends week by week over the last 30 days.

Account: [ACCOUNT_ID]

Pull weekly totals for:
spend, sales, orders, ROAS, ACOS, CTR, CVR, and CPC — broken down by campaign.

Then identify:

1. Declining campaigns
- Flag any campaign where ROAS dropped more than 15% week over week for two or more consecutive weeks.
For each, note whether the decline is driven by rising CPC (more expensive traffic), falling CVR (weaker conversion), or falling CTR (reduced engagement) — each points to a different root cause.

2. Improving campaigns
- Flag any campaign where ROAS improved more than 10% week over week for two or more consecutive weeks.
Note what changed: did spend decrease while sales held, or did CVR genuinely improve?

3. Anomalies
- Flag any single week where spend, sales, or orders spiked or dropped more than 30% vs the prior week.
Cross-reference with any known promotions or seasonal events.

Output a week-by-week table per campaign, a trend classification for each (improving / stable / declining / anomaly), and a 3–5 sentence summary of the overall account direction.
3. Compare campaign types (SP vs SB)
Evaluate which ad formats are actually working best.
Prompt:
Compare performance across Amazon Ads campaign types over the last 30 days.

Account: [ACCOUNT_ID]
Target ACOS: [YOUR_TARGET]

Pull spend, sales, orders, ROAS, ACOS, CTR, CVR, and CPC grouped by campaign type (Sponsored Products, Sponsored Brands).

For each campaign type, calculate:
- Share of total account spend (%)
- Revenue contribution (% of total sales)
- Efficiency vs target ACOS (above / at / below target)
- Scale potential: total impressions vs share won (CTR × impressions)

Classify each type as:
- "Core performer" — highest revenue volume at or below target ACOS
- "Scale candidate" — below target ACOS but small spend share
- "Efficiency problem" — above target ACOS with significant spend
- "Awareness play" — high impressions, low CVR by design

For the weakest campaign type, suggest 5 specific actions based on its diagnosis — distinguishing between bid, targeting, creative, and structural fixes.

Output a side-by-side comparison table and a strategic recommendation for how to rebalance spend across campaign types.
4. Budget allocation optimization
Spot where the budget should be increased or reduced.
Prompt:
Audit budget allocation across my Amazon Ads campaigns over the last 14 days.

Account: [ACCOUNT_ID]
Target ACOS: [YOUR_TARGET]

Pull spend, sales, ROAS, ACOS, orders, CTR, and CVR for all active campaigns, sorted by spend descending.

Segment campaigns into four groups:

1. Scale opportunities
- ACOS below target AND daily spend consistently below daily budget cap.
Estimate additional weekly revenue if budget were increased by 20%, 50%, and 100%.

2. Budget waste
- ACOS above target by more than 20% AND high absolute spend.
Calculate the weekly overspend vs what they would have spent at target ACOS. Rank by total overspend.

3. Budget-limited but unproven
- Campaigns hitting budget cap but fewer than 50 orders in the period.
Flag as "needs evaluation before scaling."

4. Efficient and stable
- At or below target ACOS with room in daily budget. No immediate action required.

Output a reallocation table showing: current spend, recommended spend, estimated revenue impact, and priority action for each campaign.
Include a total budget redistribution summary showing how much to move and from where to where.
5. New-to-brand performance analysis (where available)
Measure how well your campaigns acquire new customers.
Prompt:
Analyze new customer acquisition performance across my Amazon Ads campaigns over the last 30 days.

Account: [ACCOUNT_ID]

Pull new_to_brand_orders, new_to_brand_sales, and new_to_brand_order_rate alongside total orders, total sales, spend, ROAS, and ACOS for all campaigns where new-to-brand data is available (Sponsored Products and Sponsored Brands only — Amazon does not report new-to-brand metrics for Sponsored Display campaigns).

For each eligible campaign:
- Calculate new-to-brand order rate (% of orders from new customers)
- Calculate new-to-brand revenue share (% of sales from new customers)
- Calculate cost per new customer = spend ÷ new_to_brand_orders
- Compare ACOS on new-to-brand sales vs overall ACOS

Classify campaigns as:
- "Strong acquisition" — new-to-brand order rate above 50%
- "Retention-heavy" — new-to-brand order rate below 25%
- "Mixed" — 25–50% new-to-brand order rate

Highlight the top 3 campaigns by new_to_brand_orders and flag any high-spend campaigns where new-to-brand rate is below 20%.

Output a ranked table and a 3–5 sentence summary of acquisition health across the account.
6. Funnel analysis (impressions → clicks → conversions)
Understand where performance drops off.
Prompt:
Build a full funnel performance view for all Amazon Ads campaigns over the last 30 days.

Account: [ACCOUNT_ID]

Pull the following funnel stages for each campaign:
- Impressions (visibility)
- Clicks (engagement — CTR = clicks ÷ impressions)
- Orders (conversion — CVR = orders ÷ clicks)
- Sales (value — ACOS = spend ÷ sales)

For Sponsored Display campaigns, also pull:
- Detail Page Views (DPV)
- Add to Cart

For each campaign, calculate all step-to-step drop-off rates and classify the primary bottleneck:
- "Visibility gap" — impressions are low relative to budget
- "Engagement gap" — CTR below 0.3%, impressions high but clicks low
- "Conversion gap" — CVR below 5%, clicks healthy but orders low
- "Value gap" — orders reasonable but ACOS above target

Produce a funnel table with one row per campaign showing all metrics and a diagnosis label.
End with a prioritized list of the top 5 campaigns by estimated revenue recovery potential if the bottleneck were resolved.
7. Cost efficiency diagnostics
Break down why some campaigns are expensive.
Prompt:
Diagnose cost efficiency problems across my Amazon Ads campaigns over the last 30 days.

Account: [ACCOUNT_ID]
Target CPC: [YOUR_TARGET or "derive from account average"]
Target CVR: [YOUR_TARGET — e.g. 8%]

Pull spend, clicks, orders, sales, CPC, CTR, CVR, ACOS, and ROAS for all active campaigns, sorted by CPC descending.

For each campaign, determine whether high cost is driven by:

1. Expensive traffic — CPC more than 50% above account average.
Likely cause: over-bidding on competitive or broad match terms

2. Poor conversion — CVR more than 40% below account average despite acceptable CPC.
Likely cause: listing, pricing, or weak product-market fit for targeted keywords

3. Both — CPC above average AND CVR below average.
Most urgent: paying more to attract clicks that don't convert

For each flagged campaign, estimate the ACOS improvement achievable by:
- Reducing CPC to account average (holding CVR constant)
- Improving CVR to account average (holding CPC constant)
- Achieving both simultaneously

Output a diagnostic table and rank campaigns by total efficiency recovery potential (gap between current ACOS and target ACOS multiplied by spend).
8. Marketplace or account-level comparisons
Compare performance across regions or accounts.
Prompt:
Compare Amazon Ads performance across marketplaces over the last 30 days.

Accounts: [LIST ALL ACCOUNT IDs]

Pull spend, sales, orders, ROAS, ACOS, CTR, CVR, and CPC grouped by marketplace (country name). Include all active campaigns.

For each marketplace:
- Calculate its share of total account spend and total revenue
- Flag whether it is above, at, or below target ACOS
- Compare ROAS across markets

Rank marketplaces on two dimensions:
1. Efficiency (ROAS / ACOS) — most return per dollar spent
2. Scale (absolute sales volume) — most total revenue

Identify:
- High efficiency + low scale = underinvested, scaling opportunity
- Low efficiency + high scale = over-invested, needs restructuring
- Low efficiency + low scale = review whether investment is justified

For the bottom 2 markets by ROAS, suggest 3 specific optimization steps distinguishing between bid strategy, product selection, and targeting structure issues.

Output a marketplace comparison table and a capital allocation recommendation ranked by expected revenue impact.
9. Executive performance summary
Generate a clean report for stakeholders or clients.
Prompt:
Create a comprehensive Amazon Ads performance summary for the last 30 days.

Account: [ACCOUNT_ID]
Target ACOS: [YOUR_TARGET]
Reporting to: [CLIENT NAME / INTERNAL STAKEHOLDERS]

Pull spend, sales, orders, ROAS, ACOS, CTR, CVR, and CPC at the account level and for all active campaigns.

Structure the report as follows:

1. Account scorecard
- Total spend, sales, orders, ROAS, and ACOS for the period.
- Compare to the prior 30 days and show % change for each metric.
- Flag whether overall efficiency improved or declined.

2. Campaign type breakdown
- Split by Sponsored Products, Sponsored Brands, and Sponsored Display.
- Show spend share, revenue share, and ACOS for each.

3. Top 5 campaigns by revenue
- Spend, sales, orders, ROAS, ACOS, CVR, and vs prior period change.

4. Bottom 5 campaigns by ROAS (minimum $100 spend)
- Spend, sales, ROAS, ACOS, and primary diagnosis (engagement gap / conversion gap / value gap).

5. Key insights
- 3–5 specific findings referencing actual numbers and campaign names.
No generic observations.

6. Recommended next actions
- 3–5 prioritized actions distinguishing quick wins (bid adjustments, budget shifts) from structural changes (restructuring, negatives).

Output in a clean visual format suitable for stakeholder review.
Use plain language — define any Amazon-specific terms used.
The Amazon Ads fields Windsor sends to Claude
While Windsor.ai supports hundreds of attributes, these core metrics and dimensions are the ones that drive 90% of high-level strategic audits. They allow Claude to see past the surface level of your account.
🔍 Explore the full list at windsor.ai/data-field/amazon_ads/.
Performance & efficiency metrics
These metrics allow Claude to calculate your actual profitability and identify budget leaks across different attribution windows:
-
totalcost: The total advertising spend (also available ascostorspend). -
sponsored_products_campaign__attributedsales14d: The aggregate value of sales occurring within 14 days of an ad click (Windsor also supports 1d, 7d, and 30d windows). -
sponsored_products_campaign__acos: Pre-calculated Total Advertising Cost of Sales. -
sponsored_products_campaign__roas: Total return on advertising spend (Revenue divided by Cost). -
clicks&impressions: The raw traffic data used to audit reach and engagement levels.
Strategic dimensions
These dimensions allow Claude to “slice and dice” your account to find the root cause of performance shifts:
-
ad_type: Differentiates performance between Sponsored Products, Sponsored Brands, and Sponsored Display. -
marketplace: The specific Amazon marketplace (e.g., USA, UK, Germany) for global account auditing. -
sponsored_products_campaign__campaign: The specific campaign name Claude uses to group data by your internal strategy. -
sponsored_products_campaign__campaign_status: Identifies whether a campaign is currently active or paused.
New-to-brand (NTB) metrics
For Sponsored Brands and Display, Windsor provides specialized fields to track growth beyond your existing customer base:
-
sponsored_brands_campaign_non_video__attributedordersnewtobrand14d: The number of first-time orders for products within your brand. -
sponsored_brands_campaign_non_video__attributedorderratenewtobrand14d: The efficiency of your brand-building efforts relative to clicks.
Conclusion
Amazon Ads rewards precision. Small accounts can get away with loose management. At scale, when you’re running SP, SB, and SD across hundreds of ASINs, the difference between a 25% ACOS and a 35% ACOS is not a bidding strategy. It’s the quality of your analysis.
Most teams are doing that analysis in spreadsheets, once a week, with data that’s already 48 hours stale by the time someone looks at it.
Windsor MCP gives Claude a live window into your Amazon Ads account. Not a snapshot. Not an export. The actual data, right now. Ask a question, get an answer. Ask a follow-up, get another. Keep asking until you know exactly where to move the budget and why.
🚀 Connect Amazon Ads to Claude — get started for free: https://onboard.windsor.ai/app/amazon_ads.
FAQs
What’s the fastest way to get Amazon Ads data into Claude?
Windsor MCP. 60-second setup at onboard.windsor.ai, and your data is live permanently. The alternative is downloading bulk reports from Seller Central, cleaning them, and uploading to Claude, which gives you a flat file that’s stale before you’ve finished the analysis, with no ability to cross-reference campaign data against search term data without manual joins. There’s also no comparison.
What are the main ways to connect Amazon Ads to Claude?
- Windsor MCP (recommended): No-code, live API connection. SP, SB, and SD all included. Supports multi-account setups. Cross-source blending with Seller Central, Shopify, and 345+ other sources. 60-second setup.
- Manual bulk report downloads: Download individual campaign, search term, or placement reports from Seller Central and upload to Claude. Works for isolated questions. Falls apart for anything that requires joining multiple reports or seeing current data.
- Amazon Advertising API (direct): Full programmatic access. Requires developer resources, API credentials, Amazon’s specific report request-and-poll flow, and ongoing maintenance. The right choice if you’re building a custom analytics product — not if you just want to ask Claude why your ACOS went up this week.
Which Amazon Ads campaign types does Windsor support?
All three: Sponsored Products (SP), Sponsored Brands (SB), and Sponsored Display (SD). You can query them individually or compare across types in a single Claude prompt. For example, comparing ACOS across SP and SB for the same ASIN to understand which campaign type is more efficient for each product.
Can Claude see my search term report data, not just keyword data?
Yes, and this is one of the most valuable things Windsor unlocks. The search_term field gives Claude access to the actual customer queries triggering your ads, with spend, orders, ACOS, and match type for each. This makes zero-conversion spend audits, cannibalisation analysis, and negative keyword identification all possible from a single conversational prompt.
Does Windsor support Amazon Seller Central data alongside Amazon Ads?
Yes. Windsor connects to both Amazon Ads and Amazon Seller Central (Amazon SP). Having both blended in Claude is what enables TACOS calculation, BSR-to-spend correlation, and margin-adjusted ACOS analysis — the three analyses most teams want but can’t do easily because the data lives in two separate places.
Can I manage multiple Amazon Ads accounts via Windsor MCP (e.g. for an agency)?
Yes. Windsor supports multi-account setups. For agencies managing multiple brand accounts, you can connect all accounts in Windsor and ask Claude to compare performance across them, flag anomalies in any account, or roll up spend and ACOS across your full portfolio.
Does Windsor pull attribution window data separately?
Yes. Amazon Ads offers 1-day, 7-day, 14-day, and 30-day attribution windows. Windsor can pull attributed sales by window, which matters significantly for fast-reorder categories (where 1-day attribution is more accurate) vs. considered purchases (where 14 or 30-day attribution is more representative). Knowing which window your ACOS figures are based on is critical for meaningful analysis.
Is it secure to connect Amazon Ads to ChatGPT with Windsor.ai?
Yes. Windsor.ai connects to Amazon Ads using secure API authentication and encrypted data transfer. Your data is only used to power analysis inside ChatGPT, while access to your Amazon Ads account remains fully under your control.

