 AI insights
 About us
 Careers
 Security
 Customer reviews
 Contact us
 Affiliate program
 Solution partners
 Looker Studio templates
 Tableau templates
 Facebook Ads templates
 Google Ads templates
 Data fields & Metrics
 AI prompt library & Guides
 Product documentation
 API documentation
 Case studies
 Blog
Blog Data models
 Windsor vs Supermetrics
 Windsor vs Fivetran
 Windsor vs Portermetrics
 Last updated: 29 June 2026

Amazon shows you revenue. But doesn’t show you profit—what’s left after FBA fees, referral fees, storage costs, returns, and ad spend.
Those costs quietly eat into your margins, so a top-selling ASIN isn’t always a profitable one. Seller Central tracks all of this, yet it doesn’t explain what really matters or how profitable your products actually are.
Windsor.ai brings your Amazon Seller Central data into ChatGPT, so you can ask direct questions and get instant answers about your store’s profitability, inventory risks, and performance.
🚀 Connect Amazon Seller Central to ChatGPT with Windsor’s native app. Start for free → onboard.windsor.ai/app/amazon-sp.
With your store data in ChatGPT, you can easily uncover deep insights like:
- Which ASINs generate strong revenue but have thin or negative margins after fees
- Which SKUs will run out of stock in the next 2 weeks at the current sell-through rate
- Which high-traffic listings underperform on conversion, and whether pricing, reviews, or content is the issue
- Which product categories have return rates above 10%, and what’s driving them
This guide shows how to connect Amazon Seller Central to ChatGPT with Windsor.ai in just two simple steps and start analyzing your store data with AI in minutes.
How to automatically connect Amazon Seller Central to ChatGPT with Windsor.ai
Windsor.ai streams your Amazon data into ChatGPT via a native connector. Set it up once in under a minute and continuously analyze your store data with AI—no manual exports or updates needed.
📖 Full documentation: windsor.ai/documentation/windsor-mcp/how-to-integrate-data-into-chatgpt/.
What you need before starting
- An Amazon Seller Central account (any marketplace: US, UK, EU, etc.)
- A Windsor.ai account (free or paid plan)
- A ChatGPT account
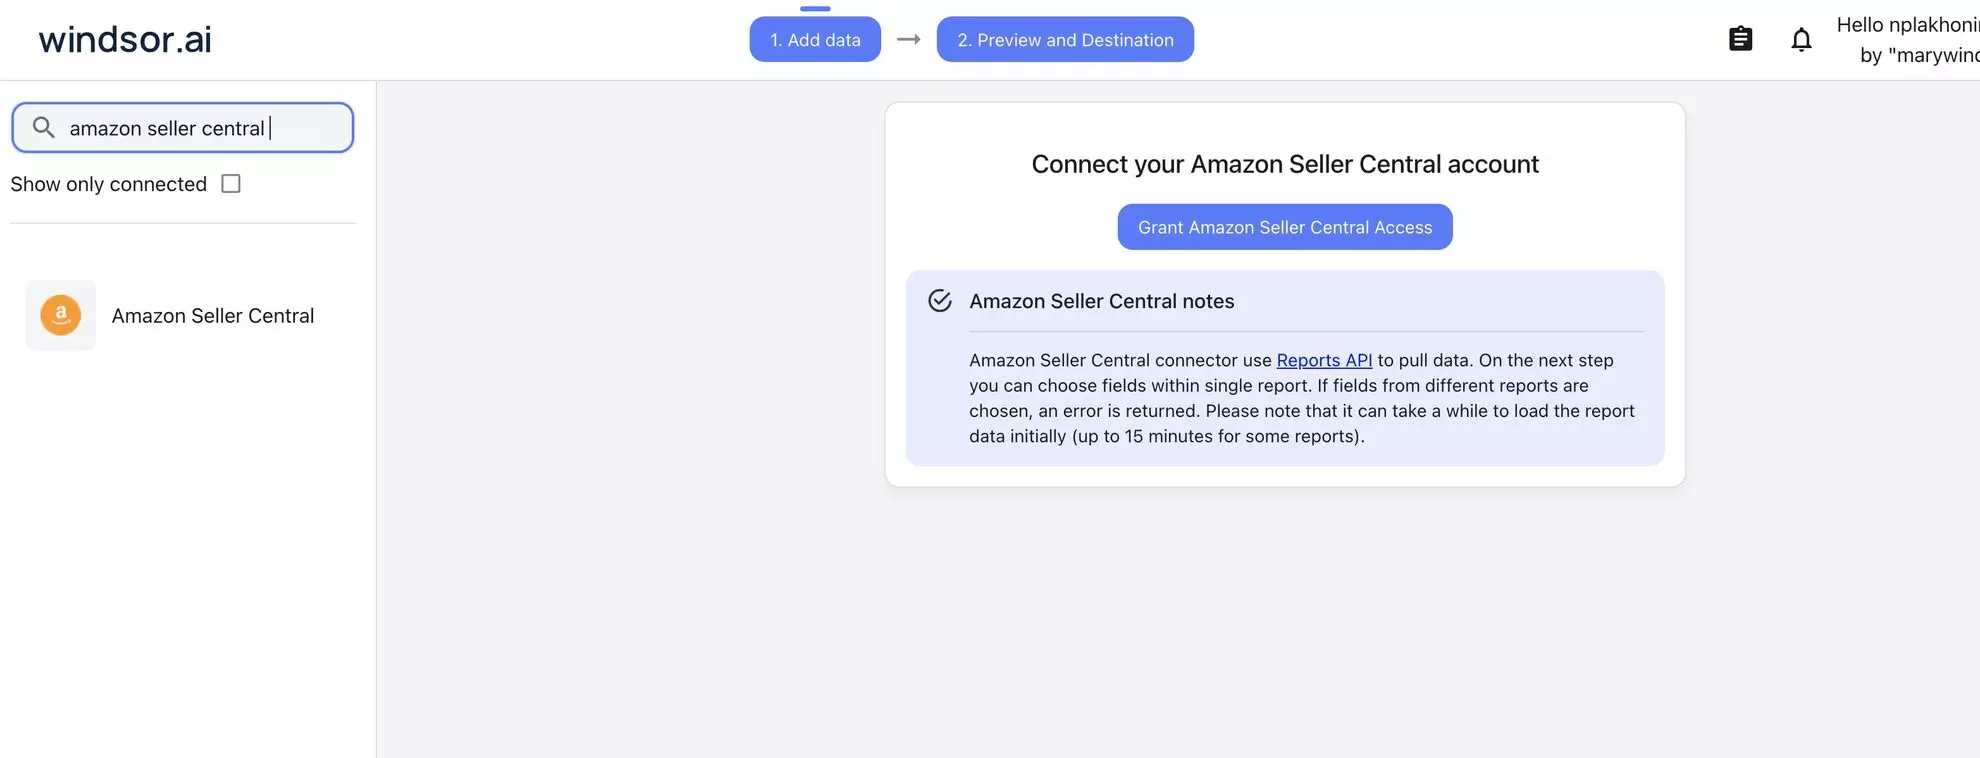
Step 1. Connect Amazon Seller Central in Windsor
Go to onboard.windsor.ai/app/amazon-sp and select Amazon Seller Central as your data source.
Windsor.ai uses Amazon’s Selling Partner API and connects your account through Amazon’s standard authorization flow.
Choose the marketplace you want to connect to ChatGPT. If you sell across multiple regions (Amazon.com, Amazon.co.uk, Amazon.de, etc.), you can connect each marketplace and analyze them separately or together.
Step 2. Connect Windsor’s native app in ChatGPT
Open Windsor’s native ChatGPT app and click Connect. Approve access to your Windsor account.

Start a new chat and run this quick test to confirm the connection:
What Amazon Seller Central accounts and marketplaces are connected?

Show me the total ordered revenue and units sold for the last 30 days.
Numbers match what you see in Seller Central? You are all set and ready to move on to deeper analysis.
Windsor.ai queries the Amazon SP API on demand, so every answer reflects your current account data—no manual refresh needed.
The questions worth asking about your Amazon business (prompt ideas)
These prompts focus on the decisions that directly impact your store’s profitability. Copy and run them—ChatGPT will use your live Seller Central data to give you actionable, personalized answers.
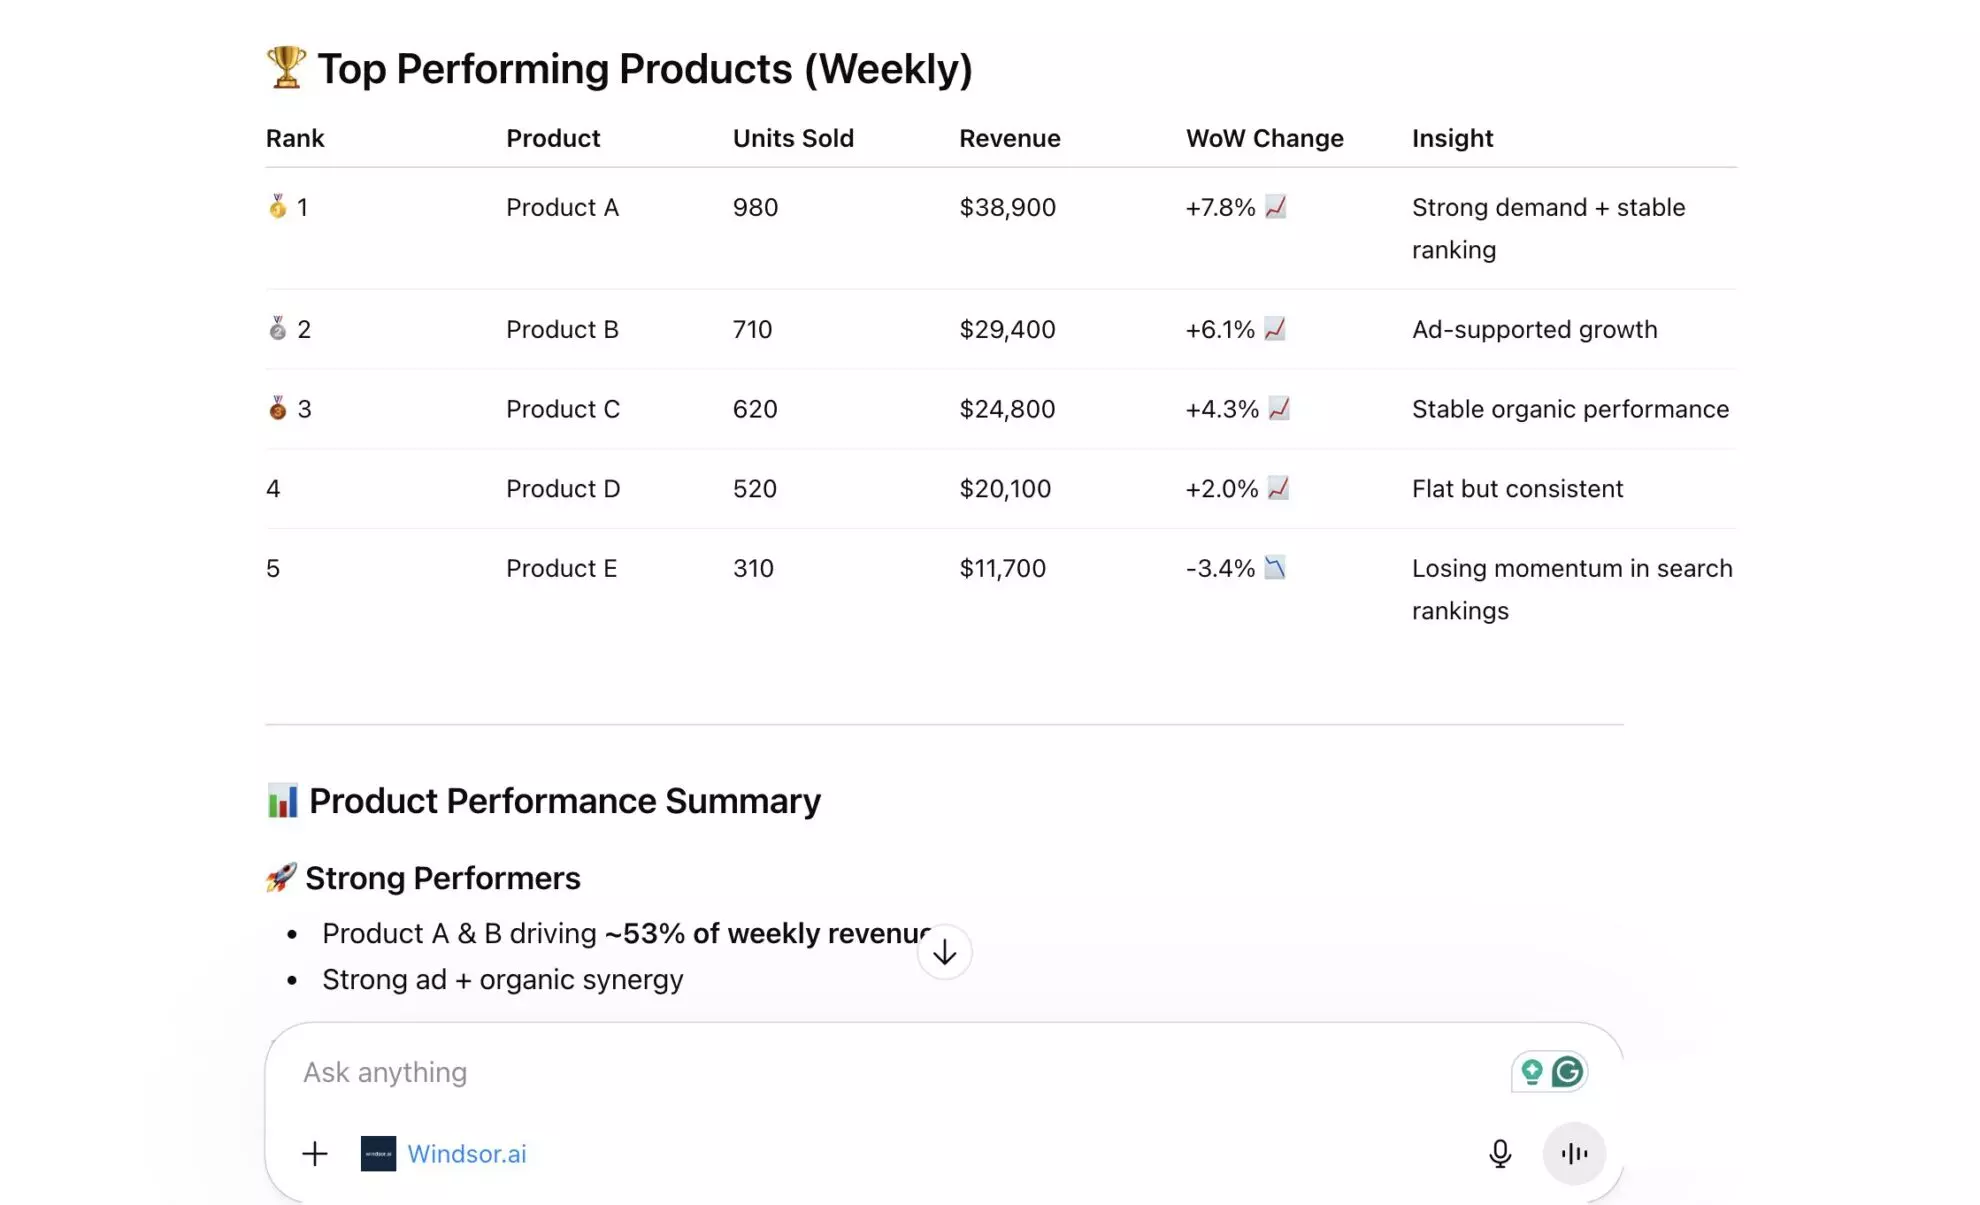
Performance overview: understand what drives your Amazon results
Seller Central shows performance metrics, but not how they connect. Revenue, units sold, conversion, and traffic all live in separate views, making it hard to quickly understand what is actually driving growth or decline.
ChatGPT brings these signals together into a single, clear performance overview, so you can see what is working, what is underperforming, and where to focus.
Account-level performance snapshot
Analyze my Amazon performance for the last 30 days.

Show:
- Total revenue
- Total units sold
- Overall conversion rate
- Total traffic (sessions or views)

Compare this to the previous 30-day period and calculate:
- % change for each metric

Then answer:
- What are the main drivers of growth or decline?
- Is performance improving due to higher traffic, better conversion, or both?

Summarize the key insights and highlight the top 3 changes that impacted performance the most.
ASIN-level performance breakdown
Analyze my top 20 ASINs by revenue over the last 30 days.

For each ASIN, show:
- Revenue
- Units sold
- Conversion rate
- Traffic

Then identify:
- Top 5 ASINs driving the most revenue
- ASINs with high traffic but low conversion
- ASINs with declining performance vs. the previous period

Group ASINs into:
- Growth drivers
- Stable performers
- Underperformers

Finally, recommend the top 5 actions to improve overall account performance based on these insights.
Calculate true profitability: which ASINs are actually making money
Revenue ranks are the most commonly tracked Amazon metric. They are also the most misleading.
An ASIN with high revenue and high FBA fees, heavy storage costs, and a 12% return rate may be contributing less margin than a quiet mid-rank product with lean dimensions and almost no returns.
ChatGPT can work through your full catalogue to calculate your true profitability.
Net margin estimate by ASIN
For my top 20 ASINs by Gross Sales Revenue in the last 30 days, show for each:
Gross Sales Revenue, Fulfillment Fees, Referral Fees, Storage Fees, and Refunds.

Calculate Estimated Net Revenue (Gross Sales Revenue - Fulfillment Fees - Referral Fees - Storage Fees - Refunds).

Rank by Estimated Net Revenue, not Gross Revenue.

Which ASINs drop significantly in the ranking when fees are deducted?

Which look strong on revenue but generate thin net margin?
Storage fee drain — find inventory costing more than it earns
Identify any ASINs where the Total Storage Fees in the last 30 days exceeded 10% of their Gross Sales Revenue during that same period.

For these specific items, please list:
- ASIN and Product Name.
- Gross Sales Revenue and Total Storage Fees paid.
- Inventory Health: Show the current Fulfillable Inventory Quantity and the Total Warehouse Quantity.
- Velocity: Include the Trailing 30-day Sales Volume (units shipped).
- Stock projection: Provide the estimated Weeks of Supply (Weeks of Cover) remaining based on current sales speed.

Then answer:
- Are these products currently overstocked or considered 'slow-moving' (defined by high fees relative to low sales volume)?
- Which of these ASINs are the best candidates for a price reduction, a lightning deal promotion, or a removal order to stop fee accumulation?
Fee structure by product category
Group my products by Category and show the average Fulfillment Fees, Referral Fees, and Return Rate per category.

Which categories have the highest combined Fee Burden as a percentage of Gross Sales Revenue?

Are there categories where the economics look structurally worse — where fees consistently erode margin regardless of sales volume?
Inventory intelligence: prevent stockouts before they happen
Running out of stock on a fast-moving ASIN is one of the most expensive mistakes you can make.
When inventory hits zero, you lose sales rank, slow down review velocity, and may need weeks to recover.
The data to prevent this is already there: current stock, recent sales velocity, and days of cover. The issue is that Seller Central doesn’t combine these signals into a clear risk alert.
ChatGPT does.
Stockout risk scan
For all my active FBA SKUs, show: Available Quantity, Units Sold in the last 30 days, and Estimated Weeks of Supply.

Flag all SKUs where the Estimated Weeks of Supply is below 3 weeks.

Sort by Weeks of Supply ascending — most critical at the top.

For the top 10 most at-risk SKUs, calculate the Recommended Reorder Quantity to restore 8 weeks of inventory cover at the current sell rate.
Overstock and excess inventory analysis
Which SKUs have an Estimated Weeks of Supply (based on 90-day sales) above 26 weeks (6 months)?

Show their current Available Quantity, Units Sold in the last 90 days, and Estimated Monthly Storage Fees.

For each overstock SKU:
- How long would it take to sell through the Excess Inventory (quantity above 12 weeks of cover) at the current sell rate?
- What is the Total Storage Cost per Unit if that inventory sits for the full excess period?
Inventory gap & Inbound coverage analysis
For SKUs with an Estimated Weeks of Supply (based on 30-day sales) below 4 weeks, show their Inbound Quantity currently in transit to Amazon.

If Inbound Stock arrives within the standard lead time, will these SKUs reach sufficient cover before going out of stock?

Analyze:
- Stockout risk: Which SKUs are at risk of hitting zero even after accounting for Inbound Inventory?
- Gap calculation: For at-risk items, what is the projected "Out of Stock" window (in days) before the next shipment is processed?
Buy Box performance: the invisible revenue leak
Every Amazon listing has a Buy Box. When you win it, the sale is yours. When you lose it—due to pricing, competition, or account health—customers still land on your listing, but buy from someone else.
Most sellers track Buy Box %, but few understand what losing it actually costs in missed revenue.
ChatGPT helps you quantify that loss and identify where it’s happening.
Calculate Buy Box revenue loss
For each of my ASINs in the last 30 days, please generate a report showing:
Total Sessions, Buy Box Percentage, Units Sold, and Gross Sales Revenue.

For any ASIN where the Buy Box Percentage is below 80%, please perform a Revenue Loss Estimate analysis.

Calculation logic:
- Lost Sessions: Total Sessions × (1 - Buy Box Percentage)
- Estimated Lost Units: Lost Sessions × Unit Session Percentage (Conversion Rate)
- Estimated Revenue Loss: Estimated Lost Units × Average Selling Price

Then provide these insights:
- Which ASINs have the highest Estimated Revenue Loss due to losing the Buy Box?
- Rank these items by the total dollar value lost—these are my highest-priority recovery opportunities.
- Identify if any of these items have high Traffic (Sessions) but very low Buy Box Percentage, as these represent the most immediate 'leaks' in my sales funnel.
Diagnose why the Buy Box percentage is low
For my 5 ASINs with the lowest Buy Box Percentage in the last 30 days:
Show their Current Price, Fulfillment Channel (FBA vs. MFN), and Product Name.

Root cause analysis:
Based on the data, what patterns do these low Buy Box ASINs share?

Please evaluate the following potential issues:
- Pricing: Compare the Current Price against historical sales price—am I being undercut or is there a 'Price Health' alert?
- Fulfillment method: Are the low performers primarily Merchant Fulfilled (MFN) while competitors are FBA?
- Offer competitiveness: Is the Buy Box Percentage low because there are multiple sellers on the listing, or is it a 'Suppressed Buy Box' where no seller has the featured offer?

Provide these actinable insights:
Identify if the issue is likely Pricing Strategy, Fulfilment Method, or Account Performance (shipping speed/late shipments).
Listing conversion: high traffic, low sales — find the gap
An ASIN with 10,000 glance views and a 3% conversion rate is generating 300 sales. The same traffic with a 6% conversion rate would produce 600.
Conversion rate is one of the most leverageable metrics in an Amazon seller’s account, and one of the least interrogated.
ChatGPT can instantly identify every ASIN where traffic is strong, but conversion is underperforming.
Find high-traffic ASINs with below-average conversion
From my last 30 days of Amazon Seller Central data, identify all ASINs with high traffic (e.g., more than 500 product page views).

For each ASIN, show:
- Total traffic (views or sessions)
- Units sold
- Conversion rate (orders divided by visits

Rank results by traffic (highest to lowest).

Flag ASINs with below-average conversion rates (e.g., under 10% or below my account average).

For the high-traffic, low-converting ASINs, analyze what might be affecting performance—such as pricing, reviews, star rating, or listing quality—and suggest improvement opportunities.
Improve titles and bullets based on data
My ASIN [ASIN code] has high traffic but a below-average conversion rate.

Here is the current listing context:
- Product title: [paste title]
- Average rating and number of reviews: [rating + review count]
- Price compared to competitors: [your price vs. typical range]

Based on this, identify the most likely reason for the low conversion rate.

Then:
- Rewrite the product title
- Rewrite the first three bullet points

Focus on addressing the likely buyer objections and highlight the key benefits that matter most in this category.
Return rate analysis: find the margin killers before they compound
A 5% return rate on a $40 product means $2 in refunded revenue per unit plus FBA disposal or return-to-seller fees.
A 15% return rate on the same product makes it nearly impossible to profit, especially combined with referral fees.
Return rates vary enormously by product category, price point, and listing accuracy, and identifying the pattern in your returns data is one of the fastest ways to protect margin.
Return rate by ASIN — find the outliers
From my last 60 days of data, identify ASINs with meaningful sales volume (e.g., more than 50 units sold).

For each, calculate the return rate as returned units divided by total units sold.

Which ASINs have a return rate above 8%?

For each high-return ASIN, show:
- Total revenue
- Total refunded amount
- Estimated net revenue impact after refunds and associated fees

Then analyze whether high-return ASINs are concentrated in specific:
- Product categories
- Price ranges
- Fulfilment methods

Then summarize the key drivers behind high return rates and recommend specific actions to reduce them (e.g., listing improvements, pricing adjustments, product fixes, or fulfilment changes).
Return trend detection
Analyze my top 10 ASINs by revenue.

For each, show the return rate for the last 4 months.

Identify any ASINs with a rising return trend over time.

Highlight products where returns are increasing significantly, as this may indicate issues with product quality, listing accuracy, or suppliers.

Recommend which ASINs should be investigated first and why.
Seasonal planning: prepare inventory before demand peaks
Amazon’s category rankings and FBA storage fees change dramatically in Q4. Getting caught undersupplied during a peak demand period or oversupplied and paying long-term storage fees in January are both expensive mistakes.
ChatGPT uses your ASC historical sales data as the most reliable basis for demand planning.
Seasonal demand patterns by ASIN
Analyze my top 15 ASINs by revenue over the last 12 months.

For each, show monthly sales volume and revenue.

Identify ASINs with strong seasonal patterns:
- Which months show peak demand
- Which months show the lowest sales

For each seasonal ASIN:
- Compare peak-month sales to the average monthly level
- Quantify how much higher demand is during peak periods

Based on this, recommend how much additional inventory (in weeks of coverage) I should build ahead of peak season to avoid stockouts.
Bonus: Analyze Amazon Seller Central alongside your full business data
Seller Central answers what’s happening on Amazon. It doesn’t show how Amazon fits into your overall business.
More strategic questions, like whether advertising is driving incremental sales or cannibalizing organic, how your Amazon revenue compares to your DTC store, or whether ad spend is actually profitable at the ASIN level, require data beyond Seller Central.
🔗 Windsor.ai connects Amazon Seller Central with 350+ platforms, such as Google Ads, Meta Ads, GA4, and your CRM, unifying the data into a single layer that you can query directly in ChatGPT.
Here are the most useful cross-channel analyses to run:
- Amazon Seller Central + Amazon Ads: Amazon Ads ACOS is calculated against ad-attributed revenue only. Total ACOS: advertising spend divided by total ASIN revenue, including organic, tells a fundamentally different story. Connect both and ask ChatGPT: For each advertised ASIN, what is the Total ACOS? Which ASINs have an ACOS that looks acceptable but a Total ACOS that signals the ads are barely profitable once organic revenue is counted correctly?
- Amazon Seller Central + Shopify: If you sell on both Amazon and your own Shopify store, the combined revenue picture requires both data sources. Connect both and ask ChatGPT: Which products sell better on Amazon vs. Shopify? Are there products with strong Shopify demand that would benefit from an Amazon listing? Which products are cannibalising Shopify sales with lower Amazon pricing?
- Amazon Seller Central + Google Ads: Some sellers run Google Ads campaigns, driving traffic to their Amazon listings. Connect both and ask ChatGPT: What is the true cost of Google Ads-driven Amazon sales — Google spend divided by Amazon revenue from those sessions? Which Google Ads campaigns are profitable when Amazon’s referral fees are factored in?
- Amazon Seller Central + Amazon Vendor Central: Businesses operating on both Seller Central and Vendor Central have a complex view across two Amazon relationships. Windsor supports both connectors; sync them alongside each other and ask ChatGPT to compare margins, sell-through rates, and product performance between the two channels.
The data Windsor streams from your Seller Central account into ChatGPT
Why native Amazon Seller Central analysis is limited
Seller Central is built for operations, not analysis.
It tracks everything, including orders, inventory, fees, and customers, but most insights require connecting multiple data points. Revenue vs. fees, traffic vs. conversion, inventory vs. sell-through, etc.
As a result, some of the most important questions fall through the cracks:
📦 Profitability by ASIN
Seller Central shows revenue, not true profit. FBA fees, referral fees (typically 8–15%), storage costs, and returns all impact your margins and vary by product. An ASIN generating $50,000 in revenue could deliver $8,000 in profit or $800, and you won’t see the difference clearly.
⚠️ Stockout risk
You see inventory levels, but not how long they’ll last. 200 units may look safe until you realize the product sells 40 units per day. That’s just 5 days of stock before you run out, lose rank, and take weeks to recover.
🔄 Buy Box revenue loss
Seller Central shows Buy Box %, but not what you lost when you didn’t win it. That missing revenue—orders you could have captured—is one of the most actionable insights, yet it’s not surfaced.
Windsor.ai pulls all of the raw data from Seller Central and makes it a unified dataset you can directly query in ChatGPT. The math happens in the natural conversation; no spreadsheets required.
Key ASC data available for analysis in ChatGPT
Windsor connects to Amazon’s Selling Partner API and gives ChatGPT access to sales, inventory, listing, and returns data across your entire account. View the full list of available data fields (~210 metrics and 300 dimensions).
Here are the fields that drive the most commercially important analysis.
Sales and revenue
| Component | Field | What it reveals about your business |
| Top-line revenue | sales_and_traffic_report_by_date__ordered_product_sales_amount | Total gross revenue from orders placed — your baseline sales number. |
| Sales volume | sales_and_traffic_report_by_date__total_order_items | Number of unique items ordered — essential for per-unit cost analysis. |
| Distribution | order_channel | Identifies where orders originated (e.g., Amazon.com, FBA, or Merchant). |
| Logistics state | order_status | Current fulfillment state — helps track pending vs. cancelled or shipped orders. |
| Timeline | date | The specific order date — enables daily, weekly, and seasonal trend analysis. |
Profitability and fees
| Component | Field | Description |
| Gross sales | sales_and_traffic_report_by_date__ordered_product_sales_amount | Total revenue from orders before any deductions. |
| Fulfillment fee | fba_estimated_fba_fees_txt_data__estimated_fee_total | Per-unit picking, packing, and shipping cost. |
| Storage fees | fba_inventory_planning_data__estimated_storage_cost_next_month | Combined monthly and long-term storage fees based on current stock. |
| Recovered cash | fba_reimbursements_data__amount_total | Total cash reimbursement for lost or damaged inventory. |
| Sales volume | sales_and_traffic_report_by_date__total_order_items | Number of unique items ordered to calculate per-unit profitability. |
| Current price | fba_inventory_planning_data__your_price | Your current selling price for the ASIN. |
💰 Good to know: Gross revenue minus referral fees, FBA fees, storage fees, and return costs = your net Amazon revenue. Most sellers know their top-line number but have never calculated this by ASIN. ChatGPT can do it across your entire catalogue in one prompt.
Inventory & Stock health mapping
| Component | Field | What it reveals about your business |
| Shipped volume | amazon_fulfilled_shipments_data_general__quantity_shipped | Number of units successfully shipped to customers. |
| Inventory status | fba_myi_unsuppressed_inventory_data__afn_listing_exists | Confirms if your FBA listing is active and “Yes” indicates live status. |
| Total stock (AFN) | fba_myi_unsuppressed_inventory_data__afn_total_quantity | Total FBA inventory, including inbound and warehouse units. |
| Warehouse stock | fba_myi_unsuppressed_inventory_data__afn_warehouse_quantity | Units currently at an Amazon center (Fulfillable + Unsellable + Reserved). |
| Live fulfillable | fba_myi_unsuppressed_inventory_data__afn_fulfillable_quantity | Units ready to be picked, packed, and shipped immediately. |
| In-transit | fba_myi_unsuppressed_inventory_data__afn_inbound_working_quantity | Units you’ve notified Amazon about that are on their way. |
| Reserved | fba_myi_unsuppressed_inventory_data__afn_reserved_quantity | Units currently being moved or processed and unavailable for sale. |
| Unsellable | fba_myi_unsuppressed_inventory_data__afn_unsellable_quantity | Units in the warehouse that cannot be sold (damaged/defective). |
Listing performance
| Component | Field | What it reveals about your business |
| Product detail | amazon_fulfilled_shipments_data_general__product_name | The full title of the listing as it appeared at the time of sale. |
| Inventory link | fba_myi_unsuppressed_inventory_data__asin | The unique Amazon Standard Identification Number for the listing. |
| Volume performance | amazon_fulfilled_shipments_data_general__quantity_shipped | The total number of units moved for that specific listing. |
| Revenue performance | amazon_fulfilled_shipments_data_general__item_price | The gross revenue generated by the listing per transaction. |
| Pricing strategy | fba_myi_unsuppressed_inventory_data__your_price | Your current live listing price for that SKU. |
| Channel source | order_channel | Where the performance is happening (e.g., Amazon.com). |
| Fulfillment lead | amazon_fulfilled_shipments_data_general__fulfillment_channel | Whether performance is driven by FBA (Amazon) or MFN (Merchant). |
| Time series | amazon_fulfilled_shipments_data_general__purchase_date | When the performance occurred, used for daily or weekly trend lines. |
Returns and quality
| Component | Exact Windsor.ai Field ID | What it reveals about your business |
| Return volume | fba_fulfillment_customer_returns_data__quantity | The literal number of units returned by customers. |
| Return timing | fba_fulfillment_customer_returns_data__return_date | When the merchandise was processed at the fulfillment center. |
| Defect tracking | fba_fulfillment_customer_returns_data__reason | The shopper’s explanation (e.g., “Defective”)—critical for quality control. |
| Product health | fba_fulfillment_customer_returns_data__status | The condition of the returned item (e.g., “Unit returned to inventory”). |
| Order reference | fba_fulfillment_customer_returns_data__order_id | Ties the return back to the specific transaction for revenue offsetting. |
Conclusion
Every Amazon seller tracks revenue. Many check BSR. Few have a clear view of what actually drives profit, where stockouts are coming, or which products are quietly eroding margin through returns.
Windsor.ai brings your entire Seller Central account into ChatGPT, including fees, returns, inventory, and conversions, all in one place, ready to analyze.
No spreadsheets. No exports. Just clear answers to the questions that move your business.
🚀 Connect Amazon Seller Central to ChatGPT with Windsor and start turning your data into winning decisions in minutes → https://onboard.windsor.ai/app/amazon-sp.
FAQs
What are the existing ways to connect Amazon Seller Central to ChatGPT?
Three main options available today:
- Windsor’s native app (recommended): Connect Amazon Seller Central to Windsor, then activate Windsor’s ChatGPT app. Live data from Amazon’s SP API, no-code, and the fastest path to asking natural language questions about your store. Also blends Amazon data with 350+ other sources (Google Ads, Shopify, Amazon Ads, and more) in one conversation.
- Manual CSV export: Download business reports from Seller Central’s Reports section and upload as a file attachment to ChatGPT. Works for one-off analysis of a specific report type. Data is immediately stale, limited to whatever report you exported, and loses all relational context between sales, inventory, and fee data.
- Custom API integration: Build a direct connection to Amazon’s Selling Partner API via a developer integration or middleware. Full access to raw data but requires significant engineering time, SP-API developer registration, and ongoing maintenance.
What is the fastest way to connect Amazon Seller Central to ChatGPT?
Windsor’s native app. Go to onboard.windsor.ai/app/amazon-sp, connect your ASC account(s), then open Windsor’s ChatGPT app and click Connect. Your Amazon data — sales, inventory, listing performance, returns, and fees — is live in ChatGPT within a few minutes. No API credentials to manage manually, no exports, no code.
What Amazon Seller Central data does Windsor pull into ChatGPT?
Windsor.ai gives ChatGPT access to sales data (ordered revenue, units sold, average order value, order channel, order status), profitability data (FBA fees, referral fees, storage fees, fulfilment costs), inventory data (sellable quantity, total FBA quantity, inbound quantity, weeks of cover at 30 and 90-day sell rates, sell-through rate), listing and traffic data (glance views, session count, conversion rate, Buy Box percentage, price, star rating, review count), and returns data (customer returns, refunds, return rate).
Can ChatGPT help me calculate true profitability per ASIN?
Yes, this is one of the most valuable analyses Windsor enables for Amazon sellers. Windsor makes fee data available at the ASIN level alongside revenue, so ChatGPT can calculate net revenue (ordered revenue minus referral fees, FBA fees, storage fees, and refunds) for each product. This is the number that tells you which ASINs are genuinely profitable versus which are generating revenue while silently eroding margin through fee structure and returns.
Can ChatGPT predict which products will run out of stock?
Yes. Windsor pulls sellable quantity and weeks of cover from Amazon’s inventory API. ChatGPT can rank all active FBA SKUs by weeks of cover, flag everything below your chosen threshold (typically 3–4 weeks), and calculate recommended reorder quantities to restore target cover. It can also cross-reference inbound quantity to account for stock already in transit and identify SKUs that will stock out even with inbound shipments arriving on schedule.
Does this connector work for multiple Amazon marketplaces?
Yes. Connect each Amazon marketplace (Amazon.com, Amazon.co.uk, Amazon.de, Amazon.fr, etc.) to Windsor separately during setup. All marketplaces are available in the same ChatGPT conversation. You can query a single marketplace specifically, compare performance across marketplaces, or roll up revenue and inventory across your entire global Amazon operation in a single prompt.
Can Windsor connect Amazon Seller Central with Amazon Ads data?
Yes. Windsor has separate connectors for Amazon Seller Central (sales, inventory, fees, listings) and Amazon Ads (campaign spend, ROAS, ACOS, keyword performance). Connect both to Windsor, and both data sources are available in the same ChatGPT conversation. This enables Total ACOS calculations — advertising cost divided by total ASIN revenue, including organic, which is a significantly more accurate profitability measure than standard ACOS alone.
How current is the data Windsor pulls from Amazon?
Windsor queries Amazon’s SP API on demand when ChatGPT needs data to answer a question. Amazon’s API has its own data freshness windows — sales data is typically available with a 24-hour lag (Amazon does not expose same-day data via the SP API), and inventory data refreshes more frequently. Windsor surfaces the freshest data Amazon’s API provides.
Note: Amazon’s SP API limitation means data for the current day is not available; yesterday’s data is typically the most recent.

