 AI insights
 About us
 Careers
 Security
 Customer reviews
 Contact us
 Affiliate program
 Solution partners
 Looker Studio templates
 Tableau templates
 Facebook Ads templates
 Google Ads templates
 Data fields & Metrics
 AI prompt library & Guides
 Product documentation
 API documentation
 Case studies
 Blog
Blog Data models
 Windsor vs Supermetrics
 Windsor vs Fivetran
 Windsor vs Portermetrics
 Last updated: 29 June 2026

Google Sheets is where most modern teams do their reporting and analytical work.
The actual budget tracker, the agency performance report, the campaign planner, and the KPI dashboard are shared every Monday. It’s all in Sheets.
However, this approach hits a ceiling fast. Formulas nest into formulas. Tabs multiply. Someone updates column D and breaks the pivot. Finally, getting actionable insights from raw numbers is not an easy task.
You see the numbers, but understanding what’s happening and why often takes hours of manual analysis, usually beyond spreadsheets, and even more time to act on what you find.
With Windsor MCP, you can connect your Google Sheets directly to Claude to get instant AI-powered answers and execute live changes on your real data with no formulas, no pivots, no BI tools, and no exports required.
🚀 Connect Google Sheets to Claude with Windsor MCP. Try it free: https://onboard.windsor.ai/app/googlesheets.
Once connected, the analysis that used to take hours in Sheets and dashboards takes seconds in Claude. Just ask:
- Identify unusual spikes or anomalies in this dataset and suggest possible reasons.
- Which segments (channel, region, or product) are underperforming and why?
- Forecast next month’s results based on current trends and highlight risks.
- Turn this sheet into an executive summary with 3 key insights and recommended actions.
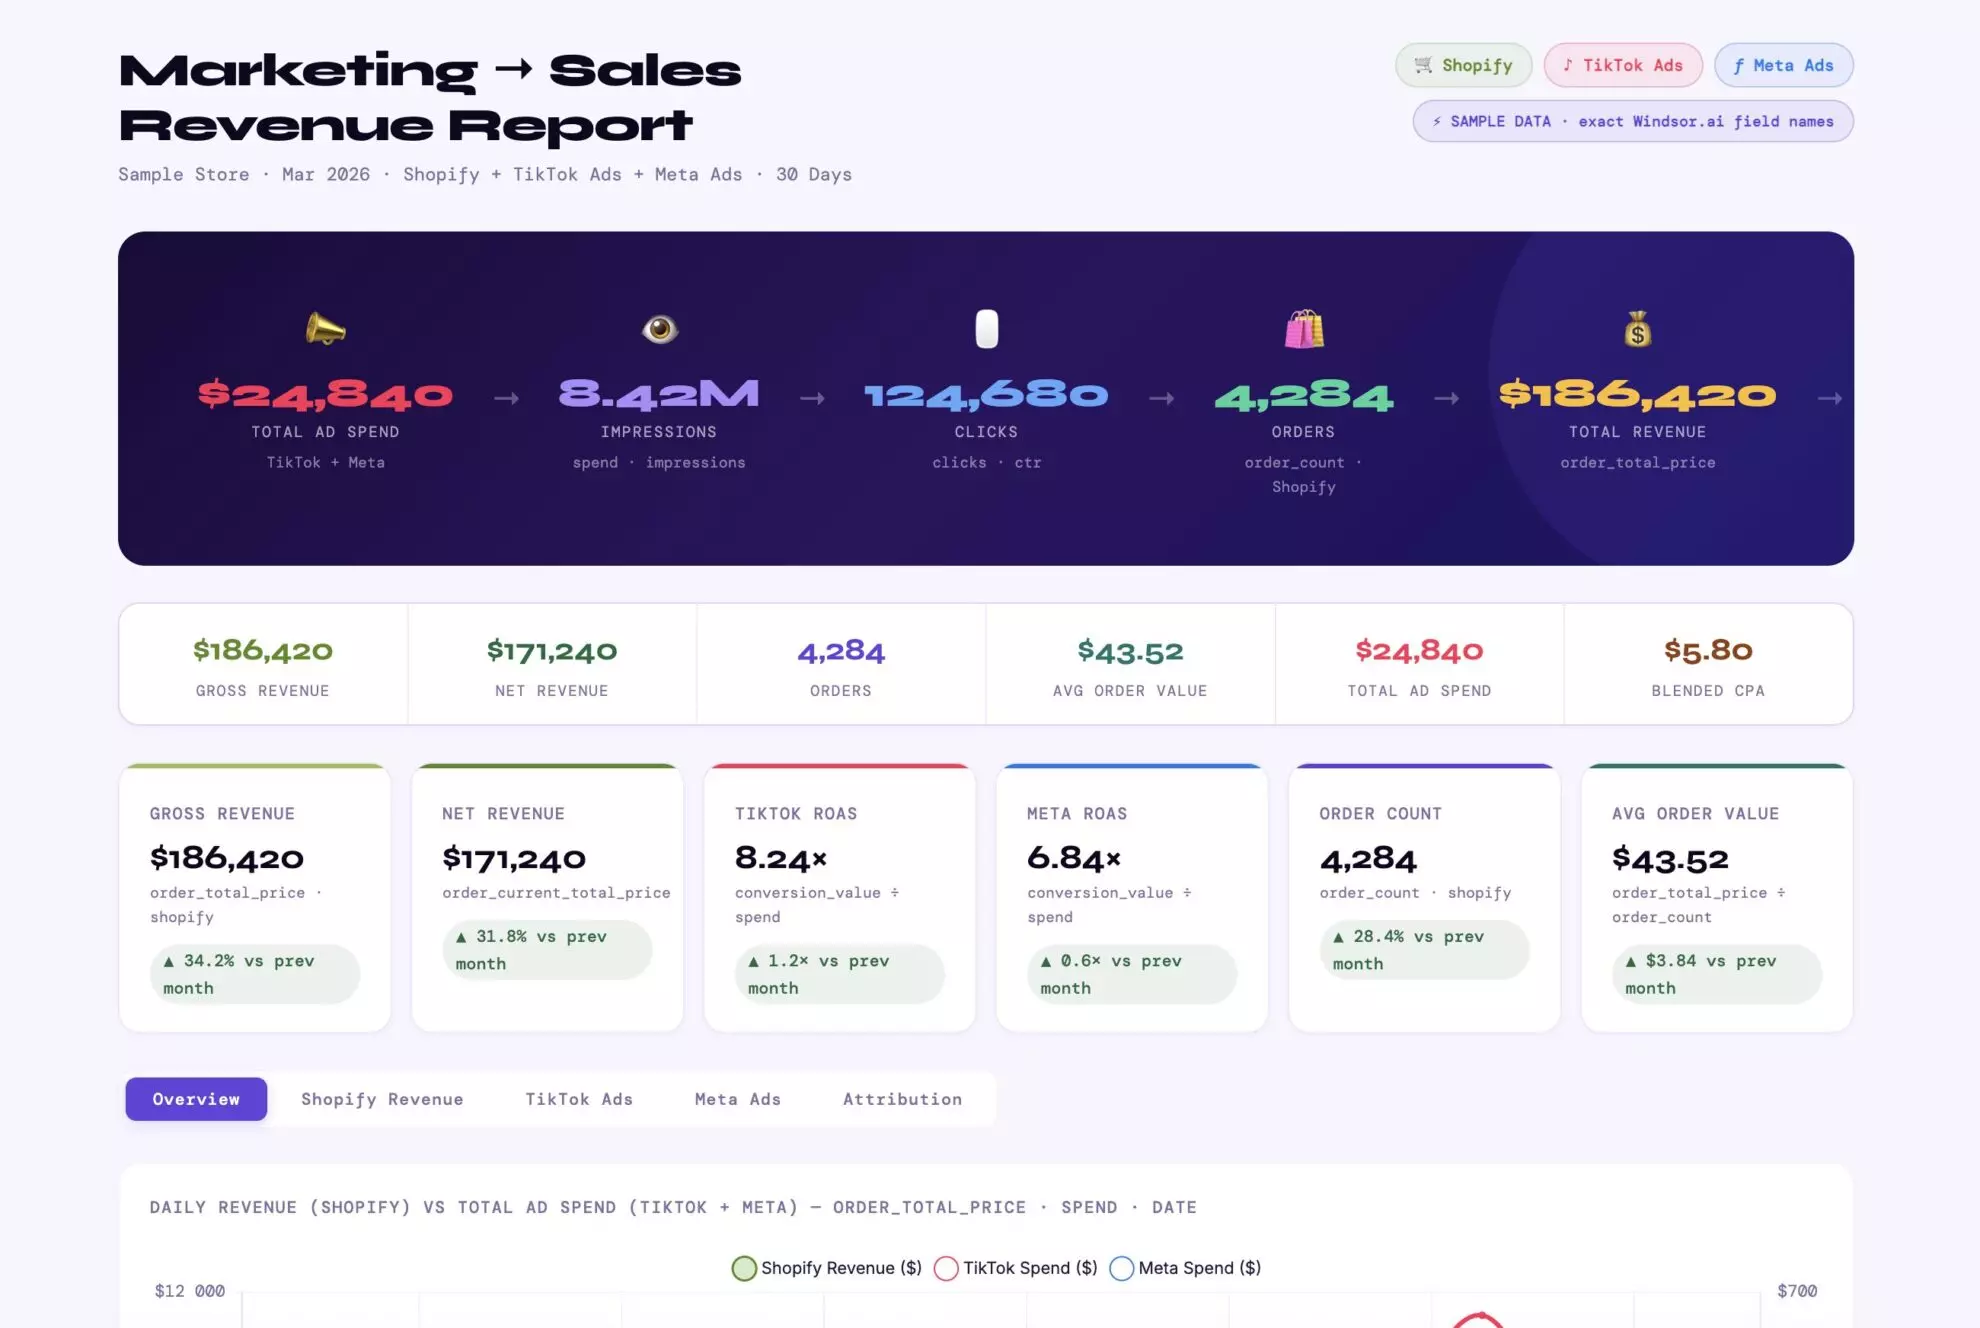
You can also generate clean visual reports on top of your spreadsheet data with a single prompt.
Sounds intriguing? Here’s how to build a Google Sheets to Claude integration in less than a minute.
How to connect Google Sheets to Claude with Windsor MCP
Just three simple steps, no engineering required.
📖 Full setup guide: https://windsor.ai/documentation/windsor-mcp/how-to-integrate-data-into-claude/.
Prerequisites
- A Windsor.ai account (free or paid plan)
- A Google Sheets file with editor access
- A Claude.ai account
Steps to link Google Sheets to Claude
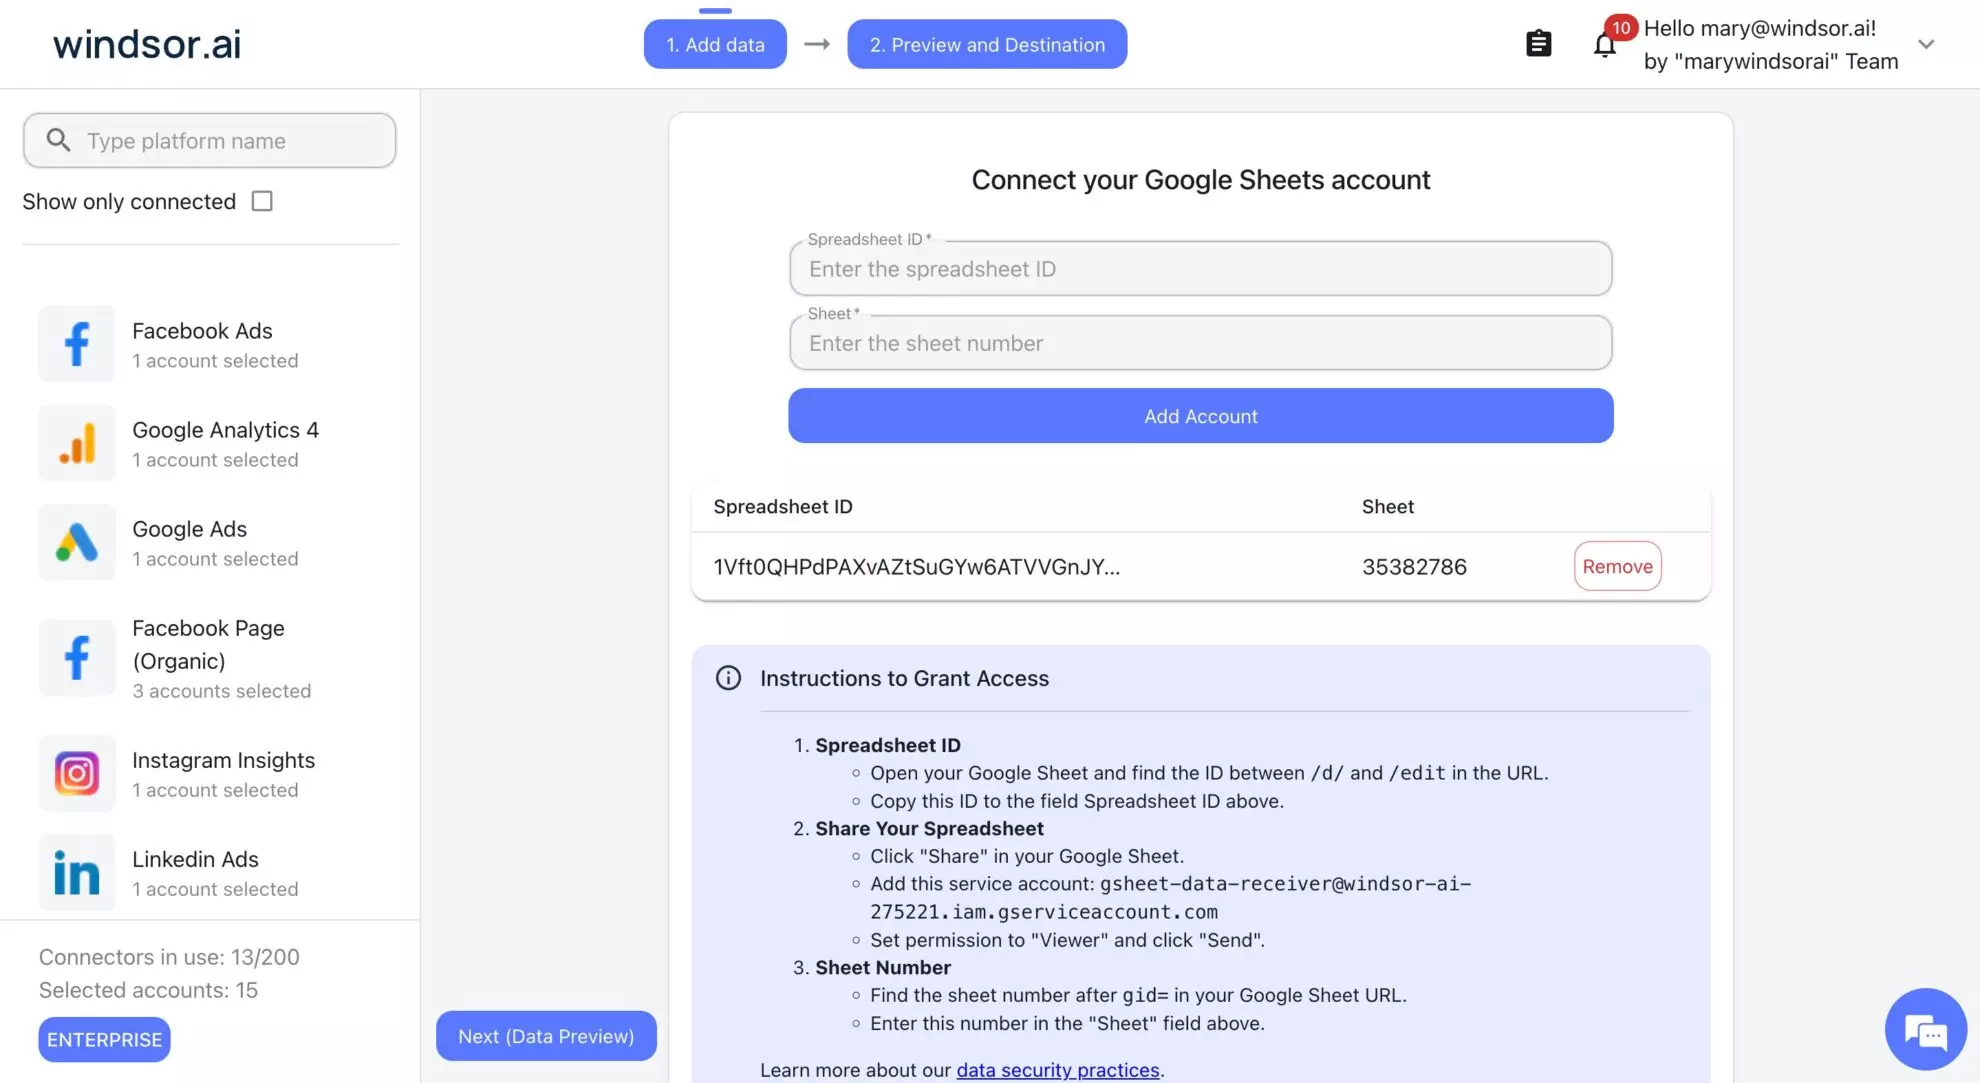
1. Go to onboard.windsor.ai/app/googlesheets and connect your spreadsheet by entering its ID and number.
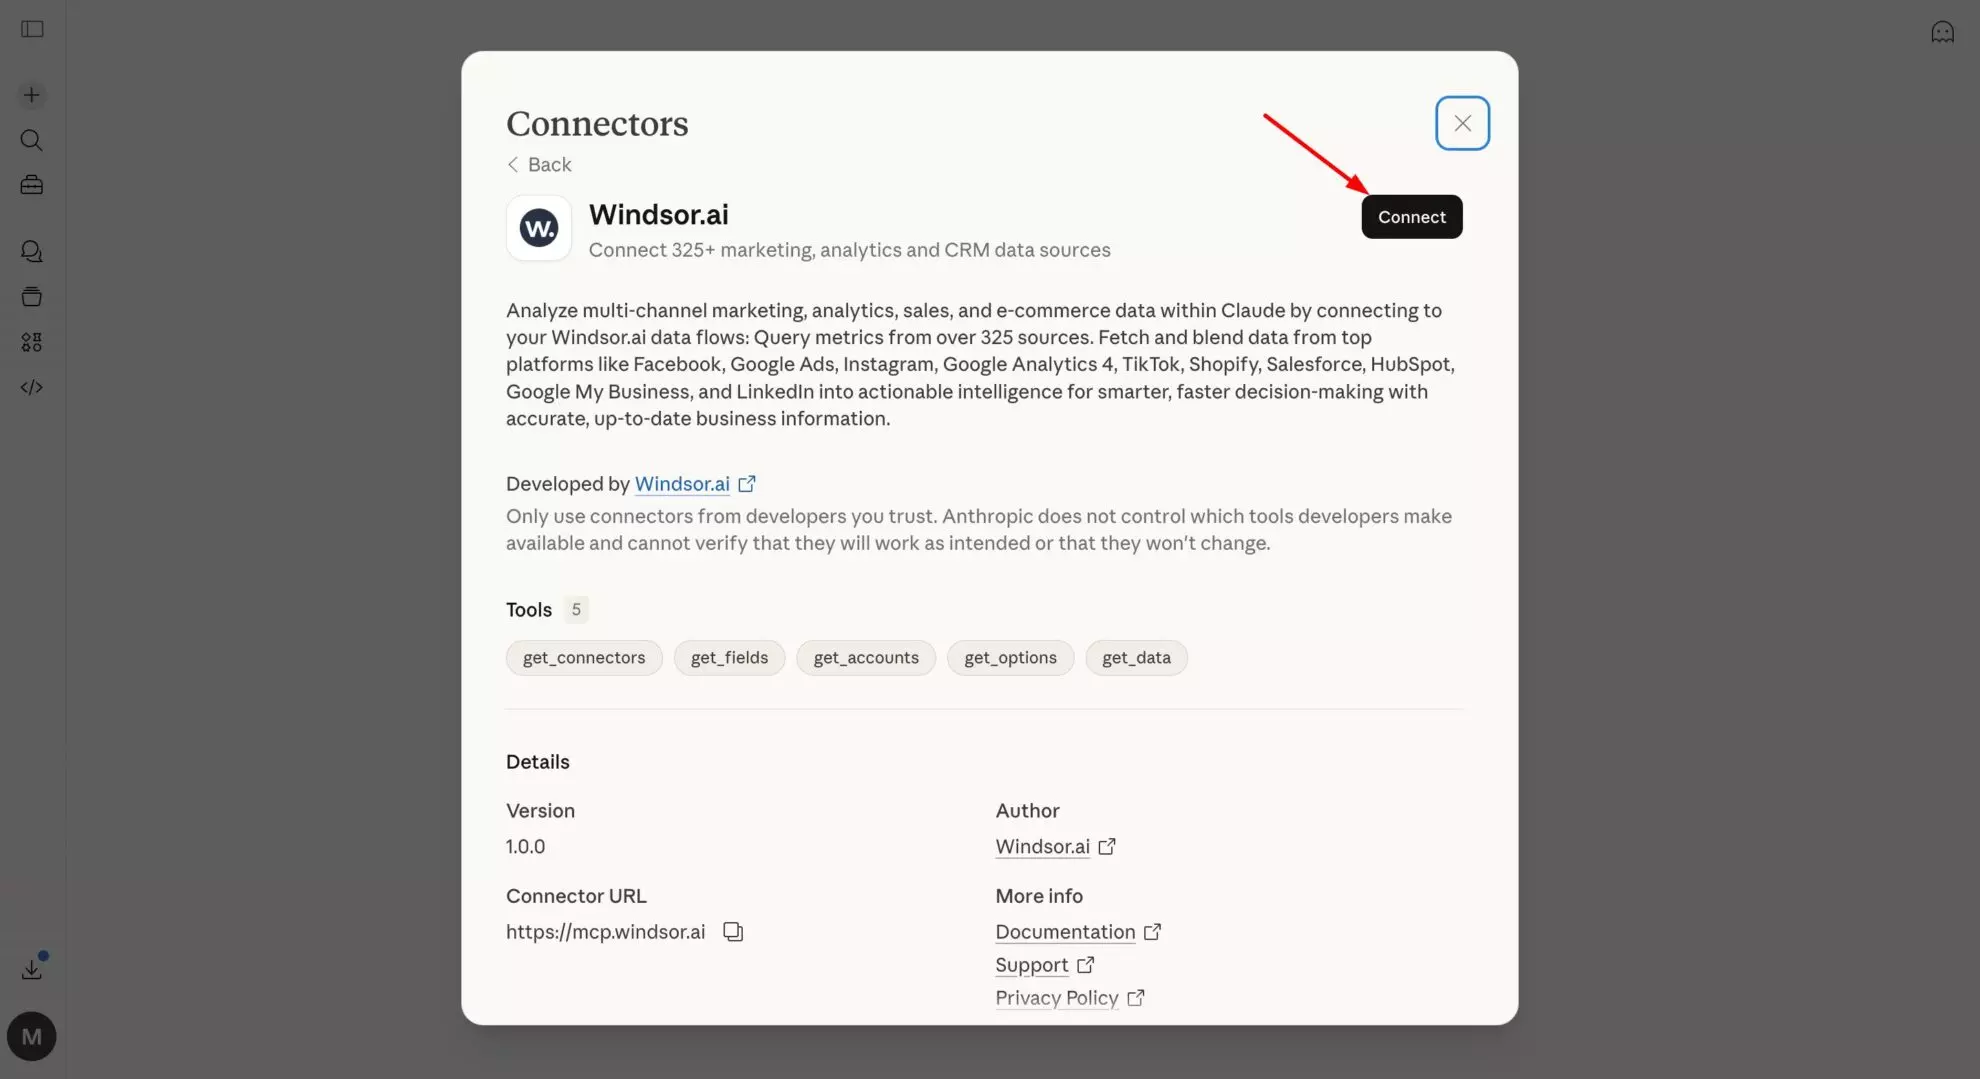
2. In Claude, open the Windsor.ai connector page and click Connect.
3. Start asking questions about your integrated data based on its context and your analytical goals.
💡 Pro tip: Windsor treats your sheets as structured data: headers become fields, rows become records. Structure your data cleanly to get the most accurate results from Claude.
What you can do with your Google Sheets data in Claude: Prompt ideas
🤖 Find more advanced prompt ideas across various scenarios: windsor.ai/prompt-library/.
Use cases for marketing teams
Scattered data, broken attribution, and endless budget spreadsheets make it hard to know what’s actually driving performance.
These prompt ideas help you quickly identify what’s working, what’s wasting budget, and where to optimize.
Budget pacing & performance
Simple prompts:
Which campaigns are overspending right now?
Are we on track with this month’s budget?
Where should we reallocate budget to improve results?
Deeper prompt:
Compare planned vs. actual spend and identify campaigns that are over or under budget. Project month-end spend and recommend budget shifts.
Campaign performance & optimization
Simple prompts:
Which campaigns are driving the best results right now?
What’s our top-performing and worst-performing channel this month?
Which campaigns should we pause or scale?
Deeper prompt:
Analyze performance by campaign and channel. Identify top and bottom performers based on CPA, ROAS, or conversion rate, and recommend optimizations.
Data blending: Sheets + ad platforms (Google Ads, Meta, etc.)
Use case: Combine your planning data (Sheets) with live performance data.
Simple prompts:
How does actual performance compare to our plan?
Which channels are beating our targets?
Where are we underperforming vs. expectations?
Deeper prompt:
Join budget data from Google Sheets with live ad platform data. Compare planned vs. actual CPA, conversions, and spend. Highlight gaps and suggest budget reallocation.
Funnel & conversion analysis
Simple prompts:
Where are we losing users in the funnel?
Which campaigns bring the highest-quality traffic?
Which channel has the best conversion rate?
Deeper prompt:
Analyze funnel performance across channels and identify drop-off points. Highlight which campaigns drive high-intent users and where optimization is needed.
Experimentation & A/B testing
Simple prompts:
Which test variant is winning?
Are our experiments statistically meaningful?
Advanced prompt:
Compare A/B test results across campaigns. Identify winning variants and explain performance differences.
Use cases for e-commerce & B2C teams
ROAS looks good in dashboards, but true profitability, CAC, and customer value are buried across disconnected tools.
These prompts help you uncover real profitability, optimize acquisition, and identify high-value customers.
ROAS & revenue performance
Simple prompts:
Which campaigns have the highest ROAS?
Where are we losing money on ads?
Which products generate the most revenue?
Deeper prompt:
Analyze revenue, spend, and ROAS by campaign and product. Identify unprofitable campaigns and recommend budget reallocation.
Customer acquisition cost (CAC)
Simple prompts:
What’s our CAC by channel?
Which channels are the most cost-efficient?
Deeper prompt:
Calculate CAC by channel and campaign. Compare against LTV (if available) and highlight which channels are scalable and which are too expensive.
Data blending: Ads + Shopify/store data
Use case: Combine ad spend with real revenue data from your store.
Simple prompts:
What’s our true ROAS after refunds and discounts?
Which channels drive repeat purchases?
Which campaigns bring high-value customers?
Deeper prompt:
Join ad platform data from Google Sheets with Shopify data. Calculate true ROAS, LTV, and repeat purchase rate by channel. Identify the most valuable acquisition sources.
Product & catalog performance
Simple prompts:
Which products are best sellers?
Which products have high traffic but low conversions?
Deeper prompt:
Analyze product-level performance. Identify high-traffic, low-conversion products and suggest optimization opportunities.
Cohort & retention analysis
Simple prompts:
Are new customers coming back?
Which acquisition channels drive repeat buyers?
Advanced prompt:
Perform cohort analysis by acquisition date and channel. Measure retention and repeat purchase behavior over time. Compare orders from new vs returning customers.
Promotions & discounts analysis
Simple prompts:
Did our last promotion increase revenue?
Which discounts performed best?
Deeper prompt:
Analyze the impact of promotions on revenue, margins, and conversion rates. Identify which campaigns drove incremental vs. discounted sales.
Use cases for sales teams
Pipeline data lives in multiple places, forecasts are unreliable, and getting a clear view of deal health takes hours every week.
These prompts help you spot risks early, prioritize deals, and improve forecast accuracy.
Pipeline visibility & deal health
Simple prompts:
What does our pipeline look like right now?
Which deals are at risk this month?
Where are we most likely to miss targets?
Deeper prompt:
Analyze pipeline by stage, deal size, and close date. Identify at-risk deals based on inactivity, close probability, and stage progression.
Quota attainment & rep performance
Simple prompts:
Who is behind on quota?
Which reps are performing best this quarter?
Who needs support right now?
Deeper prompt:
Calculate quota attainment by rep. Highlight underperformers, top performers, and explain key performance drivers.
Sales forecasting
Simple prompts:
Are we on track to hit our target?
What’s our expected revenue this quarter?
Deeper prompt:
Forecast revenue based on pipeline, win rates, and deal stages. Highlight risks and confidence levels.
Data blending: Sheets + CRM (Salesforce, HubSpot)
Use case: Align manually tracked pipeline with CRM data.
Simple prompts:
What’s missing between this sheet and our CRM?
Which deals don’t match?
Deeper prompt:
Compare pipeline data between Sheets and CRM. Identify missing deals, mismatched values, and inconsistencies in ARR or close dates.
Deal insights & sales strategy
Simple prompts:
Which deals should we prioritize?
Where can we close faster?
Deeper prompt:
Analyze deal velocity, size, and win rate. Recommend which deals to prioritize and where to focus effort to maximize revenue.
Use cases for financial teams
Forecasts, actuals, and cash flow data rarely match perfectly, leaving teams stuck reconciling numbers instead of analyzing them.
These prompts help you quickly identify variances, control costs, and generate clear financial insights.
Budget planning vs. actuals
Simple prompts:
Where did we overspend last month?
Which departments are under budget?
Deeper prompt:
Compare forecast vs. actuals by department and category. Calculate variance and explain key drivers.
Budget tracking & cost control
Simple prompts:
Are we staying within budget?
Which areas are driving costs up?
Deeper prompt:
Analyze budget vs. spend across departments. Identify overspending trends and recommend cost-saving opportunities.
Data blending: Sheets + accounting systems (Stripe, ProfitWell)
Use case: Combine financial models with real accounting data.
Simple prompts:
Do our models match actual financial data?
Where are the discrepancies?
Deeper prompt:
Compare Sheets-based forecasts with accounting system data. Highlight mismatches in revenue, expenses, and cash flow.
Cash flow & runway analysis
Simple prompts:
How much runway do we have?
Are we burning too fast?
Deeper prompt:
Analyze cash flow trends, burn rate, and runway. Forecast future cash position and highlight financial risks.
Revenue & profitability analysis
Simple prompts:
Which products or segments are most profitable?
Where are we losing money?
Deeper prompt:
Analyze revenue, costs, and margins by segment or product. Identify profitability drivers and areas for improvement.
Executive reporting
Simple prompts:
Summarize this month’s financial performance.
What should leadership focus on to reduce spend while maximizing the revenue?
Deeper prompt:
Generate an executive summary with key insights, risks, and recommendations based on financial data.
Bonus: Blending Google Sheets data with other business sources
Google Sheets often holds the context that formal systems lack: targets, plans, and manually curated lists. When you combine that with live data from ad platforms, CRMs, or databases, you get analysis that neither source could produce alone.
Windsor connects your Sheets alongside 350+ other data sources, all queryable in a single Claude conversation.
Some of the most useful combinations:
- Sheets budget plan + Google Ads/Meta Ads: Compare planned media spend against live platform performance. Find which campaigns are pacing over budget or missing CPA targets before the month ends.
- Sheets KPI targets + Salesforce CRM: Set quarterly targets in Sheets, pull actuals from Salesforce. Ask Claude to calculate attainment, flag gaps, and generate the QBR narrative.
- Sheets headcount plan + BambooHR or Rippling: Match approved headcount in Sheets against actual hires in your HRIS. Surface open roles, time-to-fill delays, and budget impact of vacancies.
- Sheets content calendar + GA4 or Search Console: Cross-reference your planned content against actual organic traffic and conversions. Which pieces outperformed their traffic targets? Which need to be updated or promoted?
- Sheets agency report + ad platform data: Agencies deliver monthly reports in spreadsheets. Connect those to live platform data and ask Claude to verify the numbers, flag discrepancies, and identify what the agency didn’t highlight.
- Sheets pricing model + Stripe or Chargebee: Maintain a pricing model in Sheets, pull real revenue and subscriber counts from your billing system. Ask Claude to show where actual revenue is diverging from model assumptions.
✨ Forget manual data joining. Connect your data sources to Windsor.ai at https://onboard.windsor.ai/, and Windsor MCP automatically streams a unified, analysis-ready dataset to Claude for cross-channel insights.
Why use Windsor to connect Google Sheets to Claude
Connect, blend, analyze, and act on your Google Sheets data in Claude with Windsor’s write-enabled MCP connector.
Here’s how Windsor.ai transforms your reporting and analytical workflows:
- Live data, not snapshots. Windsor reads your sheets in real time. When someone updates the budget tracker or adds a row to the pipeline sheet, the next Claude conversation sees the current version; no re-upload or manual refresh is needed.
- Multiple sheets in one conversation. Connect several spreadsheets at once. Claude can join data across sheets in a single prompt, matching rows by a shared column, aggregating across tabs, or comparing two separate trackers.
- Cross-source analysis. Sheets connects alongside any of Windsor’s 350+ other data sources. A Sheets budget plan + live Google Ads data is a two-minute setup, not a month-long engineering project.
- No formula knowledge required. Ask the question in plain English. Claude handles the aggregation, comparison, and trend analysis under the hood, removing the need for using VLOOKUP, SUMIF, or pivot tables.
- Outputs stakeholders can actually use. Claude returns answers in plain language, with structured tables and summaries formatted for Slack messages, executive briefings, or meeting prep.
- From insights to action, without switching tools. With the Windsor MCP connector, spotting a problem and acting on it happen in the same conversation. No jumping to ad managers, no manual updates; just ask Claude to execute, and it’s done.
Why Google Sheets is different from other data sources
Most data sources Windsor connects to (Meta Ads, GA4, Salesforce, Google Ads, Instagram, etc.) have a fixed schema. The fields are pre-defined.
Google Sheets is the opposite: it holds whatever your team decides to put in it.
That’s actually its strength. Your spreadsheets might contain the data that doesn’t live anywhere else:
- Manually entered budgets and targets that never made it into the CRM
- Agency reports pasted in monthly from email attachments
- Offline event data, trade show leads, or partner submissions
- Financial models, headcount plans, and hiring trackers
- Custom KPI dashboards assembled by ops teams from multiple sources
With Windsor MCP, all these become the data Claude can now read, analyze, and cross-reference, including against live data from other Windsor-connected sources.
Conclusion
Google Sheets isn’t going away. It’s where teams continue to do their most flexible, day-to-day work. The challenge has always been the analysis ceiling: formulas break, pivots take time, and turning raw numbers into insights still requires hours of manual effort.
With Windsor MCP, Claude gets live access to your spreadsheets and can combine them with any other data source your business uses. Budget trackers, pipeline sheets, agency reports—they’re all queryable in plain English, blendable with live data, and ready in seconds.
🚀 Connect your first Google Sheets to Claude with Windsor MCP in less than 1 minute. Get started for free: onboard.windsor.ai/app/googlesheets.
FAQs
What are the ways to connect Google Sheets to Claude?
Three main methods to connect Google Sheets to Claude include:
- Windsor MCP (recommended): Direct no-code connector for Claude. Connect your Google Sheets at onboard.windsor.ai and add Windsor as a Claude connector. Live data, multi-sheet joins, and cross-source blending are all included.
- Manual upload: Download a sheet as CSV and upload it directly to Claude. Works for one-off questions, but data is immediately stale, and there’s no cross-source blending.
What is the easiest way to connect Google Sheets to Claude?
Windsor MCP. You connect your Google Sheets to Windsor.ai and install the Windsor.ai connector in Claude’s settings once, and your sheets are live in every Claude conversation from that point on.
Can Claude read multiple Google Sheets at once?
Yes. Connect as many sheets as you need in Windsor, and Claude can query across all of them in a single conversation, joining rows by a shared column, comparing data across separate files, or aggregating across multiple trackers.
Can I blend my Google Sheets data with data from other tools?
Yes, this is one of Windsor’s most valuable features. Connect your Google Sheets alongside any of Windsor’s 350+ other integrations (Google Ads, Salesforce, Stripe, GA4, etc.) and Claude can join them in a single prompt.
How often does Windsor refresh data from Google Sheets?
Windsor reads your sheet data in real time each time Claude needs it. There’s no scheduled refresh or cache to manage; when you ask a question, Windsor pulls the current state of your spreadsheet at that moment.
Do I need to know formulas or SQL to use this integration?
No. Claude interprets your Sheets in human language, performing aggregations, comparisons, and trend analysis automatically.
Is this integration free?
Yes. Windsor has a free forever plan; no credit card required. You can connect Google Sheets to Claude and start analyzing your data at no cost. Paid plans start at $19/mo and unlock additional data sources and higher limits.
What type of insights can Claude provide?
From budget variance, pipeline risk, ROAS/CAC analysis, to cohort and retention metrics—Claude provides plain-language answers, structured tables, and summaries.
Is my data secure when I use Windsor MCP for Claude?
Windsor MCP follows enterprise-grade security protocols, ensuring your spreadsheets and other connected sources are safe and untouched.

