 AI insights
 About us
 Careers
 Security
 Customer reviews
 Contact us
 Affiliate program
 Solution partners
 Looker Studio templates
 Tableau templates
 Facebook Ads templates
 Google Ads templates
 Data fields & Metrics
 AI prompt library & Guides
 Product documentation
 API documentation
 Case studies
 Blog
Blog Data models
 Windsor vs Supermetrics
 Windsor vs Fivetran
 Windsor vs Portermetrics
 Last updated: 26 June 2026

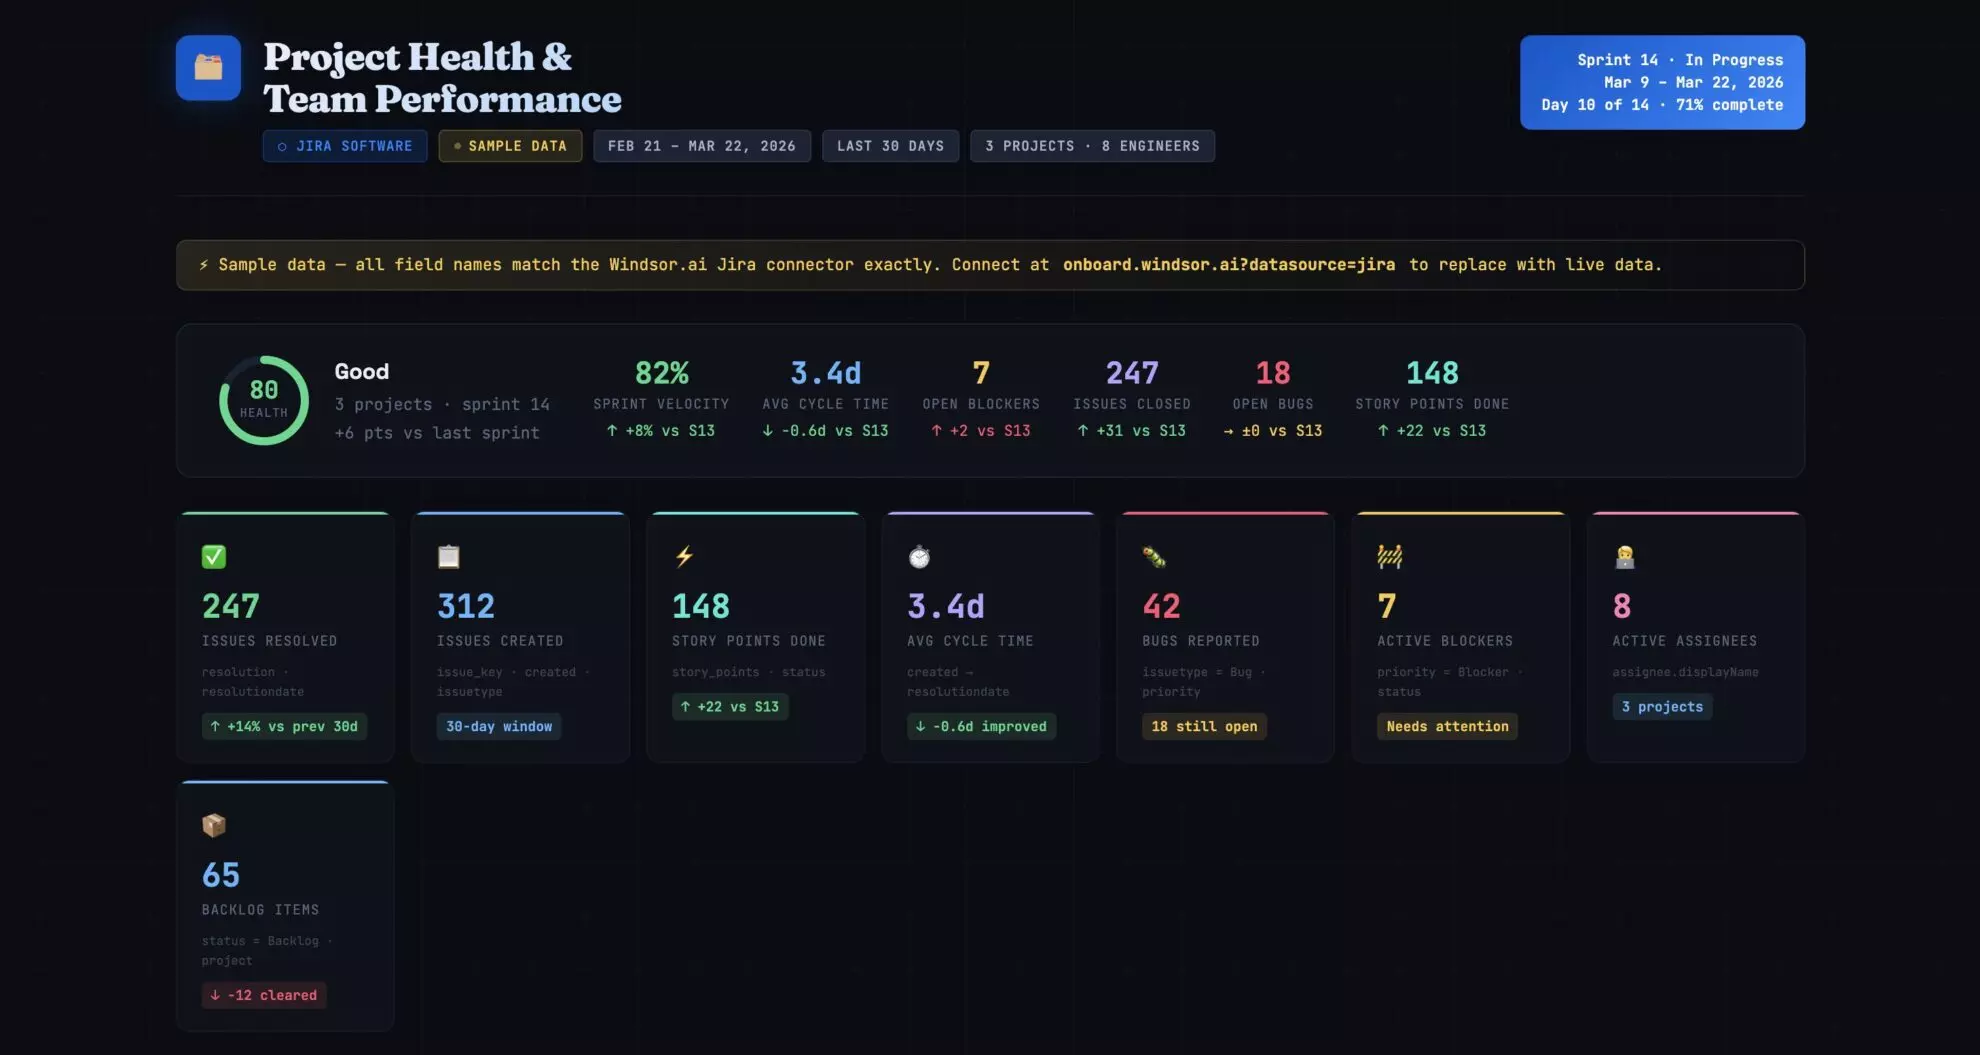
Product teams generate more structured data than almost anyone else in the company. Every issue created, every sprint planned, every bug filed, every status update, and every time entry — all captured in Jira with timestamps, assignees, priorities, and more.
Yet, answering even simple delivery questions, such as whether we are shipping faster or slower, which team member is overloaded, or how many bugs are slipping into production, often requires mastering JQL, building custom dashboards, or waiting for someone to pull a report.
The data is there. But the insights are buried.
Luckily, you can directly connect Jira to Claude to unlock AI-driven analysis and reporting. There are multiple ways to do this.
Atlassian’s native MCP connector is useful for developers querying or creating Jira tickets directly from their IDE.
But for engineering managers, product managers, and Scrum masters who want a full picture across sprints, teams, and other business tools, Windsor MCP provides a comprehensive, cross-source solution.
🚀 Connect Jira along with your business stack to Claude with Windsor MCP. Get started for free → onboard.windsor.ai/app/jira.
Once Jira is integrated with Claude, you can instantly ask questions such as:
- What is our average cycle time from In Progress to Done over the last 8 sprints, and is it trending up or down?
- Which team members have the most open issues assigned to them right now, and how many are blocked?
- How many bugs were reported in production last month, and which components do they belong to?
- Which epics are furthest behind their estimated completion date?
Windsor MCP acts as a bridge between your Jira projects and Claude, letting you generate insightful summaries, cross-project comparisons, and actionable visualizations in under a minute, with no custom API setup or analyst bottlenecks.
3 steps to connect Jira to Claude with Windsor MCP
Windsor MCP automatically integrates Jira into Claude, with no Node.js, config files, or developer work needed.
📖 Full documentation: windsor.ai/documentation/windsor-mcp/how-to-integrate-data-into-claude/.
Prerequisites
Before connecting Jira to Claude, make sure you have the following:
- A Windsor.ai account (free or paid plan, from $19/month)
- A Jira Cloud account with API token access
- A Claude account
Step 1. Connect Jira to Windsor.ai
Go to onboard.windsor.ai/app/jira and select Jira as your data source. Add your Jira account(s) by entering the Domain, Email associated with your Jira project, and API Token.

Step 2. Add Windsor as a connector in Claude
In Claude, open the Windsor.ai connector and add it with the Connect button.
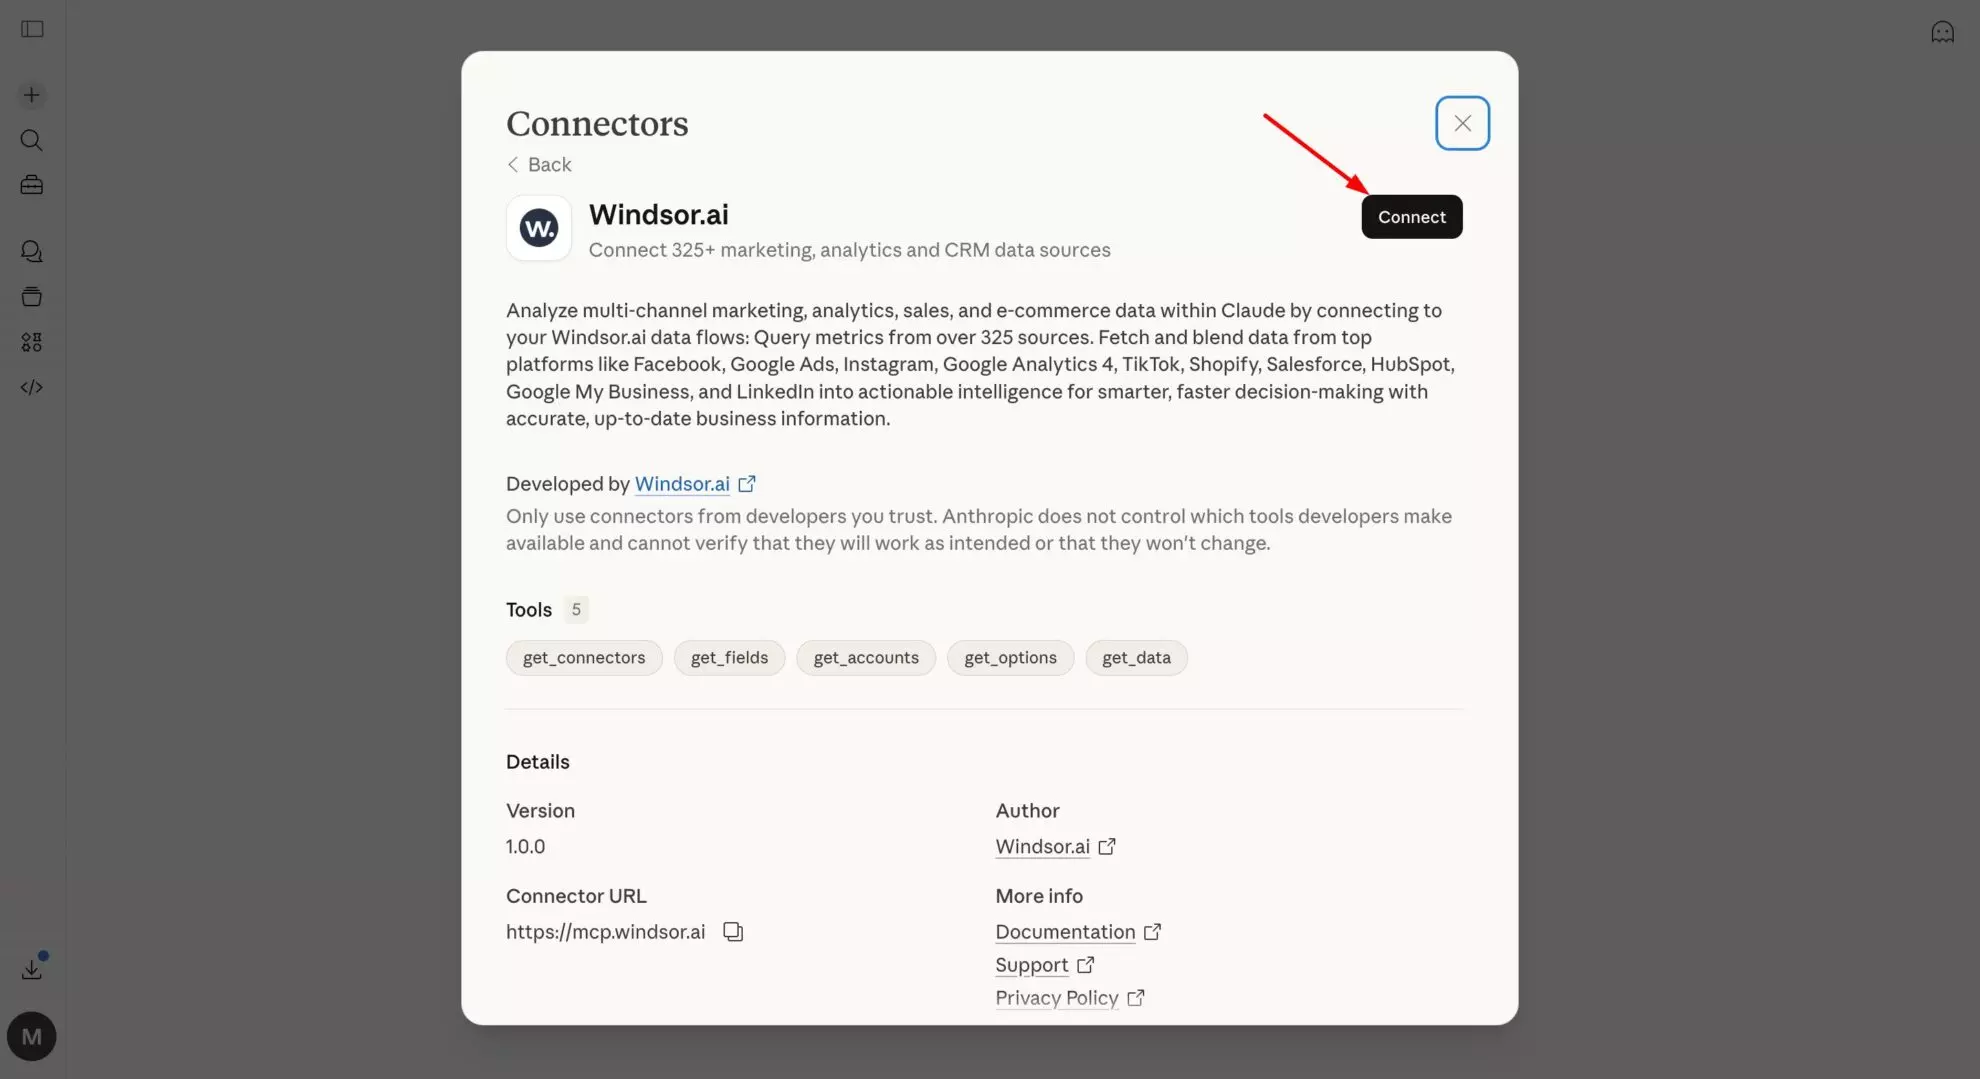
Optionally, set the permission to “Always allow” so your Jira data is live in every Claude conversation automatically; you won’t need to re-connect each time.
Step 3. Start querying your Jira data in Claude
Open a new Claude conversation and start with a quick test prompt to confirm the connection is working:
Connect to Windsor MCP and list all the data sources connected to my account. Do you see any Jira projects available?
Once you’ve confirmed the data is flowing, move on to deeper analysis.
What you can do with Jira data in Claude: Prompt ideas
These prompts give you a starting point for various common analytical use cases. Just replace project names, field names, and thresholds with the ones that match your Jira setup.
Sprint performance: understanding delivery trends over time
Jira’s sprint reports show you one sprint at a time. Claude can analyze all your sprints together, surfacing velocity trends, commitment accuracy, and patterns that don’t appear in any single sprint view.
Velocity trend: are we getting faster, slower, or inconsistent
Prompt idea:
Using Jira sprint data for the last 8 completed sprints in [project name]:

For each sprint, show:
- Sprint name and end date
- Story points committed (at sprint start)
- Story points completed
- Completion rate (completed / committed %)
- Number of issues carried over to the next sprint

Calculate average velocity and average completion rate across all 8 sprints.

Is velocity trending up, down, or flat over this period?
Which sprint had the worst completion rate, and how many issues were carried over from it into the following sprint?
Sprint commitment accuracy: are estimates getting better or worse?
Prompt idea:
For the last 6 sprints in [project name], compare committed story points at sprint start vs. completed story points at sprint end.

Calculate:
- Over-commitment rate: sprints where committed > completed by more than 20%
- Under-commitment rate: sprints where completed > committed by more than 20%
- Average estimation error (absolute difference between committed and completed)

Is estimation accuracy improving over time or deteriorating?
Are there specific issue types (Bug, Story, Task) that are most commonly the source of incomplete sprint work?
Cycle time and flow efficiency: finding where work gets stuck
Velocity tells you how much you deliver. Cycle time tells you how long it takes. The gap between the two, and what causes it, is where the real delivery intelligence lives. And that’s what Claude can help you with.
Cycle time by issue type: what takes longest and why
Prompt idea:
Using Jira issue data for all issues resolved in the last 90 days in [project name]:

For each issue type (Story, Bug, Task, Sub-task):
- Average cycle time from status 'In Progress' to 'Done' (in days)
- Median cycle time
- 90th percentile cycle time (the long tail)
- Count of issues resolved

Which issue type has the longest average cycle time?

Which has the widest spread between median and 90th percentile — high variance signals unpredictability in that work category.

Are bugs resolved faster or slower than stories on average?
Workflow bottleneck: in which status do issues spend the most time?
Prompt idea:
For all issues transitioned through your workflow in the last 60 days:

For each status (To Do, In Progress, In Review, QA, Blocked, Done):
- Average time issues spent in that status (in hours or days)
- Count of issues that passed through it
- Count of issues currently sitting in it

Which status has the longest average dwell time?

Are there issues that have been sitting in 'In Review' or 'QA' for more than 5 business days? List the top 10 by time in status.

What proportion of total cycle time is spent waiting vs. active work?
Blocked issues: what is holding up delivery right now?
Prompt idea:
Find all issues in [project name] currently marked as Blocked or with a 'impediment' flag:

For each blocked issue:
- Issue key and summary
- Assignee
- How many days it has been blocked (created date of blocker or date status was set to Blocked)
- Current sprint (if in one)
- Priority

How many total story points are blocked across all active sprints?

Which team member has the most blocked issues assigned to them?

Are any blocked issues on the critical path for an upcoming release?
Bug tracking and quality: measuring what’s escaping to production
Bug data in Jira is one of the most underanalyzed assets an engineering team has. Patterns in bug origin, component, and resolution time reveal far more than any single bug count, but finding those patterns usually means building a custom filter or exporting to a spreadsheet.
Claude does it in a prompt.
Bug escape rate: how many bugs are reaching production?
Prompt idea:
Using Jira bug data for the last 6 months in [project name]:
- Total bugs reported per month
- Bugs labelled or tagged as 'production' or 'escaped' (vs. caught in QA) — (use your team's label convention)
- Bug escape rate: production bugs as % of total bugs per month
- Average time to resolve production bugs vs. QA-caught bugs

Is the bug escape rate improving or worsening month-over-month?

Which months had the highest escape rate — do they correlate with release dates or sprint end dates?
Bug source analysis: which components generate the most issues
Prompt idea:
For all bugs created in the last 90 days across [project name]:

Group by component (or label if components aren't used):
- Total bug count per component
- % of total bugs
- Average priority level (assign numeric value: Blocker=4, Critical=3, Major=2, Minor=1 — calculate weighted average)
- Average days to resolve

Which component generates the most bugs?

Which generates the highest-severity bugs on average?

Is there a component where bugs are resolved significantly slower than the rest — a signal of complexity or ownership ambiguity?
Recurring issues: are the same bugs coming back?
Prompt idea:
Look for patterns in resolved bugs from the last 6 months:
- Are there bugs with similar summaries or labels that have been filed multiple times (recurrence pattern)?
- Which components have the most re-opened issues (status moved back from Done to In Progress or Reopened)?
- What is the re-open rate across all resolved bugs (re-opened / total resolved)?

Flag any component where the re-open rate exceeds 15% — that suggests fixes are not addressing root causes.
Backlog health and epic progress: keeping the roadmap honest
Backlog aging: how old is your unstarted work
Prompt idea:
For all issues in [project name] with status 'To Do' or 'Backlog':
- Total count and total story points (estimated)
- Average age (days since created)
- Issues older than 90 days: count, % of total backlog, list of top 10 by age with summary and priority
- Unestimated issues (no story points): count and % of backlog

Is there a pattern in the oldest backlog items — are they all a particular issue type, component, or label?

What is the oldest unstarted issue in the backlog?

If the team maintains current velocity, how many sprints would it take to clear the backlog as it stands today?
Epic progress: which initiatives are on track vs. slipping
Prompt idea:
For all active epics in [project name]:

For each epic, show:
- Epic name and target end date (if set)
- Total child issues
- Issues completed (status = Done)
- Issues in progress
- Issues not started
- Completion % (Done / Total)
- Story points completed vs. total estimated

Which epics are more than 20% behind where they should be given elapsed time vs. target date?

Which epics have the most unestimated child issues — a risk to accurate forecasting?

Are there epics with no activity (no status changes) in the last 14 days?
Team workload: who has too much and who has capacity
Workload imbalance is one of the most common causes of delivery slowdowns and one of the hardest things to see clearly in Jira without building a custom assignee report for each sprint.
Claude surfaces it instantly.
Current workload distribution: is work spread evenly?
Prompt idea:
For all open issues in [project name] currently in active sprints:

For each assignee, show:
- Total open issues assigned
- Total open story points (estimated)
- Breakdown by issue type (Stories, Bugs, Tasks)
- Count of issues with priority Blocker or Critical
- Count of issues with status Blocked

Who has the highest total story point load?

Is there a team member with significantly more Blocker/Critical issue  than others — indicating they may be the bottleneck on urgent work?

Are there any unassigned issues in the active sprint?
Individual throughput: who is consistently delivering?
Prompt idea:
For all issues resolved in the last 60 days in [project name]:

For each assignee:
- Total issues resolved
- Total story points delivered
- Average cycle time (days from In Progress to Done)
- Issue type breakdown of resolved work

Who has the highest throughput by story points?

Is there a meaningful difference in average cycle time between team members — and does it correlate with issue type or complexity?

Are there team members with high assignment counts but low resolution counts — a sign of context-switching or blocking issues?
Bonus: Blending Jira with other data sources
Jira’s delivery data is most powerful when combined with business context that lives elsewhere: customer feedback, website analytics, or lead generation impact.
🔗 Windsor connects Jira alongside 350+ other sources so Claude can answer questions that cross system boundaries.
Here are some powerful data blending combinations to try:
- Jira + GitHub or GitLab: Connect issue resolution to code activity. Which Jira tickets correspond to the most commits? Are there PRs that have been open for weeks with no linked Jira resolution? Which sprints had the highest commit volume but lowest issue close rate — a signal of untracked work or rework?
- Jira + Salesforce or HubSpot: Link customer-reported bugs to pipeline risk. If a customer with a $200k renewal has three open Critical bugs in Jira, that’s a churn signal. Connect CRM account data with Jira issue labels or customer tags to surface those risks before the renewal conversation.
- Jira + Zendesk or Intercom: Match support ticket volume against Jira bug reports. Which components generate the most support tickets and the most bugs simultaneously? If a feature area is producing both, that’s a product quality problem with a measurable customer impact — quantifiable by support volume, not just bug count.
- Jira + Google Sheets: Engineering and product teams often maintain capacity plans, roadmap timelines, and headcount models in spreadsheets. Connect those alongside Jira to ask Claude: Does our actual sprint velocity support the delivery dates we’ve committed to in the roadmap? Which epics are at risk given the current throughput?
- Jira + Slack: Correlate message volume and channel activity with sprint periods. Do teams generate significantly more Slack messages in the week before a sprint ends — a proxy for crunch and fire-fighting? Does that correlate with lower completion rates in those sprints?
What Jira data Windsor MCP makes available in Claude
The Windsor.ai Jira connector is a powerhouse for engineering and product management, providing 200+ metrics and dimensions directly to Claude for real-time analysis. View all supported data fields.
| Jira data | What Claude can answer with it |
| Issues & Tasks | Issue counts by status, assignee, and priority; backlog sizing; and “stale” issue detection. |
| Sprints & Velocity | Sprint commitment vs. completion rates, velocity trends, and carry-over analysis. |
| Status & Transitions | Cycle time (created to resolved), time-in-status, and workflow bottleneck identification. |
| Assignees & Teams | Workload distribution, individual throughput, and “bus factor” risk assessment. |
| Epics & Hierarchy | Epic progress tracking, story count per epic, and roadmap-level delivery health. |
| Fix versions | Release readiness, bug counts per version, and post-launch stability analysis. |
| Story points | Estimation accuracy, velocity calculation, and unestimated backlog audits. |
| Worklogs (time tracking) | Actual vs. estimated hours, effort efficiency, and labor cost allocation. |
| Components & Labels | Bug source analysis and feature-area performance clustering. |
Key Jira fields Windsor sends to Claude
Windsor maps Jira’s complex relational schema into AI-ready fields. Below are the most critical dimensions Claude uses for delivery intelligence:
issue_key,issue_summary,issue_description: The primary identifiers. Claude uses these to cluster similar bugs, summarize project status, and generate human-readable reports.issue_type_name: Separates Stories, Bugs, Tasks, and Epics. Essential for calculating your “Innovation vs. Maintenance” ratio.issue_status_name&status_category_name: Current workflow position. Claude uses these to flag items stuck in “QA” or “In Review” longer than the team average.issue_priority_name: Used to prioritize the “Critical Path” and identify high-severity blockers in active sprints.assignee_display_name&creator_display_name: Person-level dimensions for workload balancing and accountability audits.issue_created&issue_resolutiondate: The foundation of speed metrics. Claude calculates Lead Time and Cycle Time using these timestamps.sprint_name&sprint_state: Allows Claude to distinguish betweenactive,closed, andfuturesprints for historical trend mapping.issue_aggregate_time_original_estimate&issue_aggregate_time_spent: If your team logs time, these fields allow Claude to perform deep Estimated vs. Actual effort analysis.issue_epic_key&issue_parent_key: Essential for maintaining hierarchy. These fields allow Claude to roll up individual tasks into a “Big Picture” Epic progress report.project_name&project_key: Enables multi-project analysis—perfect for CTOs managing several product lines at once.issue_labels&issue_components_name: The primary ways Claude clusters data are by product architecture or freeform tags.
Atlassian’s native Jira connector vs. Windsor MCP — which one to use?
Atlassian built and maintains an official MCP server for Jira, and it’s a legitimate option worth knowing about.
But when comparing it to Windsor MCP, keep in mind that these two tools solve different problems for different users.
Here’s an honest breakdown.
The Atlassian MCP server
Atlassian’s native connector lives at mcp.atlassian.com and is designed primarily for developers using Jira inside their coding environment: Claude Code, Cursor, and VS Code. Its key capability is bidirectional access: it can read Jira data and write back to it, letting developers create issues, update statuses, add comments, and manage tickets without leaving their IDE.
If you’re a software engineer who wants to create a Jira ticket from a bug you just found in the code, or update an issue status while reviewing a PR, the native connector is built for that workflow.
Where it has limitations:
- Developer-first setup: Requires Node.js v18+, a local MCP proxy, and manual config file editing. Not accessible to a product manager or engineering manager without technical help.
- Auth instability: The native connector uses short-lived OAuth tokens that expire mid-session. Multiple users in the Atlassian community report needing to re-authenticate several times a day, which becomes a common complaint in production use.
- Jira and Confluence only: The native connector gives Claude access to Atlassian data only. There is no automated way to blend Jira issues with Salesforce pipeline data, Google Ads spend, Zendesk tickets, or any other business tool in the same conversation. You have to install MCPs for all these data sources separately.
- Deprecated endpoint: The original SSE endpoint (mcp.atlassian.com/v1/sse) is being retired after June 30, 2026. Any setup using the old endpoint needs migration.
Windsor MCP for Jira
Windsor MCP is primarily built for analysis, not task management. The target user is not a developer querying their own tickets; it’s an engineering manager, product lead, or Scrum master who wants to understand delivery patterns across their entire team or portfolio.
The key differences:
- No-code setup: Connect your data sources at onboard.windsor.ai. No Node.js, no config files, no technical knowledge needed. Setup takes under a minute.
- Persistent, stable connection: Windsor uses a server-side connection with no token expiry mid-session. Set it up once, and your Jira data is live in every Claude conversation permanently.
- Cross-source data blending: This is Windsor’s defining advantage. Connect Jira alongside Salesforce, Google Ads, Zendesk, GitHub, Google Sheets, or any of Windsor’s 350+ other integrations — all queryable in a single Claude conversation. Ask Claude to correlate open critical bugs with customer accounts at churn risk, or compare sprint velocity against the marketing pipeline to assess whether the product team is keeping pace with sales commitments. None of that is possible with the native connector.
In short: if you’re a developer who wants to manage Jira tickets from your IDE, the Atlassian native connector is the right tool. If you’re a manager or analyst who wants to understand your team’s delivery data and blend it with everything else happening in the business, Windsor is the better fit.
Conclusion
Jira holds a detailed, timestamped record of how your engineering team works — what they build, how long it takes, where it gets stuck, and what keeps breaking. The irony has always been that the team generating the most structured data in the company has some of the least accessible analytics about their own work.
Connecting Jira to Claude via Windsor MCP changes that. Sprint velocity, cycle time, bug escape rates, backlog aging, workload distribution, and epic progress are all available in Claude in plain language. No JQL. No custom dashboard. No waiting.
And when the answer requires context from outside Jira, like a customer account at risk, a GitHub PR sitting unmerged, or a capacity plan in a spreadsheet, Windsor connects those too.
🚀 Connect Jira and other business tools to Claude with Windsor MCP in less than 60 seconds. Start for free now!
FAQs
What are the ways to connect Jira to Claude?
There are a few existing ways to connect Jira and Claude, each suited to a different use case:
- Windsor MCP (recommended for analytics): No-code. Connect your Jira Cloud instance at onboard.windsor.ai via API Token, then add Windsor as a connector in Claude. Designed for delivery analysis, cross-sprint reporting, and blending Jira data with other tools. Stable persistent connection. Setup in under a minute.
- Atlassian Rovo MCP Server (recommended for developers): Atlassian’s official native connector at mcp.atlassian.com. Designed for developers using Jira inside Claude Code, Cursor, or VS Code. Supports bidirectional access — read and write to Jira. Requires Node.js v18+ and local proxy setup. Note: uses short-lived OAuth tokens that can require frequent re-authentication; the old SSE endpoint is deprecated after June 30, 2026.
- Manual export: Export a Jira filter as CSV and upload to Claude for one-off questions. Works in isolation, but data is immediately stale, cross-sprint comparison is not possible, and blending with other sources requires manual work.
What is the easiest way to integrate Jira with Claude?
For analysis, covering sprint reporting, cycle time, delivery trends, and workload distribution, Windsor MCP is the easiest path. Go to onboard.windsor.ai/app/jira, connect your Jira account, select your projects, and add Windsor as a connector in Claude. No technical setup, no token management, no re-authentication. Done in under a minute.
For developers who want to create or update Jira tickets from within Claude Code or an IDE, Atlassian’s native Rovo MCP Server is the direct rout, though it does require Node.js and local config setup.
What’s the difference between Atlassian’s native MCP connector and Windsor MCP?
They solve different problems for different users:
- Atlassian Rovo MCP Server: Built for developers. Bidirectional — can read and write Jira data. Designed for IDE workflows (Claude Code, Cursor, VS Code). Requires Node.js and local setup. Uses short-lived OAuth tokens that require re-authentication. Jira and Confluence only — no cross-source blending.
- Windsor MCP: Built for analytics. Designed for browser-based claude.ai — no install required. Stable persistent connection. Combines Jira with 350+ other data sources in the same Claude conversation: Salesforce, Google Ads, Zendesk, GitHub, Google Sheets, and more. Suited to engineering managers, product leads, and Scrum masters doing delivery analysis rather than ticket management.
The simplest guide: if you want to manage Jira tickets from an IDE, use the native Atlassian connector. If you want to analyse your team’s delivery data and blend it with everything else happening in the business, use Windsor MCP.
Do I need Jira admin permissions to connect Windsor?
No. Windsor requires only standard user-level access with Browse Projects permission on the projects you want to analyse. You do not need Jira admin rights to set up the integration. If you want to expose specific projects rather than your entire Jira instance, you can select which projects Windsor accesses during the setup flow.
Can Windsor access custom fields in Jira?
Yes. Windsor makes custom fields available to Claude alongside standard Jira fields. This includes custom story point fields, team labels, customer tags, business value scores, severity ratings, and any other custom field your team has configured. Reference them in prompts using the same field name they have in your Jira configuration.
Can I analyze multiple Jira projects in one Claude conversation?
Yes. You can connect multiple Jira projects to Windsor and query across all of them in a single Claude conversation. This is particularly useful for engineering managers overseeing several teams, or for cross-project comparisons like velocity benchmarking or bug rate comparison between product areas.
Can I blend Jira data with GitHub, Salesforce, or Zendesk?
Yes. Windsor connects Jira alongside any of its 350+ supported integrations. Common combinations: Jira + GitHub for linking code commits to issue resolution, Jira + Salesforce to correlate open bugs with customer accounts at churn risk, and Jira + Zendesk to measure the support impact of product quality issues.
How fresh is the Jira data Windsor sends to Claude?
Windsor pulls Jira data in real time when Claude needs it to answer a question. There is no scheduled cache or refresh window; each time you ask a question, Windsor queries your current Jira state directly from the API. Sprint updates, newly resolved issues, and status changes are reflected immediately in the next Claude conversation.

