 AI insights
 About us
 Careers
 Security
 Customer reviews
 Contact us
 Affiliate program
 Solution partners
 Looker Studio templates
 Tableau templates
 Facebook Ads templates
 Google Ads templates
 Data fields & Metrics
 AI prompt library & Guides
 Product documentation
 API documentation
 Case studies
 Blog
Blog Data models
 Windsor vs Supermetrics
 Windsor vs Fivetran
 Windsor vs Portermetrics
 Last updated: 26 June 2026

The answers are already in your database.
Which customers churned last month, and what did they have in common? Which product SKUs have a rising return rate that your merchandising team hasn’t noticed yet? Which user cohort converts fastest, and how does their acquisition cost compare to everyone else?
Your PostgreSQL tables hold all of it. The problem is that extracting those answers means writing custom SQL queries, joining tables, exporting results, and rebuilding the same analysis every time someone asks a slightly different question.
With Windsor MCP, you can build end-to-end PostgreSQL to Claude integration automatically and with no code. Windsor connects directly to your PostgreSQL database, links your actual tables and all their columns into Claude, and lets you ask questions in plain English. No query writing. No manual exports. Just an instant AI-powered conversation in human language.
🚀 Automate your PostgreSQL analysis in Claude with Windsor MCP. Try it free for 30 days.
Once connected, you can forget about building BI dashboards; instead, ask Claude things like:
- Which customers placed an order in Q4 but haven’t returned since?
- What is the average LTV by acquisition channel, broken down by cohort month?
- Which product categories have the highest refund rate over the last 90 days?
- Which ad campaigns drove users who actually converted, and what did it cost?
Claude gets data directly from your live PostgreSQL tables, analyzes across any columns those tables contain, and returns structured answers in seconds. It can also generate visual summaries, comparison tables, and visualizations, turning raw database data into insightful reports that your entire team, clients, or stakeholders can easily read.

3 steps to connect PostgreSQL to Claude with Windsor MCP
Windsor MCP acts as the bridge between your PostgreSQL database and Claude. Unlike source-specific connectors that expose a fixed field list, Windsor streams your actual database tables: every table, every column, including all custom fields your team has built. Claude sees the same schema that your engineers work with.
Setup takes three simple steps and involves zero engineering.
📖 Full documentation: How to integrate data into Claude with Windsor MCP.
Prerequisites:
- A Windsor.ai account (free or paid plan)
- PostgreSQL database credentials with read-only access (a dedicated read replica is recommended for production databases)
- A Claude account
Steps to connect PostgreSQL to Claude:
1. Go to onboard.windsor.ai and select PostgreSQL as your data source.

Enter your PostgreSQL connection credentials (host, port, database, user, and password). Windsor will automatically add your account.
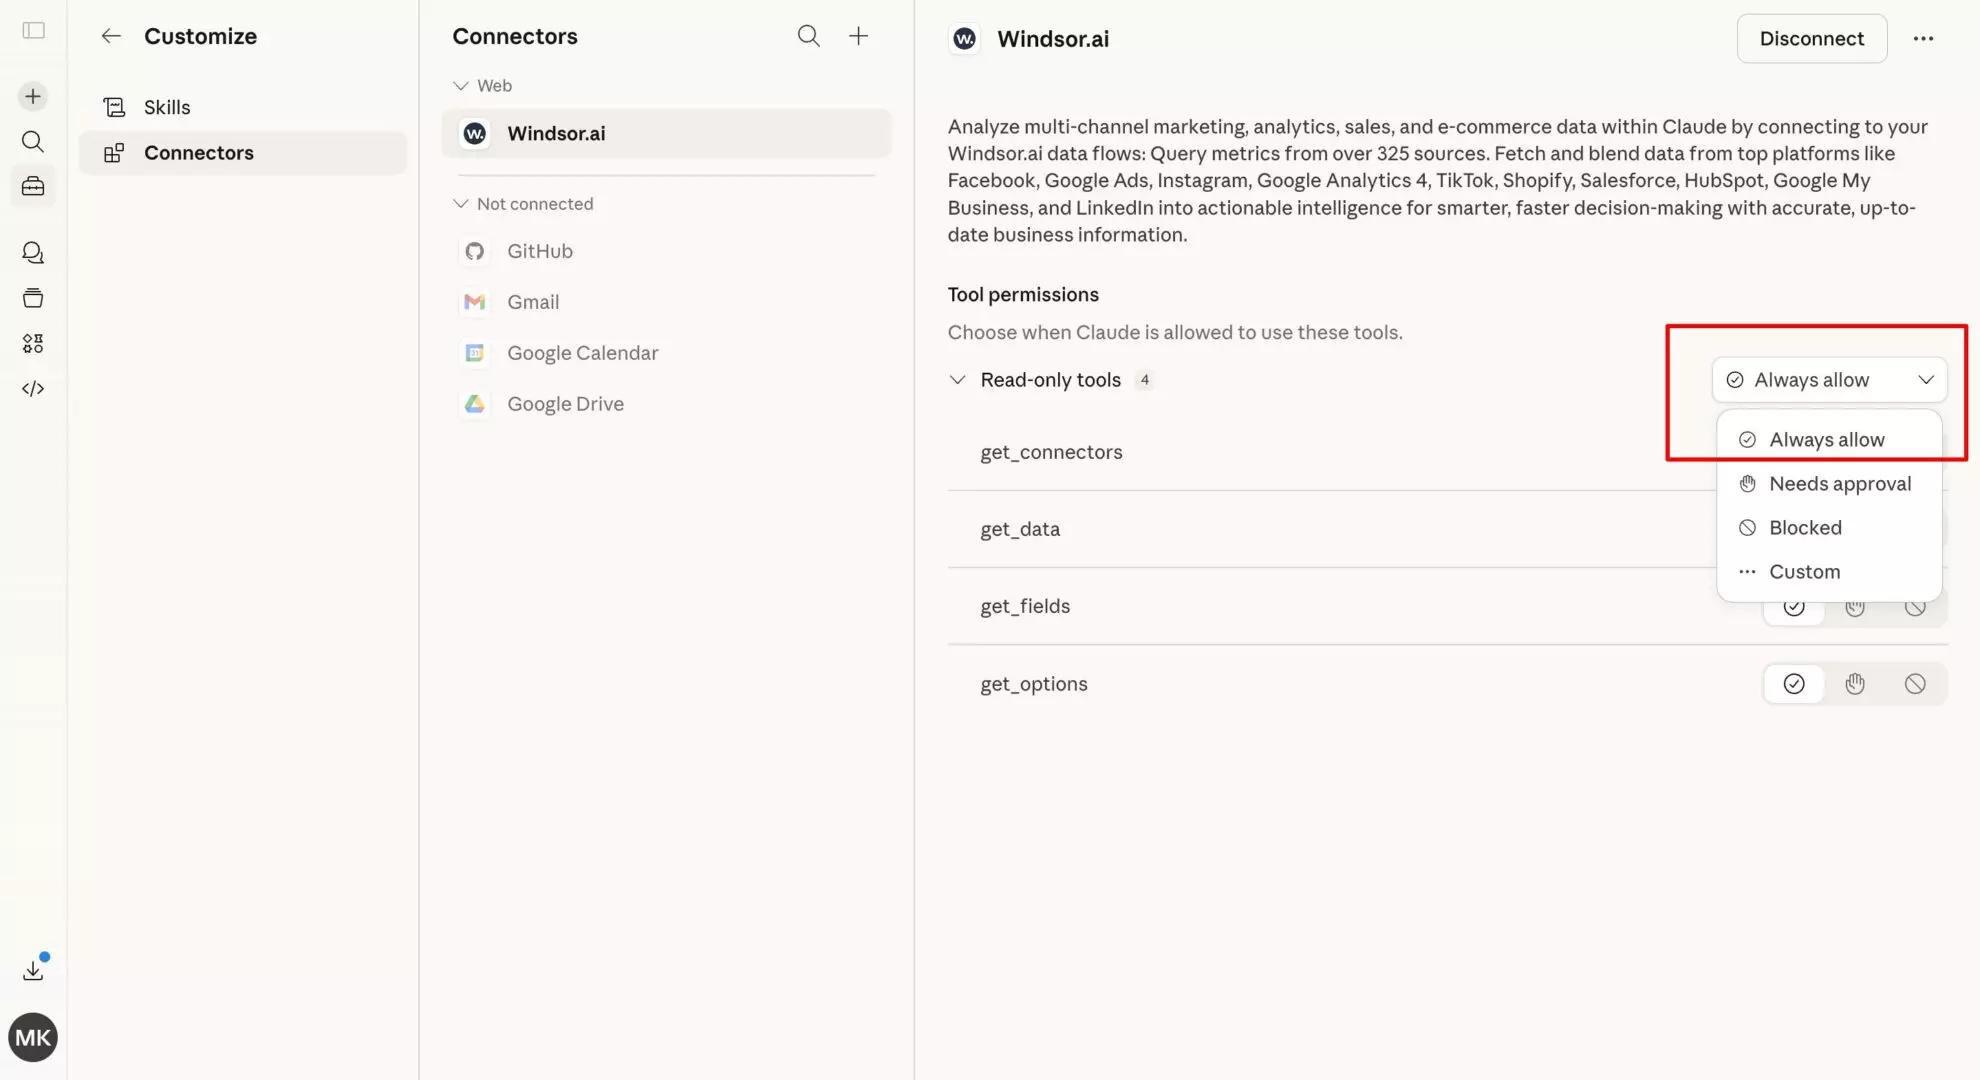
2. In Claude, open the Windsor.ai connector page and add it.
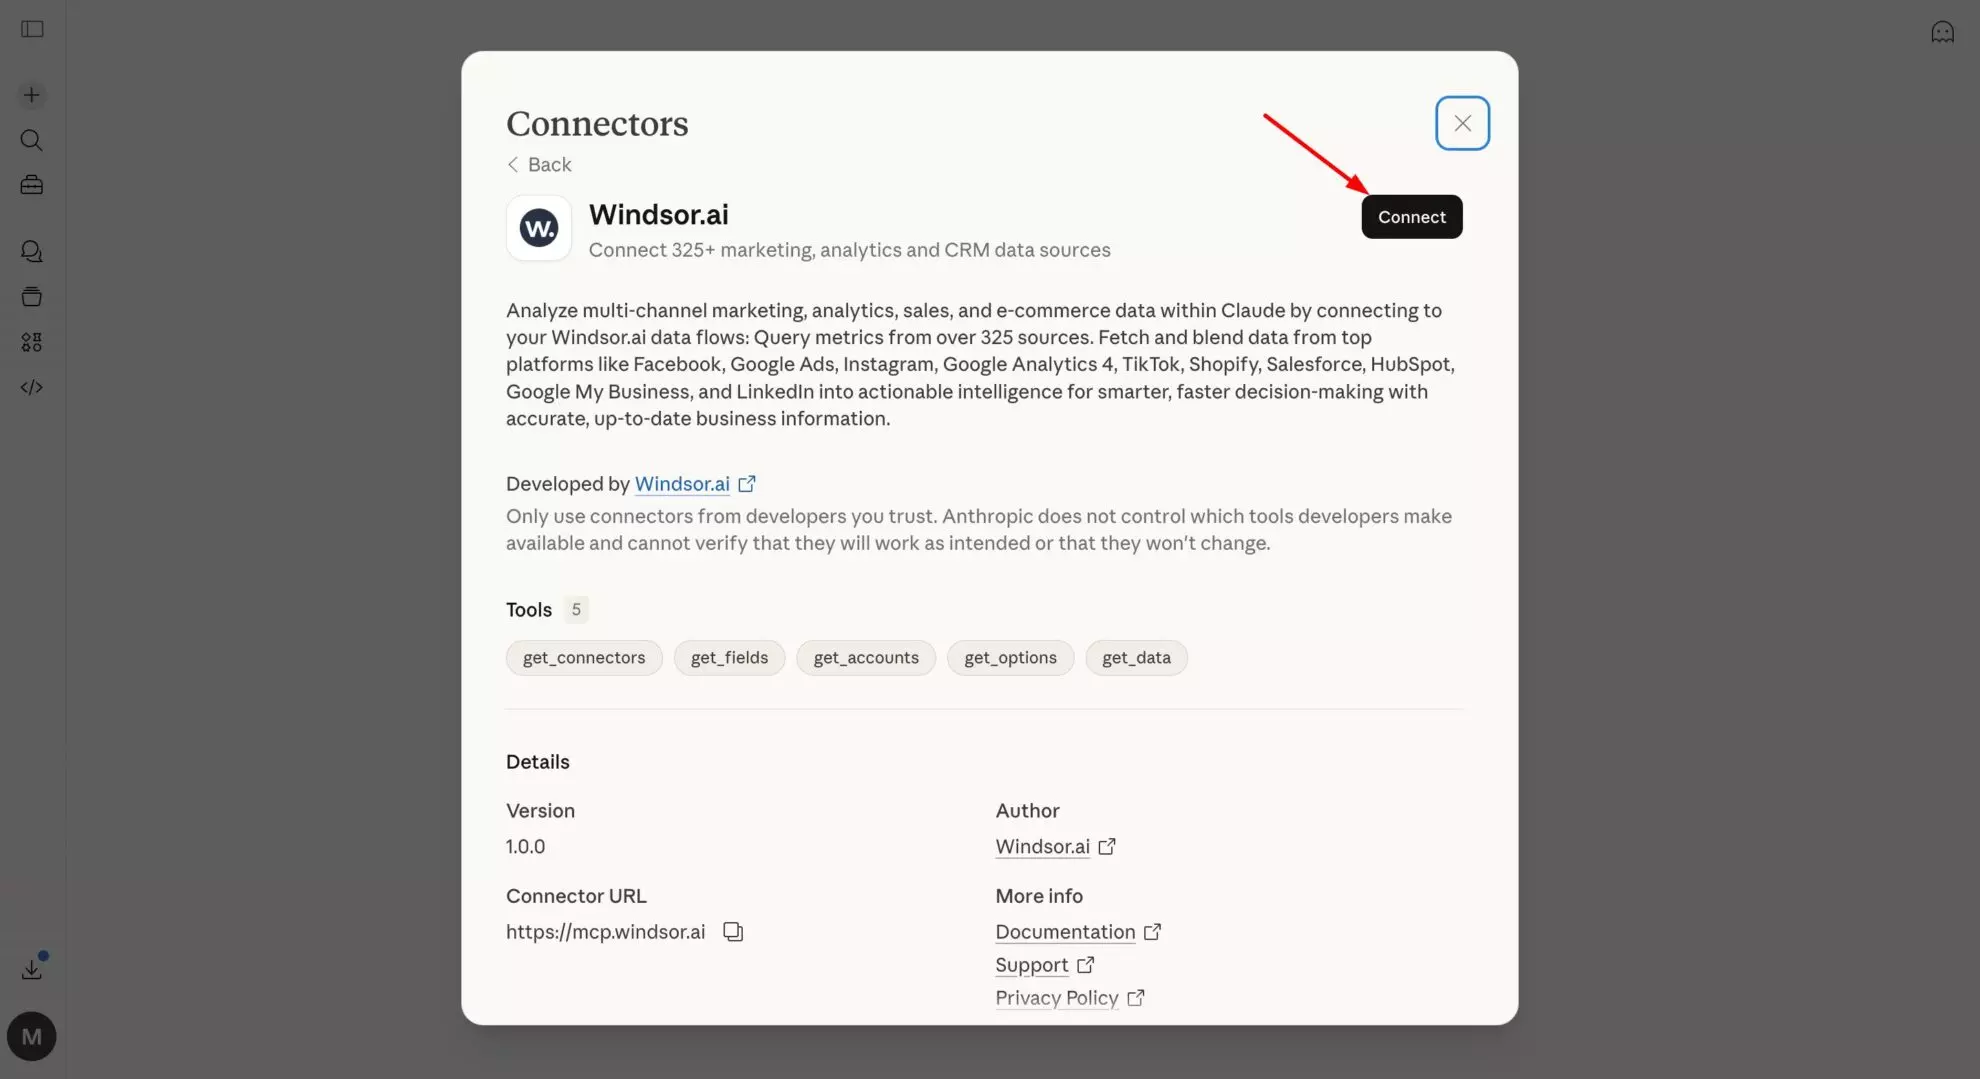
💡 Quick tip: Set permissions to “Always allow” so your database tables are live in every Claude conversation automatically. You can also ask Claude to retrieve only the tables relevant to your analysis, avoiding exposing your entire schema.
3. Start querying your PostgreSQL data in Claude. Begin with test prompts to confirm the connection, then move on to deeper questions based on your table data.
Here are some examples to try:
“Claude, analyze the
user_onboardingtable. At which step are most PostgreSQL-connected users dropping off, and how does this correlate with their initial sign-up source?”“Identify the top 5 ‘hidden gem’ campaigns in my
marketing_spendtable that have a low cost-per-acquisition but high lifetime value (LTV).”“Jin the data from my
shopify_ordersandgoogle_ads_conversionstables. Is there a discrepancy between reported ad sales and actual store revenue for March?”
Alternative method (dev-first setup)
If you want to have full control over your PostgreSQL data analysis, you need to use Claude Desktop.
First, install uv tool install mcp-proxy and add Windsor MCP via the config file:
{
  "mcpServers": {
    "windsor": {
      "command": "mcp-proxy",
      "args": ["https://mcp.windsor.ai/", "--transport=streamablehttp"],
      "env": { "API_ACCESS_TOKEN": "<your-windsor-api-key>" }
    }
  }
}
Save the file and restart Claude Desktop. Your PostgreSQL tables are now queryable in natural language.
How Windsor handles your PostgreSQL schema
This is the key difference between Windsor’s PostgreSQL connector and a standard field-based connector like Salesforce or Google Ads.
With field-based connectors, Windsor normalizes a fixed set of known fields and sends them to Claude.
With PostgreSQL, Windsor works differently:
- Windsor reads your actual table structure — table names, column names, data types, and relationships exactly as they exist in your database.
- Every column in every selected table becomes available — including custom fields, application-specific columns, and any schema changes your team makes over time.
- No schema mapping required — Windsor doesn’t require you to map your columns to a fixed field list. Claude works with your data as-is.
When you write a prompt that references, for example, “plan_type” or “onboarding_score,” Claude is working with your actual column names, not an alias Windsor assigned. This means:
- No translation layer — Claude interprets your schema directly.
- No field mapping step — connect your database, select your tables, start asking questions.
- Schema changes are reflected automatically — add a column to your database, and it’s available in the next Claude conversation.
In practice, this means the prompts suggested below work with whatever column names your tables actually use. Replace the example column names with your real ones — users, orders, campaigns, events, etc. — and the analysis happens the same way.
Prompt ideas: What you can do with your PostgreSQL data in Claude
The use cases below are organized by team. Replace example table and column names with the ones from your actual schema; the analytical logic stays the same.
🤖 For more advanced prompt ideas across various data sources, browse the full Windsor AI Prompt Library: windsor.ai/prompt-library/.
If you’re a product or growth team analyzing user behavior
Your application database is a goldmine that most product teams only scratch the surface of. Standard analytics tools give you pageviews and funnels, but your PostgreSQL tables contain the actual events, feature flags, subscription states, and usage patterns that explain why users stay or leave.
Cohort retention: which acquisition month retains best?
Prompt example:
Using the users table and events table, group users by their signup month (cohort).

For each cohort, calculate:
- Total users acquired
- % still active at 30, 60, and 90 days (define active as: at least one event in that window)
- Average number of events per active user in each window

Which cohort has the highest 90-day retention?
Which cohort has the sharpest drop-off between 30 and 60 days?
What feature usage pattern (from the events table) is most correlated with users who make it past 90 days?
Feature adoption funnel: where do users drop off?
Prompt example:
Using the user_events table, build a funnel for the onboarding sequence:

Step 1: account_created
Step 2: first_project_created
Step 3: first_invite_sent
Step 4: first_integration_connected

For each step, show:
- Total users who completed it
- Drop-off rate from the previous step
- Median time between steps (in hours)

Which step has the highest drop-off?
For users who completed step 2 but not step 3, what is their average session count in the 7 days following step 2?
Subscription health: identifying pre-churn signals
Prompt example:
Pull users from the subscriptions table where status = 'active' and subscription_end_date is within the next 60 days.

For each user, cross-reference with the events table:
- Number of logins in the last 30 days
- Number of core feature events (feature_type = 'core') in the last 30 days
- Last activity date

Define churn risk as:
- High: fewer than 2 logins in 30 days AND fewer than 5 core events
- Medium: 2-5 logins OR 5-10 core events
- Low: 5+ logins AND 10+ core events

List all High-risk accounts with upcoming renewals, sorted by subscription_value descending.
If you’re blending internal database data with paid ads (Google Ads, Meta, LinkedIn, etc.)
This is the use case that most analytics stacks still can’t do well. Your ad platforms show clicks and spend. Your database knows about actual conversions, LTV, and churn. The gap between them — usually a UTM parameter or a user_id passed through a landing page — is where most attribution dies.
🔗 Windsor integrates with over 350 data sources, including the most popular ad platforms, and allows you to blend data across multiple sources in a single analysis.
That’s how you can connect both your PostgreSQL database and your ad platforms to Claude via Windsor MCP. Then, feel free to ask questions that span all your required data sources in a single prompt.
Below are some advanced ideas of what you can do by blending your internal database with ad performance data in Claude.
True CAC by channel: what ad spend actually produces retained customers
Most CAC calculations stop at the first conversion. This prompt allows you to go further.
Prompt example:
Join the PostgreSQL users table (with acquisition_channel and signup_date columns) with:
- Google Ads campaign spend data (campaign_name, cost, date)
- Orders or subscriptions table (user_id, first_order_value, ltv_90d)

Use utm_source and utm_campaign as the join key between the database and ad platform data.

For each acquisition channel and campaign, calculate:
- Total ad spend
- Total new users acquired
- Average first-order value
- Average 90-day LTV
- CAC (spend / new users)
- LTV:CAC ratio (ltv_90d / cac)

Which campaigns have an LTV:CAC ratio above 3x?
Which have high spend but an LTV:CAC below 1x — meaning we're paying more to acquire customers than they return in 90 days?
Cohort quality by ad campaign
A campaign that drives 500 signups looks great until you check whether those users ever activate. This is the prompt that helps you separate volume from quality.
Prompt example:
Using the users table (with utm_campaign field at signup) and the events table, for each paid campaign from the last 90 days, show:
- Total users acquired from that campaign
- Activation rate (% who completed onboarding_complete event within 7 days)
- 30-day retention rate (% still active after 30 days)
- Average orders or key actions per activated user in 30 days

Cross-reference with Google Ads or Meta Ads spend data to add:
- Total spend per campaign
- Cost per activated user (spend / activated users)
- Cost per retained user at 30 days (spend / users retained at 30d)

Rank campaigns by cost per retained user ascending.
Flag any campaign where the activation rate is more than 20 percentage points below the account average — these are driving low-quality signups.
Remarketing audience quality
Try using this helpful prompt to understand whether your retargeting campaigns are hitting the right users.
Prompt example:
Pull users from the database who were targeted by remarketing campaigns
(identified by utm_medium = 'retargeting' in the users table).

For each remarketing campaign:
- What was the user's state before seeing the ad?
  (e.g., churned, inactive 30+ days, abandoned cart — use last_active_date and subscription_status from your tables)
- What % of remarketed users converted (placed an order or reactivated)?
- What was the average order value of converted users?
- How does their 60-day LTV compare to users acquired through non-retargeting campaigns?

Are there user segments (by prior subscription_tier or product_category from the orders table) where remarketing ROI is significantly higher?
Paid search intent vs. actual purchase behavior
Choosing the wrong keywords for Google Ads or Bing Ads often attracts low-quality traffic that never converts. With this prompt, you can analyze whether the search intent behind your keywords aligns with actual purchase behavior.
Prompt example:
For users acquired through Google Ads (utm_source = 'google' in users table), join their first search campaign and ad group name (from Google Ads data) with their actual first purchase category (from the orders table).

For each campaign/ad group:
- What product category did users actually buy first?
- Does it match the campaign's advertised product focus?
- What % of users bought outside the advertised category?

Flag ad groups where more than 40% of converters bought in a different category than advertised — this signals keyword/landing page mismatch or broader purchase intent that could justify new campaigns.
If you’re running e-commerce or marketplace operations
Your orders, products, and customers tables contain the full picture of your business, but most of it only becomes visible when you cross-reference across tables. Here’s how to use Claude to surface the patterns that matter.
Product return analysis: finding hidden quality issues
Prompt example:
Using the orders table and order_returns table, for each product_sku or product_category, calculate:

- Total units sold (last 90 days)
- Total units returned
- Return rate (%)
- Most common return_reason (from the returns table)
- Average days to return (order_date to return_date)

Flag any SKU where the return rate exceeds 15% or has increased by more than 5 percentage points versus the prior 90-day period.
For the top 10 highest-return SKUs, are there common attributes (supplier_id, warehouse_location, product_size) that correlate with the elevated return rate?
Customer LTV segmentation: who are your best customers?
Prompt example:
Using the customers and orders tables, calculate per-customer:
- Total order count
- Total revenue (sum of order_total)
- Average order value
- Days since last order
- First order date and most recent order date (customer lifespan)

Segment customers into:
- Champions: 5+ orders, last order within 60 days, AOV above median
- At risk: 3+ orders historically, no order in 90-120 days
- Lost: 2+ orders, no order in 180+ days
- One-and-done: exactly 1 order, 90+ days ago

For each segment, what is the total revenue at stake?
Which product category appears most in Champions' order history but least in At risk customers' most recent purchase?
If you’re a data or analytics team doing ad-hoc exploration
PostgreSQL connected to Claude is essentially a natural language query interface over your database. For analysts, this means faster exploration. For stakeholders, it means getting answers without filing a data request.
Schema exploration: understand an unfamiliar database fast
Prompt example:
Look at the tables available in this database. For each table, describe:
- What this table likely represents based on its column names
- The key identifiers (likely primary and foreign keys)
- The most analytically useful columns for business analysis

Which tables appear to be joinable to each other based on shared ID columns?
Suggest 3 high-value cross-table analyses that would be possible given this schema.
Data quality audit: finding gaps before they become bad decisions
Prompt example:
For the orders, users, and events tables, run a data quality check:
- What % of rows have NULL values in each column?
- Are there any date columns where the date range looks unusual (e.g., dates in the future, or dates before the company was founded)?
- Are there user_ids in the orders table that don't exist in the users table?
- Are there duplicate primary keys in any table?

Summarize the top 5 data quality issues by potential impact on analysis, and suggest which one to fix first.
Core capabilities of Windsor MCP for PostgreSQL to Claude integration
- Full schema access. Windsor links every selected table, every column, and every data type. Claude then works with your real schema, not a simplified abstraction of it.
- Custom fields and columns are included by default. Any column in your database is queryable, be it application-specific fields, internal metadata, or calculated columns. No data mapping is required.
- Multi-table analysis. Claude can join across tables, aggregate across your entire schema, and follow foreign key relationships the same way a SQL query would, but in natural language.
- Cross-source blending. As Windsor connects to 350+ data sources, your PostgreSQL tables can be analyzed alongside ad platforms (Google Ads, Meta Ads, LinkedIn Ads, TikTok Ads, e-commerce sites (Shopify, WooCommerce, Amazon Seller Central), CRMs (Salesforce, HubSpot, Pipedrive), marketing automation tools (Klaviyo, Brevo, Mailchimp), payment and revenue systems (Stripe, Chargebee, QuickBooks), and many other business apps. The join key is whatever ID or UTM field you pass through your application — user_id, customer_id, utm_campaign. Windsor handles the rest.
- Production-safe by design. Windsor’s PostgreSQL connector uses read-only credentials. A read replica is supported and recommended for production workloads.
Typical PostgreSQL table types Windsor makes available in Claude
While every database schema is different, the most analytically useful tables tend to fall into these categories:
- Transactional tables: orders, payments, subscriptions, invoices — the revenue layer of your application.
- User and customer tables: users, customers, accounts, contacts — with acquisition metadata, plan state, and activity timestamps.
- Event and behavioral tables: events, sessions, page_views, feature_usage — the activity layer that explains retention and engagement.
- Product and inventory tables: products, skus, categories, stock_levels — for merchandising and operations analysis.
- Support and operational tables: tickets, cases, returns, refunds — for customer health and quality analysis.
Windsor will enumerate any table you select. If your database has tables that don’t fit neatly into the above categories, such as internal audit logs, ML feature tables, and finance reconciliation tables, those will be automatically available in Claude, too.
Conclusion
Your PostgreSQL database already contains the most accurate picture of your business. The problem has always been that getting to actual insights requires SQL, waiting for a data request, or rebuilding the same export every time someone asks a different question.
Windsor MCP gives Claude live access to your existing tables; not a simplified field list, but your real schema, all your columns, and your actual values. The analysis that used to take a query and an export now takes a sentence.
For product teams, that means retention and feature adoption analysis on demand. For growth teams, it means connecting ad spend to actual LTV in a single conversation. For data teams, it means schema exploration and data quality audits without writing a line of SQL.
🚀 Connect your PostgreSQL database to Claude with Windsor MCP in less than a minute! Start for free now: https://onboard.windsor.ai/app/postgresql.
FAQs
What are the ways to connect PostgreSQL to Claude?
There are several ways to connect PostgreSQL to Claude, depending on your technical setup and how much control you need:
- MCP-based connectors (easiest): Use tools like Windsor MCP to connect PostgreSQL directly to Claude with no code. This is the fastest way to enable natural-language querying over your database.
- Custom API layer: Build an API (e.g., with Python, Node.js, or tools like FastAPI) that queries your PostgreSQL database and sends structured results to Claude via prompts. This gives you full control but requires development effort.
- BI or data warehouse integration: Sync PostgreSQL data into a warehouse (like BigQuery or Snowflake) or BI tool, then connect that environment to Claude for analysis.
- Manual exports: Export data from PostgreSQL (CSV, JSON) and upload or paste it into Claude. This is a simple method, but not scalable or real-time.
- Claude Desktop + MCP proxy (dev setup): Advanced users can configure a local MCP server (like Windsor MCP via proxy) to connect PostgreSQL with more control over permissions and infrastructure.
What is the easiest way to connect PostgreSQL to Claude?
The easiest way is through Windsor MCP. You simply enter your PostgreSQL connection credentials in Windsor, add Windsor as a connector in Claude, and start querying your data in natural language. No SQL, scripts, or manual data exports are required.
Does Windsor support PostgreSQL running on RDS, Cloud SQL, or Supabase?
Yes. Windsor connects to any PostgreSQL instance with a reachable host and port, whether it’s AWS RDS, Google Cloud SQL, Azure Database for PostgreSQL, Supabase, or a self-hosted instance. For private databases on a VPC, you’ll need to whitelist Windsor’s IP addresses or set up a tunnel.
Is my PostgreSQL database secure when connected to Windsor?
Yes. Windsor connects to your database over an encrypted connection and is SOC 2 compliant. Best practice is to provision a dedicated user with SELECT permission only, and for production, point Windsor at a read replica rather than your primary instance. Your data isn’t shared with third parties or used to train AI models.
What prerequisites do I need to connect my PostgreSQL database to Windsor.ai?
To ensure a seamless connection between Windsor.ai and PostgreSQL, please verify the following:
- Whitelisting IPs: Ensure your database firewall allows incoming traffic from Windsor.ai.
-
SSL/TLS mode: If you are using a hosted provider (like AWS RDS, Supabase, or Heroku), ensure you have
sslmode=requireenabled in your connection string settings. -
Database permissions: We recommend creating a dedicated “Windsor_User” with
SELECT,INSERT, andUPDATEpermissions. Avoid using a superuser for security best practices.
Why did my PostgreSQL connection to Windsor fail?
If you encounter an error during setup, check these three common causes:
- Incorrect port: The default PostgreSQL port is 5432. Double-check if your host uses a custom port.
- Authentication failure: Ensure your password does not contain special characters that might require URL encoding, or verify that the database user has access to the specific database name provided.
- Connection timeout: This is usually a firewall issue. Double-check that your database is “Publicly Accessible” (if using a cloud provider) or that our IPs are correctly whitelisted.
Can Windsor access all my tables, or do I choose which ones to expose?
You choose. During setup, Windsor enumerates the tables in your database and lets you select which ones to make available to Claude. You don’t need to expose your entire schema; select only the tables relevant to your analysis. You can ask Claude to add or remove tables at any time.
My database has custom columns and application-specific fields. Will Claude understand them?
Yes, and this is one of the key advantages of the Windsor’s PostgreSQL connector over field-based connectors. Windsor mirrors your exact column names to Claude, including custom application fields. Claude works with whatever names you’ve used in your schema. If a column is called onboarding_score or days_to_first_value, that’s exactly what you reference in your prompts.
Can I blend PostgreSQL with ad platform data in Claude using Windsor MCP?
Windsor syncs your PostgreSQL database and your ad platforms (Google Ads, Meta Ads, LinkedIn Ads, etc.) to the same Claude conversation. When you write a prompt that references both your database tables and ad spend data, Claude joins them using whatever field you specify as the key, typically utm_campaign, utm_source, or a customer_id passed through from your landing page. No pre-built pipeline or ETL is required.
What happens when I add a new column or table to my database?
New columns added to an already-connected table become available to Claude automatically in the next conversation, no reconfiguration needed.
Can I connect multiple PostgreSQL databases in one Claude conversation?
Yes. If you have multiple PostgreSQL instances connected in Windsor, for example, a production database and a separate analytics database, you can query across both in a single Claude conversation and ask Claude to join or compare data between them.

