 AI insights
 About us
 Careers
 Security
 Customer reviews
 Contact us
 Affiliate program
 Solution partners
 Looker Studio templates
 Tableau templates
 Facebook Ads templates
 Google Ads templates
 Data fields & Metrics
 AI prompt library & Guides
 Product documentation
 API documentation
 Case studies
 Blog
Blog Data models
 Windsor vs Supermetrics
 Windsor vs Fivetran
 Windsor vs Portermetrics
 Last updated: 8 June 2026

QuickBooks offers reports for nearly every financial area of your business: Profit and Loss, Balance Sheet, Accounts Receivable Aging, Sales by Customer, Expenses by Vendor, and more.
But deeper analysis is a different story. Each report lives in its own view, with separate filters and settings. Comparing data across reports usually means exporting everything to spreadsheets and doing the math manually.
Ultimately, the questions that actually matter, like which jobs are profitable, whether you can afford to hire, and which customers are worth keeping, don’t fit neatly into a single report.
Connecting QuickBooks to Claude via Windsor MCP changes that. In under a minute, Windsor streams your QuickBooks data into Claude, so you can analyze invoices, expenses, customers, payments, and more using natural language. No code, no exports, no formulas; just instant, in-depth answers powered by AI.
🚀 Connect QuickBooks to Claude with Windsor MCP. Try it free for 30 days → onboard.windsor.ai/app/quickbooks.
Once you set up the QuickBooks to Claude integration, you can ask questions like:
- Which customers account for more than 20% of revenue, and are any of them slowing down on payments?
- How does this quarter’s net profit compare to the same quarter last year, broken down by class?
- Which expense categories have grown the most as a share of revenue over the last six months?
- What is our current cash runway based on bank balances and average monthly burn?
- Which jobs or projects are running over budget, and by how much?
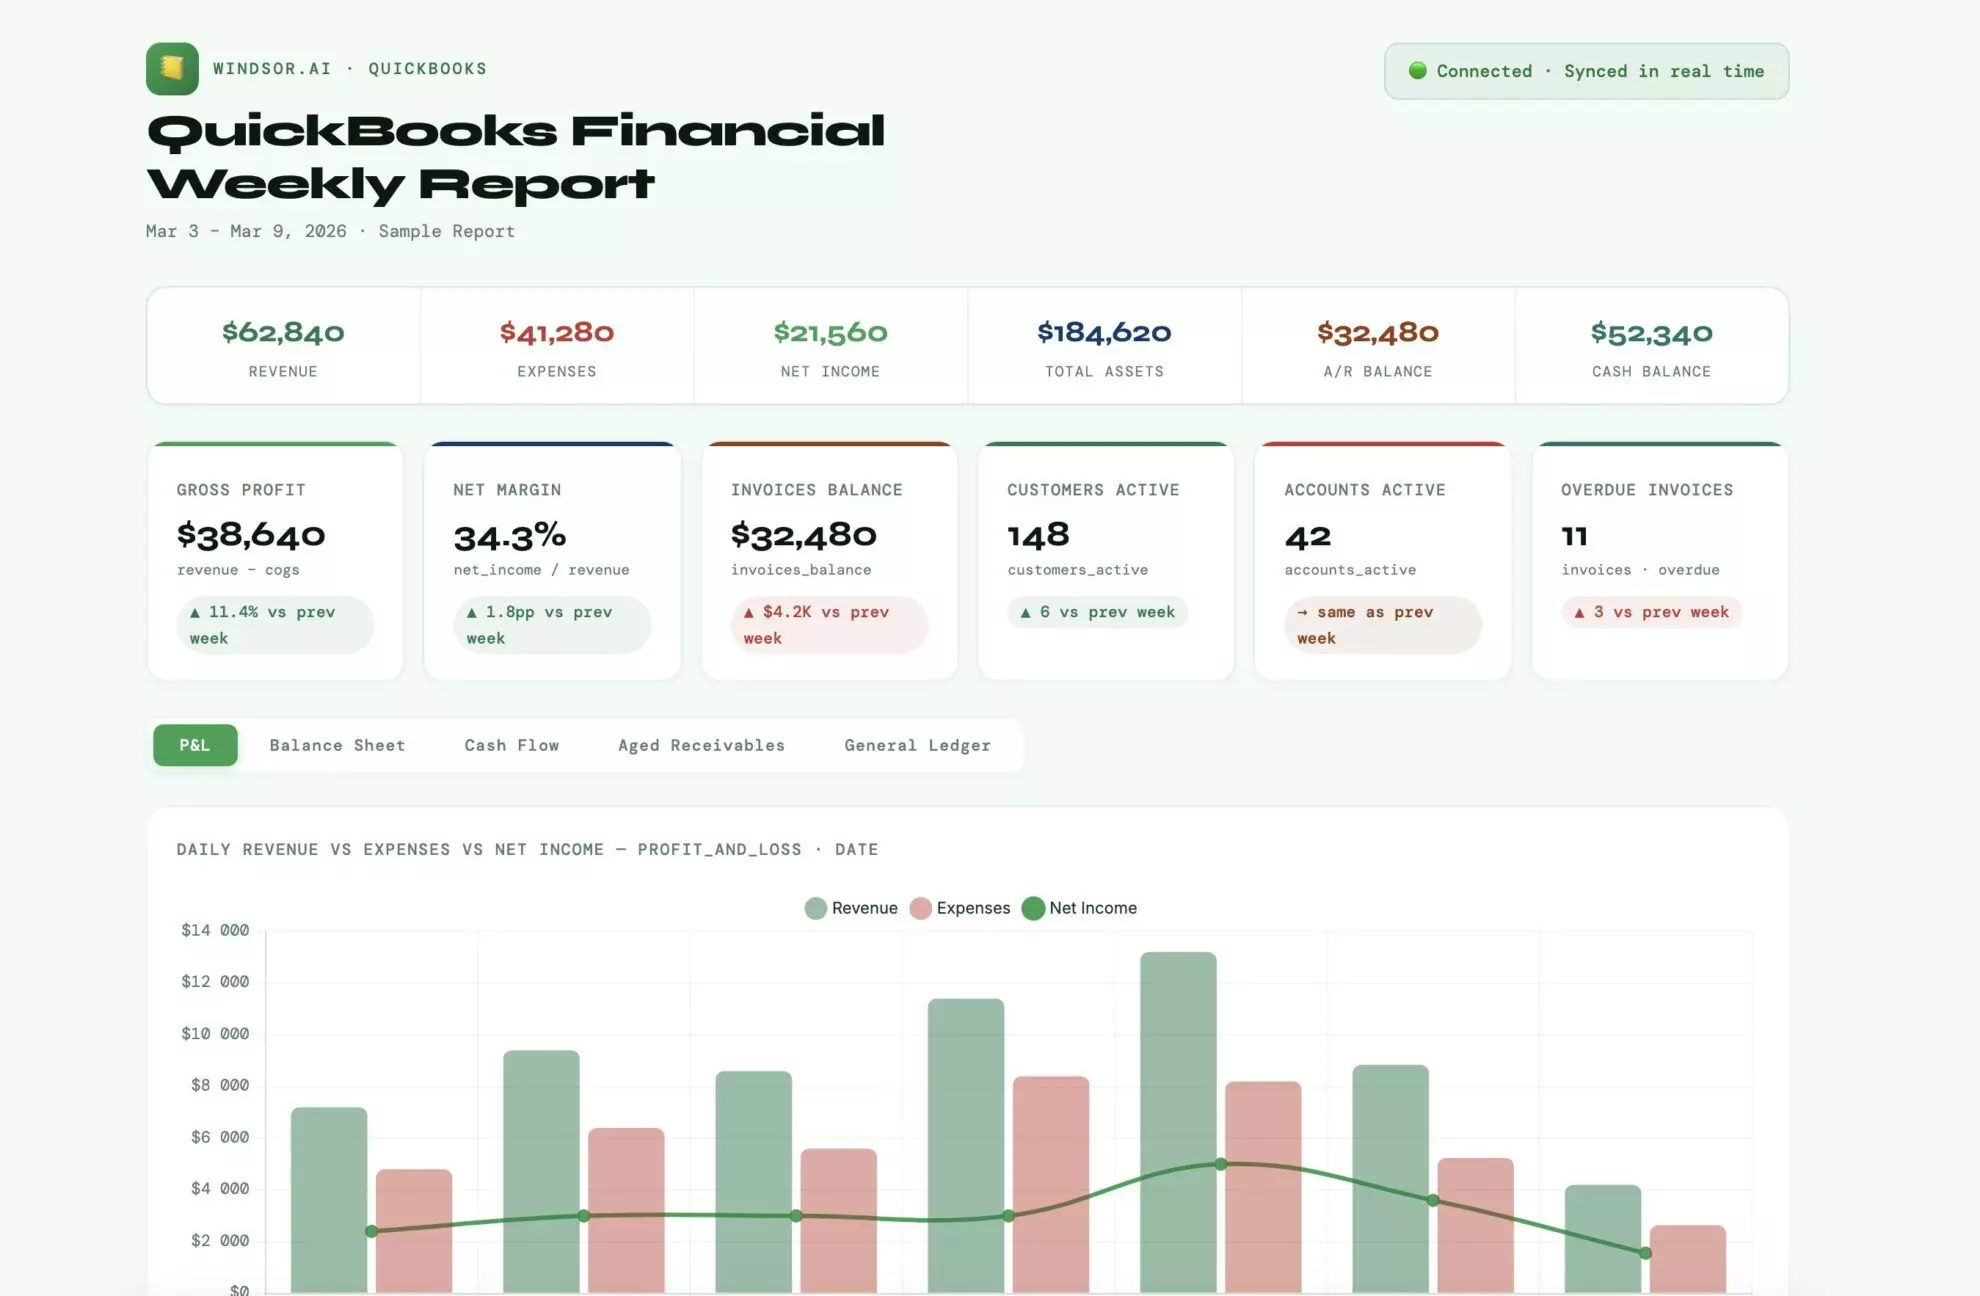
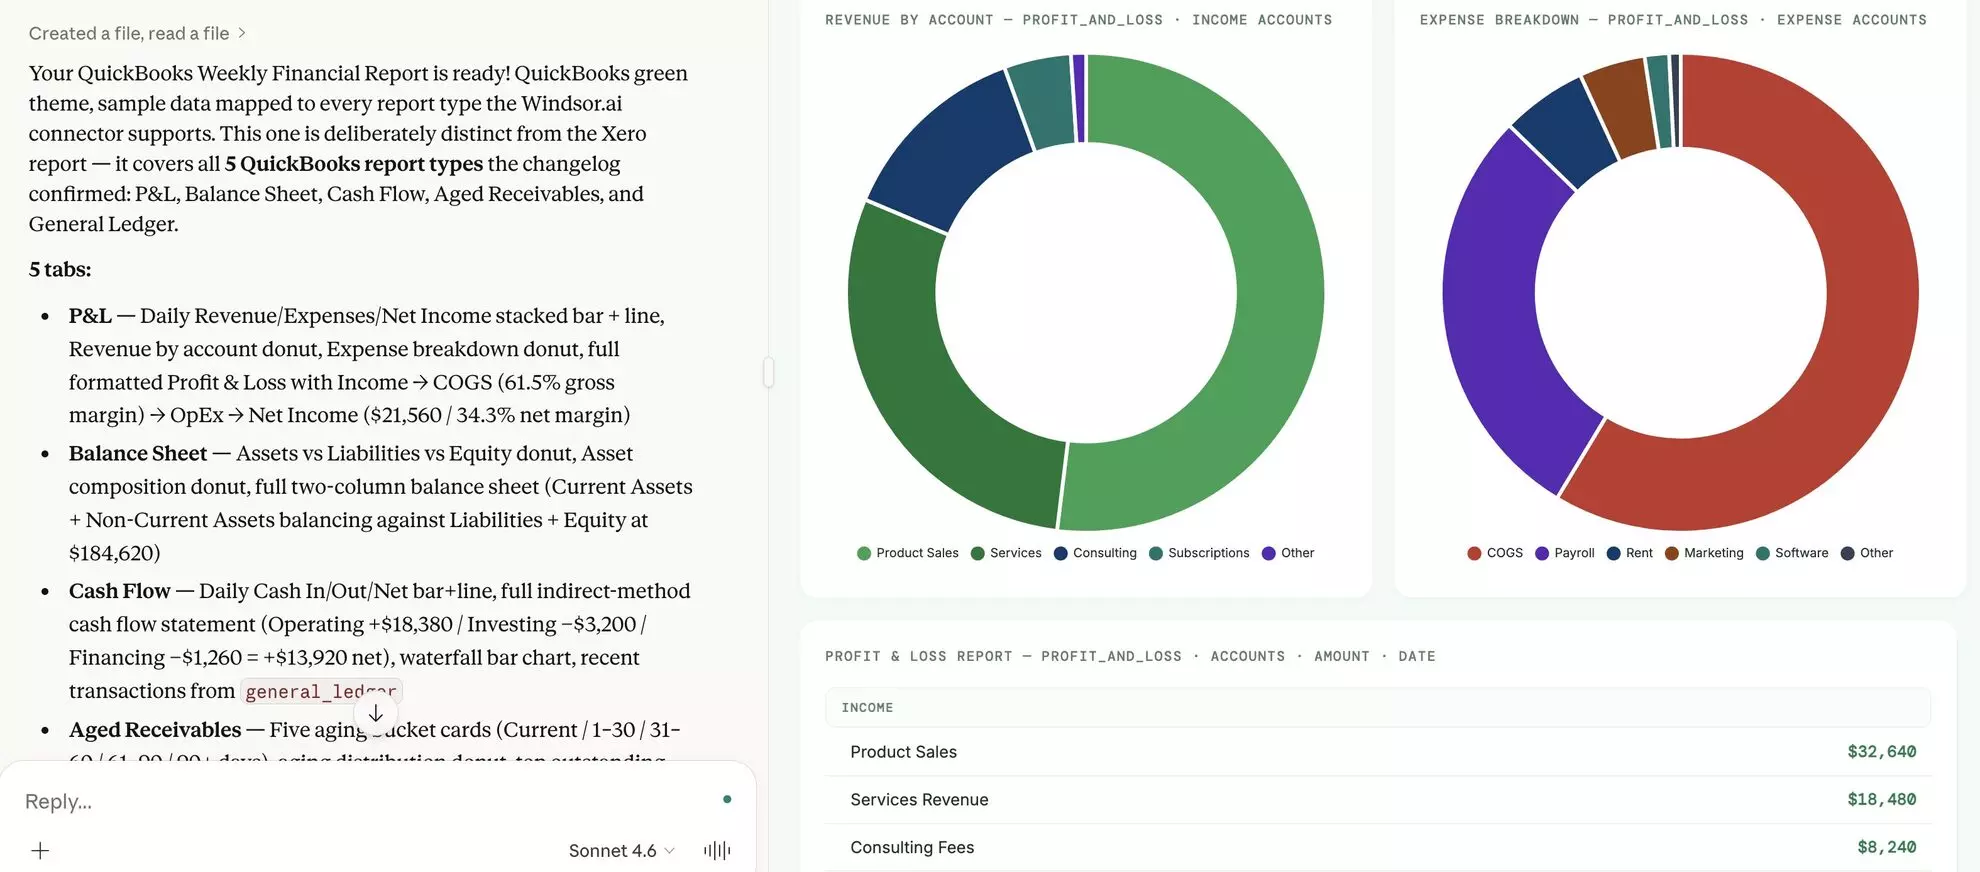
Sending QuickBooks data to Claude through Windsor gives you a complete analytical view without relying on static reports or manual spreadsheets. You can even generate clear financial summaries and reports with a single prompt.
Get started in three simple steps.
3 steps to connect QuickBooks to Claude with Windsor MCP
Building the QuickBooks and Claude integration is a fully automated process and requires no technical knowledge.
📖 Official documentation: How to integrate data into Claude with Windsor MCP.
Prerequisites
- A QuickBooks account with the necessary permissions
- A Windsor.ai account (free or paid plan)
- A Claude.ai account
Step 1. Connect QuickBooks to Windsor.ai
Go to onboard.windsor.ai/app/quickbooks and connect your QuickBooks account(s). Windsor uses the secure OAuth flow; no passwords are shared or stored.
If you manage multiple QuickBooks companies, each can be connected to Windsor separately and queried in Claude independently or compared against each other.

Step 2. Install the Windsor.ai connector in Claude
In Claude, open the Windsor.ai connector page and click Connect.
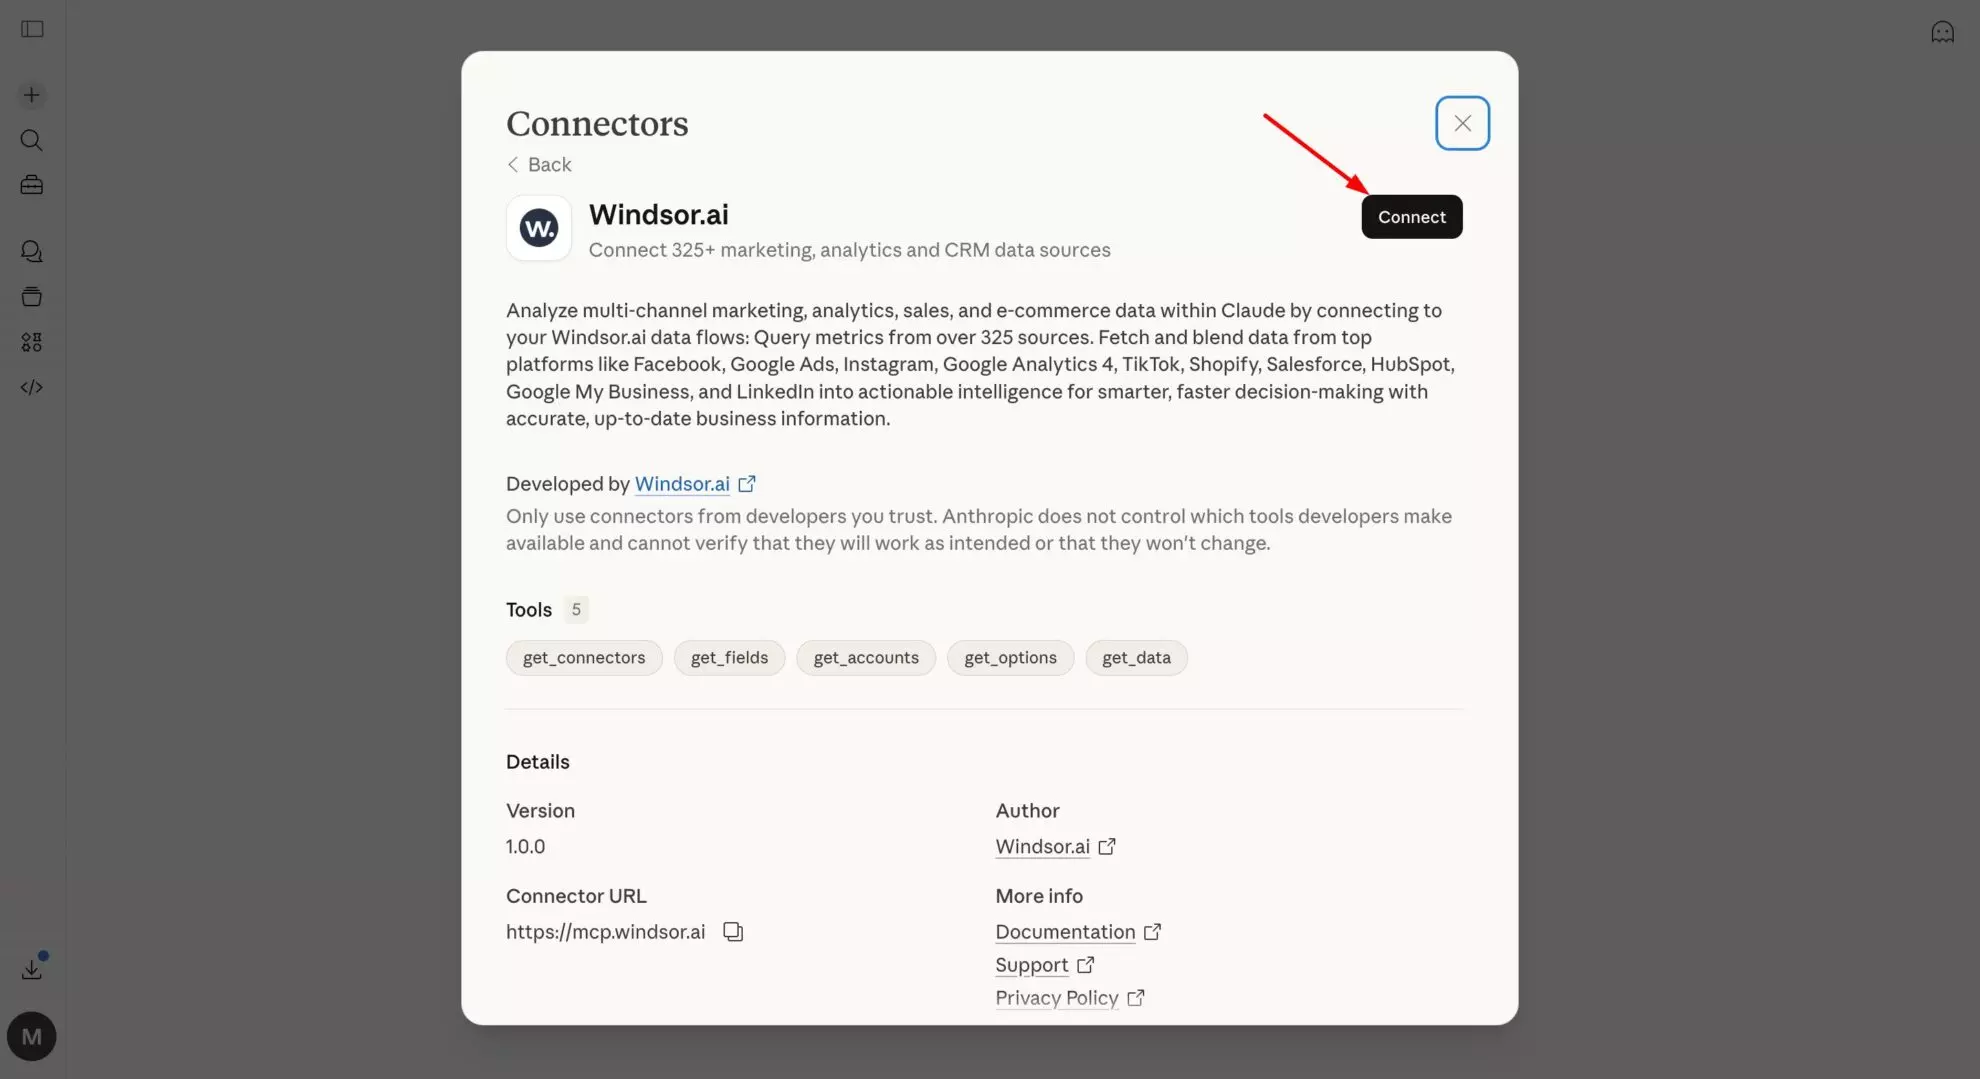
💡 Quick tip: Set permissions to “Always allow”. Your QuickBooks data is now live in every Claude conversation.
Step 3. Start querying your QuickBooks data in Claude
Your QuickBooks data is now ready for natural-language analysis. Ask questions just as you would to a financial analyst.
Sample prompts:
- Show a monthly breakdown of revenue, expenses, and net profit for the last 12 months.
- Which vendors have the highest total spend, and how has that changed over time?
- Identify any unusual spikes in expenses over the past 90 days and explain possible causes.
- What percentage of total revenue comes from repeat customers vs new customers?
What you can do after connecting QuickBooks to Claude: Prompt ideas
Below are practical prompt ideas across key finance use cases, from cash flow and runway to profitability and cost control, designed to help you get instant, decision-ready insights from your QuickBooks data.
Cash flow and runway: knowing where you stand before it matters
Cash flow is the single most important financial metric for small and mid-size businesses, and the one most often understood only in hindsight.
Once you integrate QuickBooks with Claude, you can get a forward-looking cash picture on demand, not just after the fact.
Cash runway: how long can the business run at the current burn
Prompt idea:
Using QuickBooks bank account balances and expense data, show me the following:

- Current total cash position across all bank accounts
- Average monthly operating expenses over the last 3 months
  (exclude one-time items if visible from transaction descriptions)
- Average monthly revenue collected (payments received, not just invoiced)
- Net monthly cash burn or gain (revenue collected minus expenses paid)

At current burn rate, how many months of runway does the business have?
Are there any months in the last 6 where cash dipped below $[threshold]?
What single expense category, if reduced by 20%, would have the greatest impact on extending runway?
Accounts receivable aging: money owed and how late it is
Prompt idea:
From QuickBooks invoice data, produce a full AR aging report:

Group outstanding invoices into buckets:
- Current (due date not yet passed)
- 1–30 days overdue
- 31–60 days overdue
- 61–90 days overdue
- 90+ days overdue

For each bucket: total amount outstanding, invoice count, and the top 3 customers by overdue balance.

Which customer has the largest total outstanding balance?
What is the average number of days past due for overdue invoices?

Of all money owed to the business, what percentage is more than 60 days overdue?
That is the collection risk figure.
Accounts payable timing: managing outflows before they become a problem
Prompt idea:
Using QuickBooks bill data, show all outstanding bills:

- Total amount due this week, this month, and next month
- Bills that are already past their due date — amount and vendor name
- Top 5 vendors by total outstanding balance
- Average days between receiving a bill and paying it

Are there any vendors where we consistently pay late?
Is there a pattern between late payments and a particular month or cash flow period?
Profitability: understanding where the money actually goes
QuickBooks has a P&L report. What it doesn’t have is an easy way to understand the story behind the numbers: why the margin changed, which customers or service lines drive profitability, and where the cost creep is coming from.
That’s the analysis Claude easily handles after you connect QuickBooks data.
P&L analysis with year-over-year comparison
Prompt idea:
Using QuickBooks income and expense data, produce a plain-language P&L summary for the current year to date vs. the same period last year:

- Total revenue
- Cost of goods sold / direct costs
- Gross profit and gross margin %
- Total operating expenses (broken down by major category)
- Net profit and net margin %

For each line, show the year-over-year dollar change and % change.

Which expense category has grown fastest relative to revenue?
Is gross margin improving or deteriorating?

Write a 3-sentence executive summary of what the numbers show.
Profitability by class or location: which part of the business carries its weight
Prompt idea:
Using QuickBooks transaction data filtered by class (or location):

For each class, calculate for the last 6 months:
- Total revenue allocated to that class
- Total direct costs
- Gross profit and gross margin %
- Operating expenses allocated (if tracked at class level)
- Net contribution

Rank classes by gross margin % descending.

Which class is most profitable?
Which has the worst margin?
Are there classes that are growing in revenue but declining in margin — a signal that cost structure isn't scaling with the work?
Customer profitability: your most and least valuable accounts
Prompt idea:
Using QuickBooks invoice and expense data, for the last 12 months, for each customer:

- Total invoiced revenue
- Total direct costs billed or allocated (if tracked by customer or job)
- Gross profit and margin % per customer
- Number of invoices
- Average invoice value
- Average days to pay

Rank by gross profit descending.

Who are the top 10 most profitable customers?
Which customers have strong revenue but poor margins — high-maintenance accounts that cost more to service than they appear?
Which customers are the slowest payers, and is there overlap with low-margin customers?
Expense management: catching cost creep early
Expense trend analysis: what’s growing
Prompt idea:
Using QuickBooks expense data for the last 12 months, show monthly spend by account category (software, contractors, payroll, rent, marketing, travel, professional services, etc.).

For each category:
- Monthly spend trend — growing, shrinking, or flat?
- Total this year vs. last year
- Category spend as a % of total revenue (this year vs. last year)
- Largest single transaction in the category this year

Which categories have grown more than 20% year-over-year?
Which are growing faster than revenue — meaning margin pressure?

Flag any vendor within those categories that accounts for more than half the category spend.
Vendor spend concentration: where your money is actually going
Prompt idea:
From QuickBooks bill and expense data for the last 12 months, for each vendor:

- Total spend
- Number of transactions
- Average transaction size
- Month of highest spend
- % of total company expenditure

Who are the top 10 vendors by total spend?
Which vendors have you paid every month consistently?

Flag any vendor representing more than 10% of total expenses — that is a concentration risk.

Are there recurring subscriptions or retainers that have increased in price without a corresponding change in the transaction notes?
Job costing and project profitability: did the work actually pay?
For contractors, agencies, professional services firms, and any business that works on projects or jobs, QuickBooks class and job tracking holds some of the most valuable data in the system.
Once you sync QuickBooks to Claude, getting per-job profitability takes a single prompt instead of a custom report build.
Job-level P&L: which projects made money and which didn’t
Prompt idea:
Using QuickBooks job or class data (whichever is used for project tracking):

For each job or project in the last 12 months, show:
- Total revenue billed (invoiced amount)
- Total direct costs (labor, materials, subcontractors)
- Gross profit and margin %
- Estimated vs. actual cost (if estimates were created in QuickBooks)
- Whether the job came in over or under budget

Which jobs had the best margin? Which had the worst?
Are there patterns — job type, client, size, or duration — that predict whether a project will be profitable?
What is the average gross margin across all jobs this year vs. last year? Is it trending up or down?
Labor cost by job or class: are you billing enough for the hours?
Prompt idea:
Using QuickBooks payroll or contractor expense data allocated by job:

For each job or class, show:
- Total labor cost (payroll + contractor payments)
- Total revenue billed for that job
- Labor as a % of revenue (labor efficiency ratio)
- If available: budgeted labor vs. actual labor

Which jobs have a labor-to-revenue ratio above 50%? Those are candidates for either repricing or scope tightening.
Is there a specific job type where labor consistently overruns the estimate?
For accountants and bookkeepers: faster client work
Accountants and bookkeepers who use QuickBooks Online Accountant to manage client files can connect each client company to Windsor separately.
The QuickBooks to Claude integration then becomes a tool for faster client prep, monthly close reviews, and year-end planning without building a custom report set for every client.
Monthly close checklist
Prompt idea:
For [client name]'s QuickBooks company, run a month-end review for the just-completed month:

1. Uncategorised transactions: are there any expenses posted to 'Uncategorized Expense' or income to 'Uncategorized Income'?
2. Unreconciled accounts: which bank or credit card accounts have uncleared transactions older than 30 days?
3. Overdue receivables: any invoices more than 60 days past due?
4. Unusual transactions: any single expense transaction more than 3x the average transaction size for that account this year?
5. Payroll check: does total payroll this month align with prior months, or is there an unexpected variance?

Flag any issues found and rank by financial impact.
Year-end planning summary for a client meeting
Prompt idea:
Using QuickBooks data for the current fiscal year to date, prepare a plain-English year-end planning summary for [client]:

1. Where the business stands: YTD revenue, expenses, and net profit vs. last year and vs. budget (if available)?
2. Tax exposure estimate: estimated taxable income based on YTD net profit — flag if significantly higher or lower than last year
3. One-time items: any large non-recurring expenses or revenue that should be flagged for tax treatment
4. Cash position: current bank balance vs. estimated Q4 tax obligation
5. Three questions to raise with the client at the year-end meeting

Write for a 30-minute client conversation.
Bonus: Blending QuickBooks with other data sources
QuickBooks holds your financial ground truth. The most powerful analysis happens when you connect that to data from the other tools your business runs on: your CRM, your payroll system, your ad platforms, or your e-commerce store.
Windsor connects all of them into a single, unified dataset in Claude, automatically normalizing and joining the data so you can run seamless cross-channel analysis without manual joins.
Here are some of the most common and impactful data blending scenarios:
- QuickBooks + Salesforce or HubSpot: Match invoiced revenue in QuickBooks against closed-won opportunities in your CRM. Which sales channels produce your most profitable customers? Which lead sources generate clients who pay on time? Connect CRM pipeline data with QuickBooks customer revenue and payment history to find out.
- QuickBooks + Stripe or PayPal: QuickBooks records the invoice. Payment processors record the transaction. Connect both to reconcile processing fees against billed amounts, identify failed or refunded payments, and calculate true net revenue after transaction costs — by customer, by product, or by month.
- QuickBooks + Google Ads or Meta Ads: Marketing spend appears in QuickBooks as vendor bills. Ad platform data shows what that spend produced. Connect both to calculate true marketing ROI, not just cost per click, but revenue generated per dollar of ad spend, using QuickBooks invoice data to close the loop.
- QuickBooks + Google Sheets: Finance teams often maintain budget models, headcount plans, and revenue forecasts in spreadsheets that QuickBooks doesn’t know about. Connect both and ask Claude to compare your Sheets-based plan against actual QuickBooks transactions — real budget vs. actuals without manual work.
- QuickBooks + Shopify or WooCommerce: E-commerce businesses that sync orders to QuickBooks can cross-reference store performance data against the actual revenue and COGS recorded in QuickBooks. Ask Claude to reconcile what the store reports with what the books show, and identify margin differences by product category.
What QuickBooks data Windsor syncs to Claude
When you connect QuickBooks to Claude through Windsor, the following data becomes available for analysis:
| QuickBooks data | What Claude can answer with it |
| Invoices | Revenue by customer, outstanding balances, and seasonal revenue patterns. |
| Bills & Bill payments | Spend by vendor, month-over-month expense trends, and vendor concentration risk. |
| Aged receivables | Detailed invoice aging (1-30, 31-60, 61-90, 91+ days) and collection efficiency. |
| Accounts & Balance sheet | Current assets, liabilities, equity positions, and working capital trends. |
| Profit & Loss / Cash flow | Gross vs. net margin, year-over-year P&L analysis, and operating cash flow trends. |
| Customers & Vendors | Top clients by revenue, customer-level profitability, and supplier dependency analysis. |
| Classes & Departments | P&L and margin broken down by business unit, project type, or department. |
| Items & Services | Sales volume and revenue trends for specific products or service lines. |
| Budgets | Budget vs. Actual (BVA) analysis and spend tracking against set targets. |
Key QuickBooks fields Windsor sends to Claude
Windsor gives Claude access to QuickBooks’ full transaction, reporting, and customer data, supporting over 650 data fields.
The most commonly used fields in real analysis:
invoices__totalamt&invoices__balance: Tracks the total invoiced amount and the remaining unpaid portion. Essential for calculating receivables and revenue.bills__totalamt&bills__balance: Similar to invoices, these track company liabilities and vendor spend.invoices__txndate&invoices__duedate: Transaction and due dates. Used by Claude to calculate payment velocity and identify late-paying customers.customer_name&vendor_name: The primary dimensions for segmenting your financial data by partner or client.items__name&items__description: Product-level detail. Use these to ask Claude which services or products are driving the most growth.accounts__name&accounts__accounttype: The foundation of the Chart of Accounts. These fields allow Claude to categorize transactions into Income, Expense, Asset, or Liability.classes__fullyqualifiedname: Only used if you track “Classes” in QuickBooks. This allows Claude to perform “Departmental P&L” analysis.agedreceivables__91andover: A specific metric that allows Claude to flag high-risk accounts that are more than 3 months overdue.budgets__name&budgets__budgetdetail: Provides access to your internal financial targets for comparison against actual performance.balancesheet__totalassets&balancesheet__totalliabilitiesandequity: The core metrics for structural financial health and solvency analysis.
Conclusion
QuickBooks is the financial system of record for millions of businesses. The data has always been there: every transaction, every customer, every job, every dollar in and out. The problem has never been a lack of information. It’s been the gap between the reports QuickBooks is configured to show and the questions a business owner actually needs to answer.
Connecting QuickBooks to Claude via Windsor MCP closes that gap. Send your QuickBooks data to Claude via a direct connector, and start analyzing your cash runway, job profitability, customer margin, expense trends, and year-end planning in plain language, in real time, without building a custom report for each one.
And when the answer requires context that lives outside QuickBooks, in your CRM, payroll system, or ad platforms, Windsor connects those, too.
🚀 Connect QuickBooks to Claude with Windsor MCP in less than 60 seconds. Get started for free.
FAQs
How can I connect QuickBooks to Claude?
There are three main ways to set up a QuickBooks and Claude integration:
- Windsor MCP (easiest): No-code QuickBooks to Claude sync. Connect your account to Windsor.ai via official OAuth, add the Windsor.ai connector in Claude, and your QuickBooks data is live in every conversation. No API keys, no maintenance, no exports.
- Manual export: Export a QuickBooks report as CSV and upload or paste into Claude for one-off analysis. Works for isolated questions, but data is immediately stale, and there’s no cross-source blending.
What is the easiest way to integrate QuickBooks with Claude?
Windsor MCP. Go to onboard.windsor.ai/app/quickbooks, sign in with your QuickBooks Online account, and add Windsor as a connector in Claude’s settings. The entire QuickBooks to Claude integration takes under a minute. From that point on, your financial data is available in every Claude conversation with no repetitive exports or report configuration.
Is my QuickBooks financial data secure when connected to Windsor?
Yes. Windsor is SOC 2 compliant, and the connection uses Intuit’s official OAuth.
Can I connect multiple QuickBooks companies to Windsor?
Yes. Each QuickBooks Online company file can be connected to Windsor as a separate data source. This is particularly useful for accountants managing multiple client companies or business owners with several entities. Each company can be queried independently in Claude or compared against one another in a single conversation.
Does the QuickBooks Claude integration support class tracking and job costing?
Yes. If you use QuickBooks classes or locations to track business units, departments, service lines, or jobs, Windsor makes those dimensions available to Claude. You can ask for a P&L by class, compare margins across job types, or calculate labor-to-revenue ratios by department; the same analysis you’d get from a class-based QuickBooks report, but in a plain conversation.
Can Claude create invoices or record transactions in QuickBooks?
No. Claude analyses your QuickBooks data and recommends changes, but doesn’t create invoices, record payments, categorise transactions, or modify your company file; all changes happen inside QuickBooks, made by you.
Not in QuickBooks today — through this connector, Claude analyzes your data and recommends changes, but you execute them in QuickBooks.
Can I blend QuickBooks data with other tools like Salesforce, Stripe, or Google Ads?
Yes. This is one of the most valuable things you can do after connecting QuickBooks to Claude. Windsor supports 345+ integrations, and you can have multiple sources active in the same conversation. Common combinations: QuickBooks + Salesforce to connect revenue with pipeline, QuickBooks + Stripe to reconcile invoices with payment processor records, and QuickBooks + Google Ads to calculate true marketing ROI against QuickBooks revenue data.
Can Claude tell me which customers are late on payments?
Yes. Because Windsor sends fields like invoices__balance, invoices__duedate, and specifically agedreceivables__91andover, you can ask Claude: “Which customers have the highest balances more than 90 days overdue?”
Can I compare my actual spending against my budget?
Yes. Unlike manual CSV exports that often miss budget data, Windsor includes budgets__name and budgets__budgetdetail. You can ask Claude to perform a Budget vs. Actual (BVA) analysis to see where you are overspending.
How “live” is the data through the Windsor MCP connection?
When you use the Windsor MCP, the data is fetched via QuickBooks API. This means every time you ask Claude a question, it can access the most recent sync from your QuickBooks Online account, rather than relying on a static file from last week.
What is the advantage of using Windsor over a standard CSV upload?
A CSV is just a snapshot. Windsor provides relational context. It links vendor_name to bills__totalamt automatically, so you don’t have to explain to Claude how the columns relate to each other; it already knows the schema.
If APIs are free to use, why should we use a third-party tool like Windsor.ai?
Windsor.ai’s connector for Claude is a go-to solution for non-technical teams. While native APIs are usually free to access, the labor to use them is incredibly expensive. Building a pipeline isn’t a one-time project; it requires continuous engineering hours for maintenance. Windsor.ai charges a predictable software fee, whereas a DIY pipeline charges you for ongoing engineering salaries.

