 AI insights
 About us
 Careers
 Security
 Customer reviews
 Contact us
 Affiliate program
 Solution partners
 Looker Studio templates
 Tableau templates
 Facebook Ads templates
 Google Ads templates
 Data fields & Metrics
 AI prompt library & Guides
 Product documentation
 API documentation
 Case studies
 Blog
Blog Data models
 Windsor vs Supermetrics
 Windsor vs Fivetran
 Windsor vs Portermetrics
 Last updated: 26 June 2026

Your Snowflake warehouse already holds the answers to your most important business questions, but getting to them usually means writing SQL or relying on a data analyst.
With Windsor MCP for Claude, that bottleneck disappears. Windsor connects directly to your Snowflake warehouse and makes your databases, schemas, and tables instantly available in Claude, in less than a minute, with no code.
Instead of querying manually, anyone on your team can ask complex analytical questions in natural language, such as:
- What is MRR growth this quarter, broken down by plan type and sales region?
- Which marketing channels drove the highest LTV customers in the last 6 months?
- Which product features correlate most strongly with 90-day retention?
- What is the average sales cycle length by industry vertical and deal size?
- How does this month’s gross margin compare to the same period last year, by product line?
🚀 Connect your Snowflake warehouse to Claude with Windsor MCP. Try it free for 30 days.
Claude queries your Snowflake tables directly, automatically joins across schemas as a SQL query would, and returns structured insights in the form of tables, comparisons, and summaries your team can immediately act on.
Here’s how you get started.
3 steps to connect Snowflake to Claude with Windsor MCP
Windsor MCP connects to your Snowflake warehouse via Snowflake’s standard SQL API and makes your selected databases, schemas, and tables available inside Claude as a live, queryable dataset. The entire setup takes three simple steps.
📖 Full documentation: windsor.ai/documentation/windsor-mcp/how-to-integrate-data-into-claude/.
Prerequisites
- A Windsor.ai account (free or paid plan)
- A Snowflake account (provide your host, user, password, warehouse, database, schema, and table)
- A Claude account
Steps to connect Snowflake to Claude
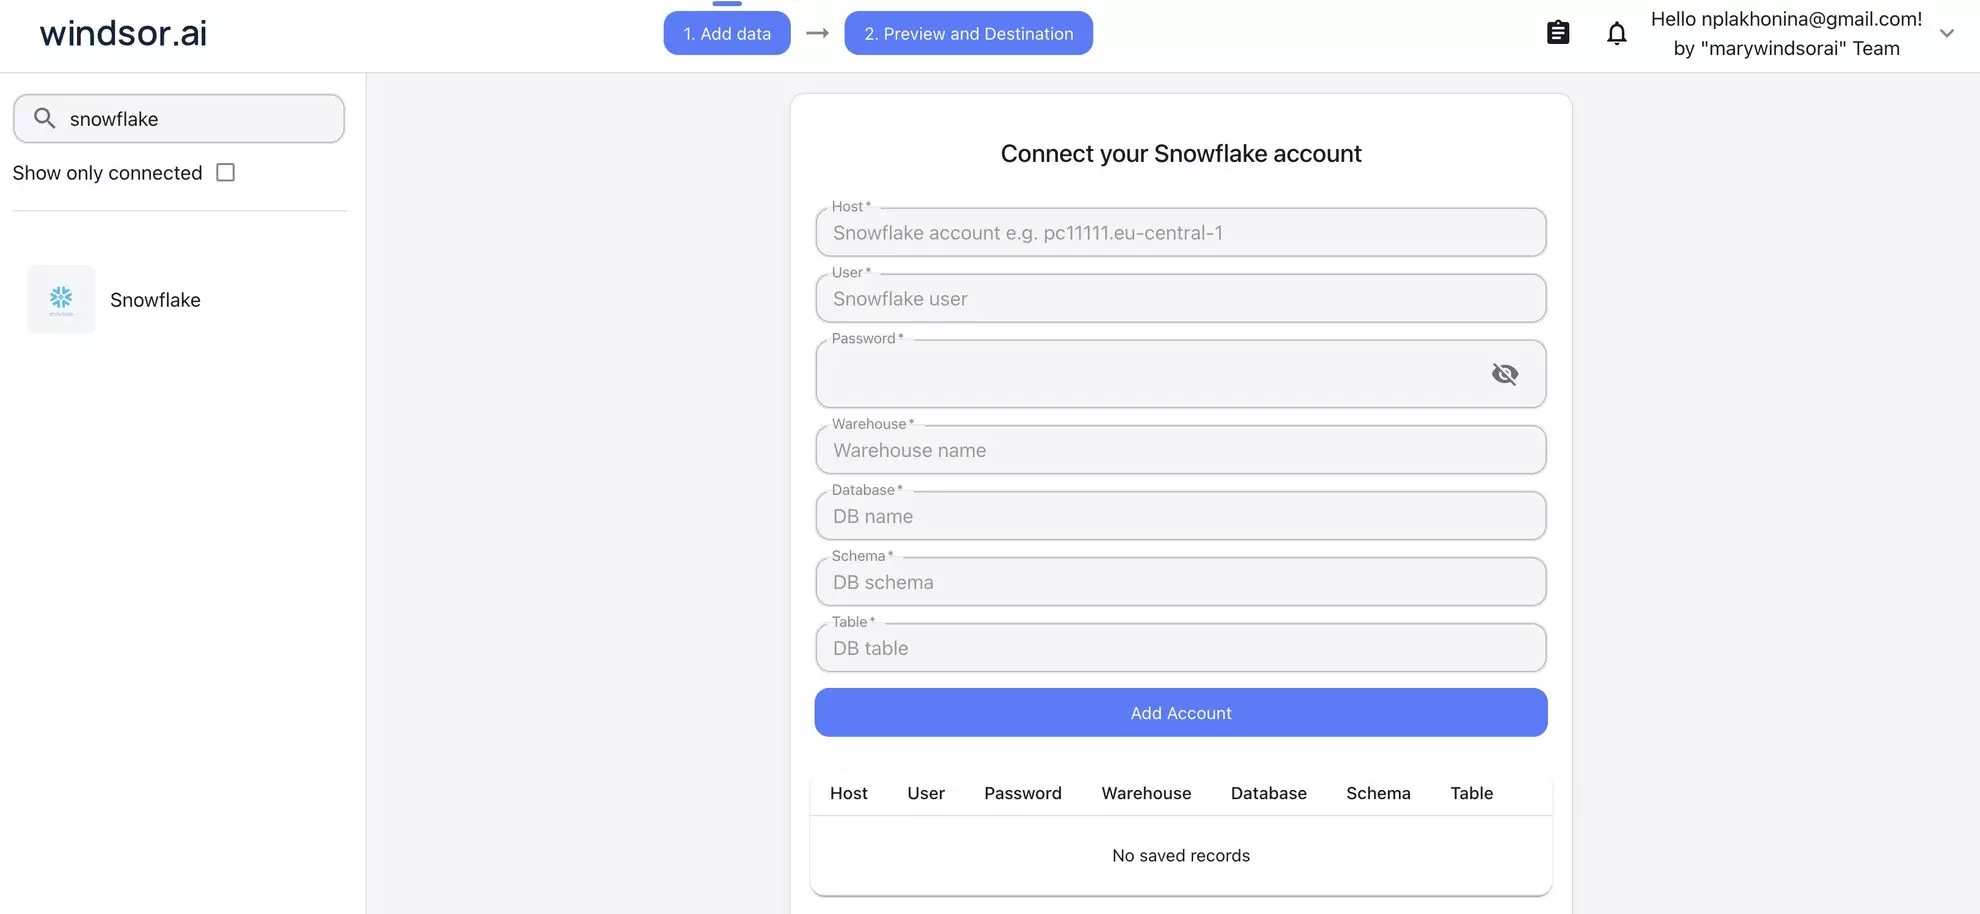
1. Go to onboard.windsor.ai/app/snowflake and connect Snowflake as your data source (enter the required credentials). Windsor will authenticate and fetch the schemas and tables you specify.
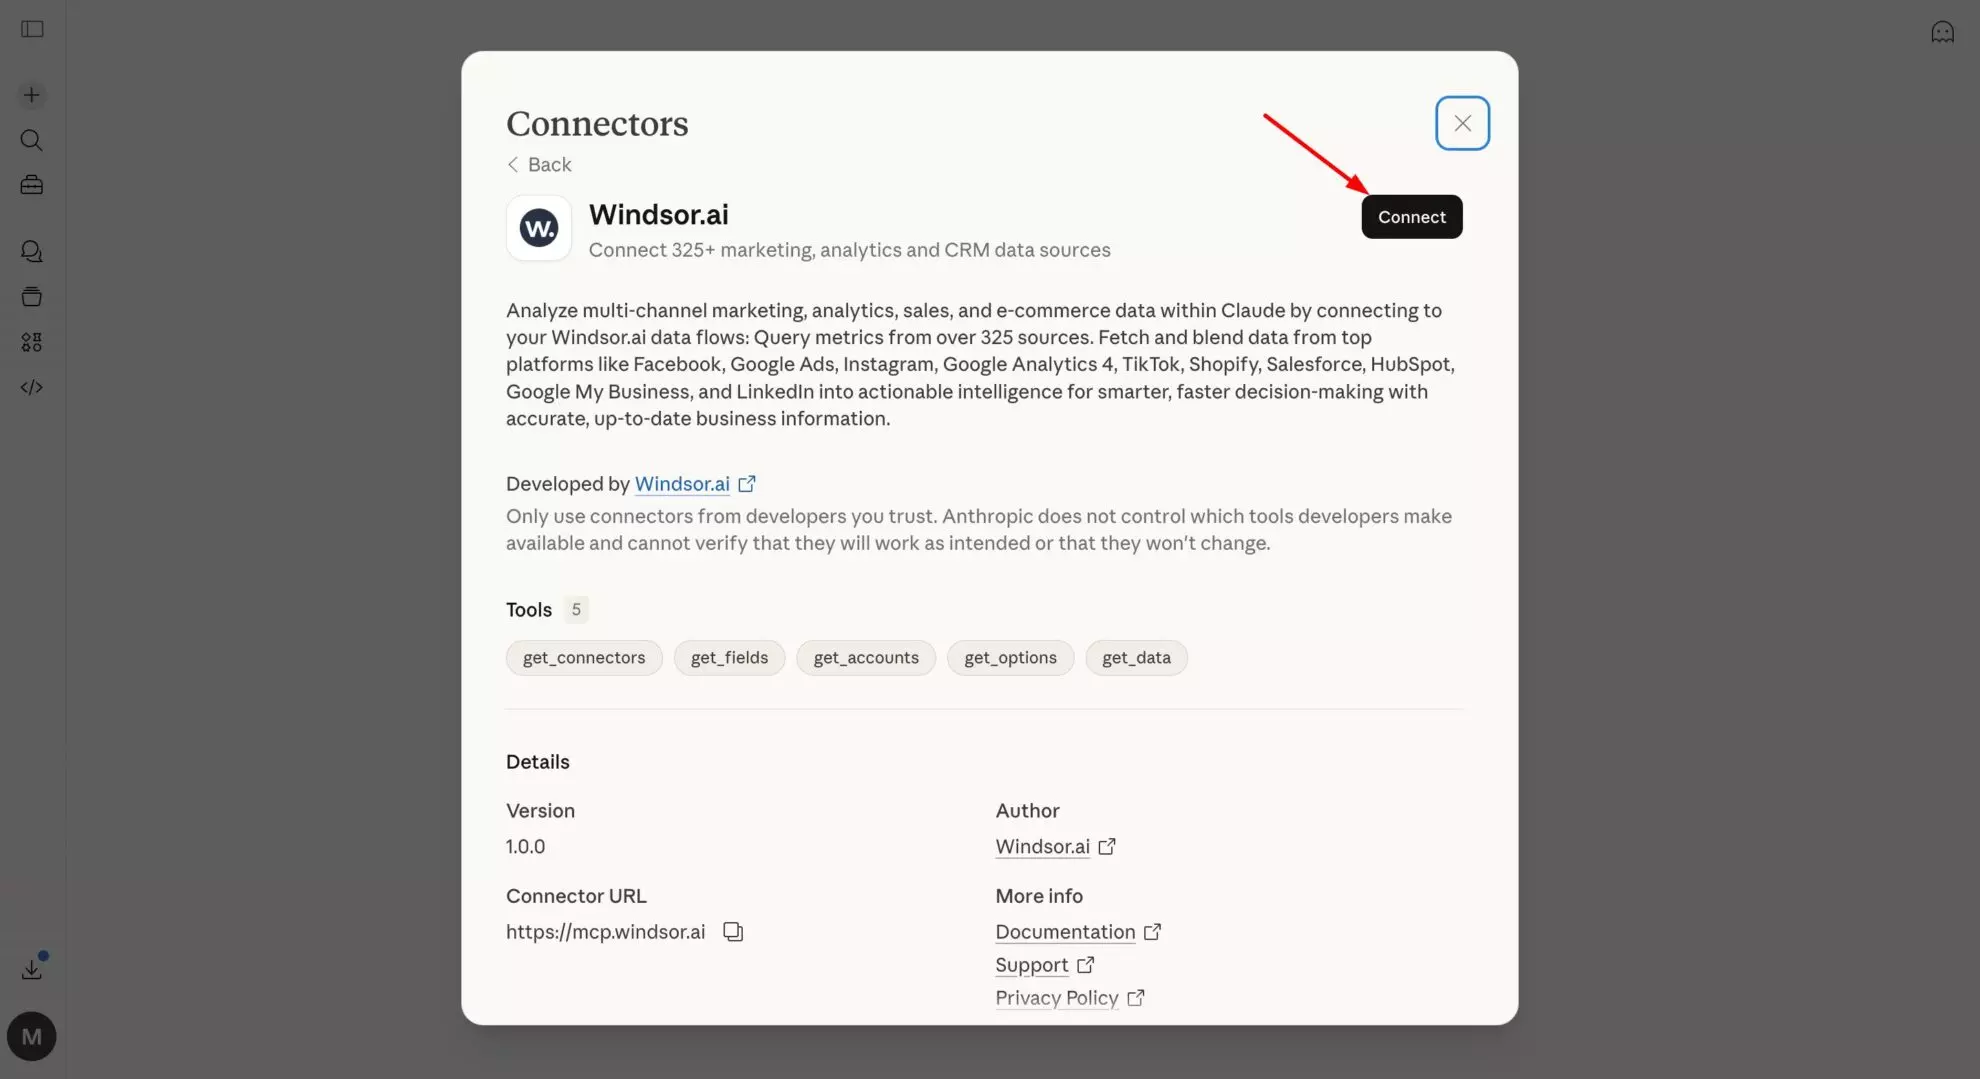
2. Open the Windsor.ai connector in Claude and connect it.
💡 Pro tip: Point Windsor at your production dbt schema rather than raw source tables. Your dbt models are already cleaned, joined, and named for human readability, which is the preferred layer for natural language analysis.
3. Start querying your Snowflake tables in Claude using prompts tailored to your data and business use cases. For example:
- “Compare customer acquisition cost (CAC) vs. lifetime value (LTV) across all acquisition channels.”
- “Identify campaigns that generate high initial conversions but low repeat purchases.”
- “Find customers who churned in the last 90 days and analyze their behavior in the 30 days before churn.”
- “Calculate churn rate by customer segment, plan type, and acquisition channel.”
Prompt ideas: What you can do with your Snowflake data in Claude
The use cases below reflect the most common types of analyses teams run on Snowflake. Adapt the prompts to match your actual table and column names.
🤖 For more prompt ideas various data sources, browse the Windsor AI Prompt Library.
If your Snowflake warehouse contains revenue and financial data
Revenue data is among the most commonly centralized datasets in Snowflake, usually sourced from billing systems like Stripe or Chargebee via Windsor.ai, then modelled in dbt into MRR tables, cohort tables, and churn snapshots.
This is where CFOs and finance teams most want self-serve access, and where natural language analysis adds the most immediate value.
Prompt to explore the MRR movement: what drove growth or decline this month?
Using the fct_mrr_movements table, for the current month compared to last month, show the full MRR waterfall:
- Beginning MRR
- New MRR (new logos)
- Expansion MRR (upsells, seat additions, plan upgrades)
- Contraction MRR (downgrades)
- Churned MRR (cancellations)
- Reactivation MRR (returning customers)
- Ending MRR
- Net new MRR and net growth rate

Break each component down by plan_type and sales_region.

Which segment drove the largest expansion?
Which had the highest churn this month in absolute dollar terms?
Prompt to calculate cross-margin by product line: are all revenue streams equally profitable?
Join the fct_revenue table with the fct_cogs table using product_line_id and month as join keys.

For each product_line_name, show:
- Total revenue
- Total COGS (cost of goods sold)
- Gross profit
- Gross margin %

Compare this month vs. the same month last year.

Which product lines have improved margin year-over-year?
Which have deteriorated?
Flag any product line where gross margin dropped more than 5 percentage points versus prior year.
Prompt to estimate budget vs. actuals: where did spending diverge from plan?
Using the fct_budget table and fct_actuals table, for the current fiscal quarter to date, compare budget vs. actual spend for each department and cost_category.

Calculate:
- Budget amount
- Actual spend to date
- Variance (actual - budget)
- Variance % (variance / budget)
- Projected full-quarter spend at current run rate

Flag any department where the variance exceeds +15% or -15%.
Which cost categories are most consistently over-budget across multiple departments?
Prompt to evaluate cohort revenue retention: how do different customer cohorts hold their value?
Using the fct_cohort_revenue table, for customers acquired in each quarter of the last 2 years:

Show revenue retained at 3, 6, 9, and 12 months as a percentage of initial contract value. Calculate net revenue retention (NRR) per cohort, accounting for expansion and contraction.

- Which acquisition quarter has the best 12-month NRR?
- Which cohort shows the sharpest contraction between month 3 and month 6 — a signal of value realisation issues in that period?
- Is there a pattern between acquisition_channel (from the dim_customers table) and 12-month NRR?
If your Snowflake warehouse centralizes marketing and attribution data
Snowflake’s position as a neutral centralization layer makes it the ideal place to solve the marketing attribution problem — ad spend data from every platform sits in the same database as actual revenue data from the CRM and billing system.
The cross-source joins that are impossible inside any single ad platform become routine queries in Snowflake.
Prompt to calculate full-funnel attribution: from ad spend to closed revenue
Join the fct_ad_spend table (with campaign_name, channel, spend, date) with the fct_pipeline table (opportunity_id, campaign_source, arr_value, stage, close_date) and fct_revenue table (account_id, mrr, start_date).

For each marketing channel and campaign, show:
- Total spend (last 90 days)
- Influenced pipeline created (opportunities where campaign_source matches)
- Pipeline-to-close rate
- Closed ARR influenced
- Marketing-sourced revenue ROI (closed ARR / spend)
- Average sales cycle from first ad touch to closed-won

Which channels drive the most pipeline?
Which drive the most closed revenue?
Are there channels with strong pipeline creation but low close rates — signal of lead quality issues?
Prompt for marketing mix analysis: how should the budget be reallocated?
Using fct_ad_spend and fct_conversions (joined by utm_campaign), for the last 6 months by channel (paid_search, paid_social, display, email, organic, direct):

Calculate:
- Total spend
- Total conversions (trials, sign-ups, or demos — define as relevant)
- Cost per conversion
- Conversion-to-customer rate (from fct_customers, joined by conversion_id)
- Average customer LTV at 6 months (from fct_ltv)
- Blended ROAS (LTV * conversion-to-customer rate / cost per conversion)

If budget were reallocated to maximize blended ROAS, which channels would grow and which would shrink?
Model the outcome of a 20% budget shift from the lowest-ROAS channel to the highest.
Prompt to define how content and SEO performance are tied to pipeline
Join the fct_web_sessions table (session_id, page_path, utm_medium, first_touch_date, user_id) with fct_pipeline (user_id, opportunity_id, arr_value, stage).

For each top-level content category (grouped from page_path):
- Total organic sessions in the last 90 days
- Sessions that converted to a sign-up or trial (from fct_conversions)
- Sessions that influenced an open pipeline opportunity
- Influenced ARR in pipeline

Which content categories drive the most pipeline influence?
Which have high session counts but zero pipeline attribution?
Is there a difference in influenced ARR between users who visited 3+ pages vs. those who visited only 1 before converting?
If your Snowflake warehouse stores product usage and user behaviour
Product teams that pipe Segment or Amplitude events into Snowflake have access to a level of analytical depth that in-product analytics tools can’t match, because in Snowflake, event data sits next to billing data, CRM data, and support data.
The analysis that was impossible inside Mixpanel becomes straightforward using the Snowflake to Claude integration.
Prompt to explore feature adoption and retention: which product behaviours predict long-term retention?
Using fct_user_events and fct_subscriptions, for users who signed up in the last 6 months, create two cohorts:
1) Retained: still active at day 90
2) Churned: cancelled before day 90

For each cohort, calculate the average number of times each event_name was triggered in the first 14 days after signup.

Which events appear at least 2x more frequently in retained users?
These are our activation milestones.

Then: for users who hit all 3 top activation milestones within 7 days, what is their 90-day retention rate compared to users who hit none?

Quantify the retention lift in percentage points.
Prompt to track product-led growth by understanding free-to-paid conversion by feature
Using fct_user_events (for free-tier users), fct_subscriptions (with conversion_date and plan_type), and dim_features:

For each feature_name that free users accessed in their first 30 days:
- % of users who accessed that feature and converted to paid within 60 days (conversion lift)
- Average days to conversion for users who accessed it
- % of paid revenue from converted users on each plan_type

Compare to the baseline conversion rate for users who didn't access that feature.

Which features are most predictive of paid conversion?
Which features are accessed frequently by free users but show no correlation with conversion — potential paywall candidates?
Prompt to understand support ticket impact on retention: quantifying the churn cost of bugs
Join the fct_support_tickets table (ticket_id, user_id, category, priority, created_at, resolved_at) with fct_subscriptions (user_id, plan_type, churned_at, churn_reason).

For each ticket_category:
- Total tickets in the last 90 days
- Average resolution time (hours)
- Churn rate of users who submitted a ticket in that category within 30 days of ticket creation (vs. overall churn rate)
- Estimated ARR at risk: churned ARR from users who submitted tickets in that category

Which categories have a churn rate more than 10pp above baseline?
These are product problems with a quantifiable revenue cost.

For high-priority tickets (priority = 'critical' or 'high'): does faster resolution time correlate with lower subsequent churn?
If your Snowflake warehouse is your RevOps single source of truth
Revenue operations teams that centralize CRM data, billing data, and marketing data into Snowflake have built the infrastructure for true revenue intelligence.
The challenge has always been turning that infrastructure into a self-service analytical source for sales leaders and executives.
Prompt to check pipeline coverage and forecast roll-up across teams
Using fct_pipeline (with opportunity_id, owner_id, stage, arr_value, close_date, forecast_category) and dim_sales_reps (owner_id, team, region, quota_amount):

For each sales_region and team, show the current quarter:
- Quota target
- Closed-won ARR to date
- Quota attainment %
- Open pipeline by stage (breakdown: Commit, Best Case, Pipeline)
- Pipeline coverage ratio (total open pipeline / remaining quota)
- Weighted pipeline (arr_value × stage_probability)

Flag any team where pipeline coverage is below 3x remaining quota.

Flag any rep where more than 60% of their pipeline is in a single deal — concentration risk.

Which region has the highest percentage of Commit-stage deals that have not had an activity logged in 14+ days?
Prompt for win/loss analysis: why deals are being lost and to whom?
Using fct_pipeline (closed opportunities, last 6 months) with dim_competitors (if available) and dim_accounts (industry, size, region):

For closed-lost opportunities:
- Top 5 loss_reason values by frequency and by lost ARR
- Breakdown by account_industry and account_size_band
- Average deal size of lost vs. won opportunities
- Average sales cycle length for lost vs. won

Where competitor data is available:
- Win rate by primary_competitor
- Average deal size when a specific competitor was involved
- Which competitors appear most in deals above $50k ARR?

Are there patterns in lost deals by rep tenure, industry vertical, or deal size that suggest where to focus coaching or ICP refinement?
If you’re a data or analytics engineer enabling stakeholder self-serve
For data teams, connecting Snowflake to Claude through Windsor MCP isn’t just about answering their own questions faster — it’s about reducing the volume of ad-hoc requests that land in their queue every week.
When business stakeholders can ask their own questions against a governed, curated Snowflake schema, the data team gets time back to build instead of query.
Prompt to get schema documentation on demand: making your dbt models self-explanatory
Look at the tables available in the ANALYTICS schema. For each table:
- Describe what it represents based on its name and column names
- Identify the grain (what does one row represent?)
- List the most useful columns for business analysis, with plain-English explanations of what each measures
- Identify likely join keys to other tables in the schema

Generate a stakeholder-readable data dictionary that a non-technical business user could use to understand what questions each table can answer.
Prompt for executive briefing: auto-generating the weekly business review
Using the fct_mrr_movements, fct_pipeline, fct_ad_spend, and fct_product_usage tables, generate a weekly business review summary for the week ending [date]:

Structure it as follows:
1. Revenue (2-3 sentences): MRR vs. prior week, net new MRR drivers, any notable churn or expansion
2. Pipeline (2-3 sentences): new pipeline created, total open pipeline, deals closing this week
3. Marketing (2 sentences): spend and revenue vs. prior week, top-performing channel
4. Product (2 sentences): DAU/WAU trend, any notable feature adoption changes

Write for a non-technical executive audience.
Lead with the headline number, then explain the key driver, then flag the one thing that needs attention.
No jargon, no raw metric names — just plain business language.
How Windsor MCP works with Snowflake and Claude
Windsor connects to Snowflake via Snowflake’s SQL API using a read-only service account. It enumerates your selected databases, schemas, and tables, and makes the full structure (column names, data types, table relationships) available to Claude as an AI-ready dataset.
Here’s how it works:
-
Production-safe and cost-controlled.Windsor’s Snowflake connector uses a read-only role and runs all queries as
SELECTstatements. You control which virtual warehouse Windsor uses; assign a dedicated XS or S warehouse to cap credit consumption. - Schema-aware, not schema-fixed. Windsor reads your actual Snowflake schema. There is no field mapping step, no fixed field list. If you rename a dbt model or add a column, it’s available in the next Claude conversation automatically.
- Works across databases and schemas. Windsor can expose multiple tables and schemas from the same Snowflake account. Claude can join across tables in a single prompt, for example, joining your MARKETING table to your FINANCE table to answer a revenue attribution question.
- Cross-source blending beyond Snowflake. Windsor connects to 350+ data sources. If your Snowflake warehouse doesn’t yet contain a particular data source, for example, you haven’t yet piped your Google Ads data into Snowflake, Windsor can pull that source directly and make it available in the same Claude conversation alongside your Snowflake data.
What actually lives in Snowflake, and why analysis is still hard
Snowflake warehouses typically contain a cross-functional mix of data that no single other system has:
| What’s in Snowflake | Where it came from |
| Revenue & MRR data | Stripe, Chargebee, Recurly, Zuora — subscription and billing events normalised into MRR tables |
| CRM pipeline data | Salesforce, HubSpot — opportunities, accounts, deals, activities, forecast categories |
| Marketing spend & attribution | Google Ads, Meta Ads, LinkedIn — campaign spend blended with UTM-matched conversion data |
| Product telemetry & events | Segment, Amplitude, Mixpanel, or custom event pipelines — user actions, feature usage, session data |
| Customer success data | Gainsight, Intercom, Zendesk — health scores, ticket volumes, NPS, engagement signals |
| Financial & accounting data | QuickBooks, NetSuite, Xero — COGs, gross margin, expense categories, budget vs. actuals |
| ERP & operational data | SAP, Oracle, custom ERPs — inventory, fulfilment, supply chain, procurement |
| HR & workforce data | BambooHR, Workday, Rippling — headcount, hiring, attrition, compensation bands |
The power of Snowflake is that all of this is queryable together; you can join CRM pipeline data to billing data to product usage data in a single query. The problem is that doing so requires knowing which tables to join, how they relate, what the field names mean, and enough SQL to write it correctly.
That’s a data team problem. And data teams are always the bottleneck.
⚙️ Windsor MCP removes the SQL requirement entirely. Claude connects to your Snowflake schema, understands the structure of your tables, and covers cross-schema analysis.
Conclusion
Windsor MCP gives Claude live access to your Snowflake tables and schemas. The analysis that used to require a ticket, a query, and a two-day turnaround now takes a single sentence.
For finance teams, that means MRR waterfalls and margin analysis on demand. For marketing, it means true cross-channel attribution without a custom SQL join. For RevOps, it means pipeline roll-ups and win/loss analysis any time leadership asks. For data teams, it means fewer ad-hoc requests and more time to build.
The warehouse is already insightful. Now, anyone can use it.
🚀 Build your first Snowflake to Claude intgeration with Windsor MCP. Start for free: https://onboard.windsor.ai/app/snowflake.
FAQs
What are the available methods to connect Snowflake to Claude?
There are several ways to connect Snowflake to Claude, depending on your setup and how much control you need:
- Windsor MCP (direct connector for Claude): No-code setup at onboard.windsor.ai. Windsor connects to Snowflake, enumerates your selected schemas and tables, and makes them live inside Claude. Stream your data to Claude.ai directly, no engineering required.
- Custom MCP server: Build your own MCP server that connects to Snowflake via the Snowflake Python connector or SQL API and exposes specific queries or table views to Claude. Full flexibility, but requires ongoing development and maintenance. Suited to engineering teams with strict security or data governance requirements.
- Manual data export: Run a query in Snowflake, export results as CSV, and upload or paste into Claude for one-off analysis. No setup required, but data is immediately stale, there is no cross-table joining, and it does not scale beyond isolated, non-recurring questions.
- BI tool as intermediary: Connect Snowflake to a BI platform (Looker, Tableau, Power BI) and then connect that platform to Claude via its own integration. Adds an extra hop and limits analysis to what the BI tool’s data model exposes; Claude cannot query Snowflake directly in this setup.
What is the easiest way to connect Snowflake to Claude?
Windsor MCP. Enter your Snowflake credentials at onboard.windsor.ai — Windsor handles the rest. Add Windsor as a connector in Claude’s settings, and your Snowflake tables are live in every Claude conversation from that point on. No SQL, no code, no engineering work. Setup takes under a minute.
How does Windsor handle Snowflake’s role-based access control?
Windsor connects using whichever Snowflake role you specify at setup. The role determines which databases, schemas, and tables Windsor can see, and therefore what Claude can query. The recommended setup is to create a dedicated WINDSOR role with USAGE on the relevant databases and schemas, and SELECT on the specific tables or views you want to expose. Windsor will only surface what that role can access.
Should I point Windsor at raw source tables or dbt models?
Always point Windsor at your dbt production models if you have them. Your fct_ and dim_ models are already at the right grain, have business logic applied, and use human-readable column names. Claude performs significantly better against a well-structured dbt schema than against raw source tables with cryptic column names and unnormalised data. If you don’t use dbt, point Windsor at whatever schema represents your most refined, business-ready data layer.
Will Windsor’s queries consume Snowflake credits?
No, Claude connects to your Windsor-integrated data, not to the Snowflake API, which means it doesn’t consume compute credits.
Can Windsor access multiple Snowflake databases in the same Claude conversation?
Yes. You can connect tables from multiple databases and schemas within the same Snowflake account, and all of them are available in a single Claude conversation. Claude can join across databases and schemas in a single prompt, for example, joining your MARKETING.fct_ad_spend table to your FINANCE.fct_revenue table to answer a revenue attribution question.
Can I use Windsor to connect Snowflake alongside other data sources in Claude?
Yes, and this is one of the most powerful use cases. If your Snowflake warehouse doesn’t yet contain all your data sources, for example, you haven’t piped your Google Ads or Salesforce data into Snowflake yet , Windsor can pull those sources directly via their native connectors and make them available in the same Claude conversation as your Snowflake tables. You just need to connect all the required data sources to Windsor.ai via https://onboard.windsor.ai/.
What if my Snowflake schema is very large — hundreds of tables?
Windsor lets you select which tables to expose to Claude; you don’t need to connect the entire warehouse. Start with a few tables that answer the most common business questions and add more as needed.

