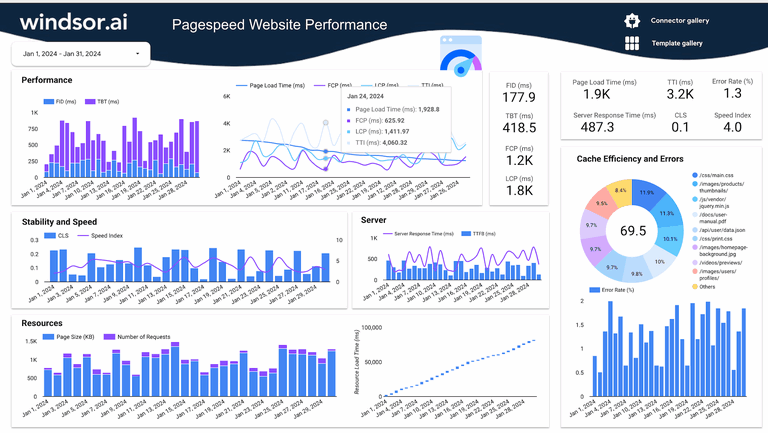
Want to uncover the full potential of your data with Google PageSpeed Insights templates? Automatically sync the templates with Looker Studio to access multiple analysis and visualization tools. You can create beautiful and colorful reports with charts and graphs that highlight different web performance metrics. Tell your data stories to stakeholders in a way that appeals to them and drives actionable insights. Consequently, this facilitates informed decision-making, leading to improved user experience on your website.
Benefits of Looker Studio Dashboard for Google PageSpeed Insights
Syncing your Google PageSpeed Insights templates with Looker Studio is the best decision you could ever make for your business. Here are the numerous benefits you stand to enjoy:
Centralized data visualization
With Looker Studio, it’s possible to collate Google PageSpeed Insights data from numerous websites and pages into one comprehensive dashboard. This means you can track and compare metrics like speed index, estimated input latency, and First Contentful Paint (FCP) across different websites. By understanding your website performance, you can optimize your page to enhance user experience.
Cache efficiency and error analysis
Looker Studio visualizes cache-related issues and error metrics based on your Google PageSpeed Insights dashboard data. Gain insights on cache hit rates, resource caching status, specific errors on your site, etc. As a result, you can identify problems faster, streamline troubleshooting, and prioritize fixes, ultimately improving loading times and minimizing errors.
Better resource allocation
Looker Studio helps you identify well-performing and poor-performing areas on your website and pages. So, you can decide where to allocate more money, developer time, and tools. Moreover, the information allows you to prioritize tasks that potentially generate the highest performance gains and minimize operational costs.
Save time
Formulating marketing reports manually from your PageSpeed Insights data takes a lot of time and increases the risk of making errors. Looker Studio makes it easy to automate and report on the data with customizable templates. This not only helps you save time but also allows you to generate error-free reports that lead to more accurate insights you need to improve results.
Highlight and showcase your brand
Your Google PageSpeed Insights report templates on Looker Studio can feature your brand’s components. The business intelligence tool enables you to include your logo, images, colors, fonts, and style. Therefore, your reports can communicate to various stakeholders in a professional way and further strengthen your brand.
Easy sharing
Looker Studio’s realtime dashboard is easy to share with team members, clients, or other stakeholders through options like direct URLs and scheduled email reports. Whether you want to present findings on PageSpeed Insights data or allow team members to track metrics in real-time, Looker Studio ensures you distribute information hassle-free and keep all parties informed.
Custom alerts
Set up custom alerts based on Google PageSpeed Insights data using Looker Studio to notify you when performance metrics surpass or go below specified thresholds. By alerting you on potential issues like a decline in page speed, caching efficiency, or increase in error rates, Looker Studio enables you to act faster. This minimizes negative effects on your website’s performance and optimizes the overall user experience.
How to use it
- Configure the Looker Studio Connector: PageSpeed Insights
- Once you finish installing the connector open the PageSpeed Insights Dashboard and make a copy of it (File -> Make a copy)
- Select the newly created data source.
- Now your dashboard is set up
