 AI insights
 About us
 Careers
 Security
 Customer reviews
 Contact us
 Affiliate program
 Solution partners
 Looker Studio templates
 Tableau templates
 Facebook Ads templates
 Google Ads templates
 Data fields & Metrics
 AI prompt library & Guides
 Product documentation
 API documentation
 Case studies
 Blog
Blog Data models
 Windsor vs Supermetrics
 Windsor vs Fivetran
 Windsor vs Portermetrics
 Last updated: 11 September 2025

Every mobile app owner wants to achieve growth, but most don’t clearly understand what actually drives app success. Downloads look good on paper, but without knowing how users behave inside the app, those numbers mean little.
Are people dropping off during onboarding? Do they abandon sessions halfway through? Is performance worse on certain devices?
Mobile data analytics answers these questions. It reveals what users actually do, where they lose interest, and what keeps them coming back. It shows how crashes, slow loading times, or poor UX quietly kill retention. It also connects product behavior with marketing performance, so you see not only who arrived, but who stayed, and why.
In a space where thousands of apps fight for attention, the ones that analyze their data gain a real edge. This article explains which mobile metrics matter, how to interpret them, and which tools help turn data into smart decisions. If you’re just building or already promoting a mobile app, this is the fundamental aspect deserving your attention.
Why does mobile data analytics matter for growth?
Most apps don’t fail because the idea is bad. They fail because product managers don’t know what users do once they download them. One feature is used constantly, while another is barely touched, but unless you track that, you keep building in the dark.
Mobile data analytics helps you see what’s actually going on. It shows which screens users open, how long they stay, where they drop off, and when they come back. You stop guessing and start noticing patterns. Some teams use it to fix what slows people down. Others use it to double down on what works. But almost everyone who grows fast has this in place.
Who needs mobile analytics the most?

- Product teams want to understand how people move through the app after sign-up. Analytics helps them spot friction in onboarding, unused features, or confusing flows, so they can improve what matters without guessing. Integrating these insights into a product roadmap tool ensures that teams can prioritize improvements based on real user behavior, aligning development efforts with measurable impact.
- Developers use performance data to catch crashes, delays, and bugs that users never report. They rely on app performance analytics to find issues tied to specific devices, OS versions, or network problems before they affect retention.
- Marketers check whether users from ad campaigns stick around or vanish after the install. With analytics, they can link spend to real actions like signups, purchases, or feature usage, and avoid wasting budget on empty clicks.
- Founders and product leads use mobile data to track progress and decide what to focus on next. It helps them see whether the product delivers value, which segments respond best, and whether recent updates improved anything at all.
In short, mobile analytics puts reality in front of you. If something kills your growth, the data shows it. If something works, it confirms that, too. Without this feedback loop, you’re just building based on vibes, and that doesn’t scale.
Key mobile app analytics metrics to track
You don’t need to track everything. But you do need to track the right things. Some numbers only look nice in a report, while others actually explain what’s going wrong or what drives growth.
Here are the metrics that matter most when it comes to mobile app analytics:
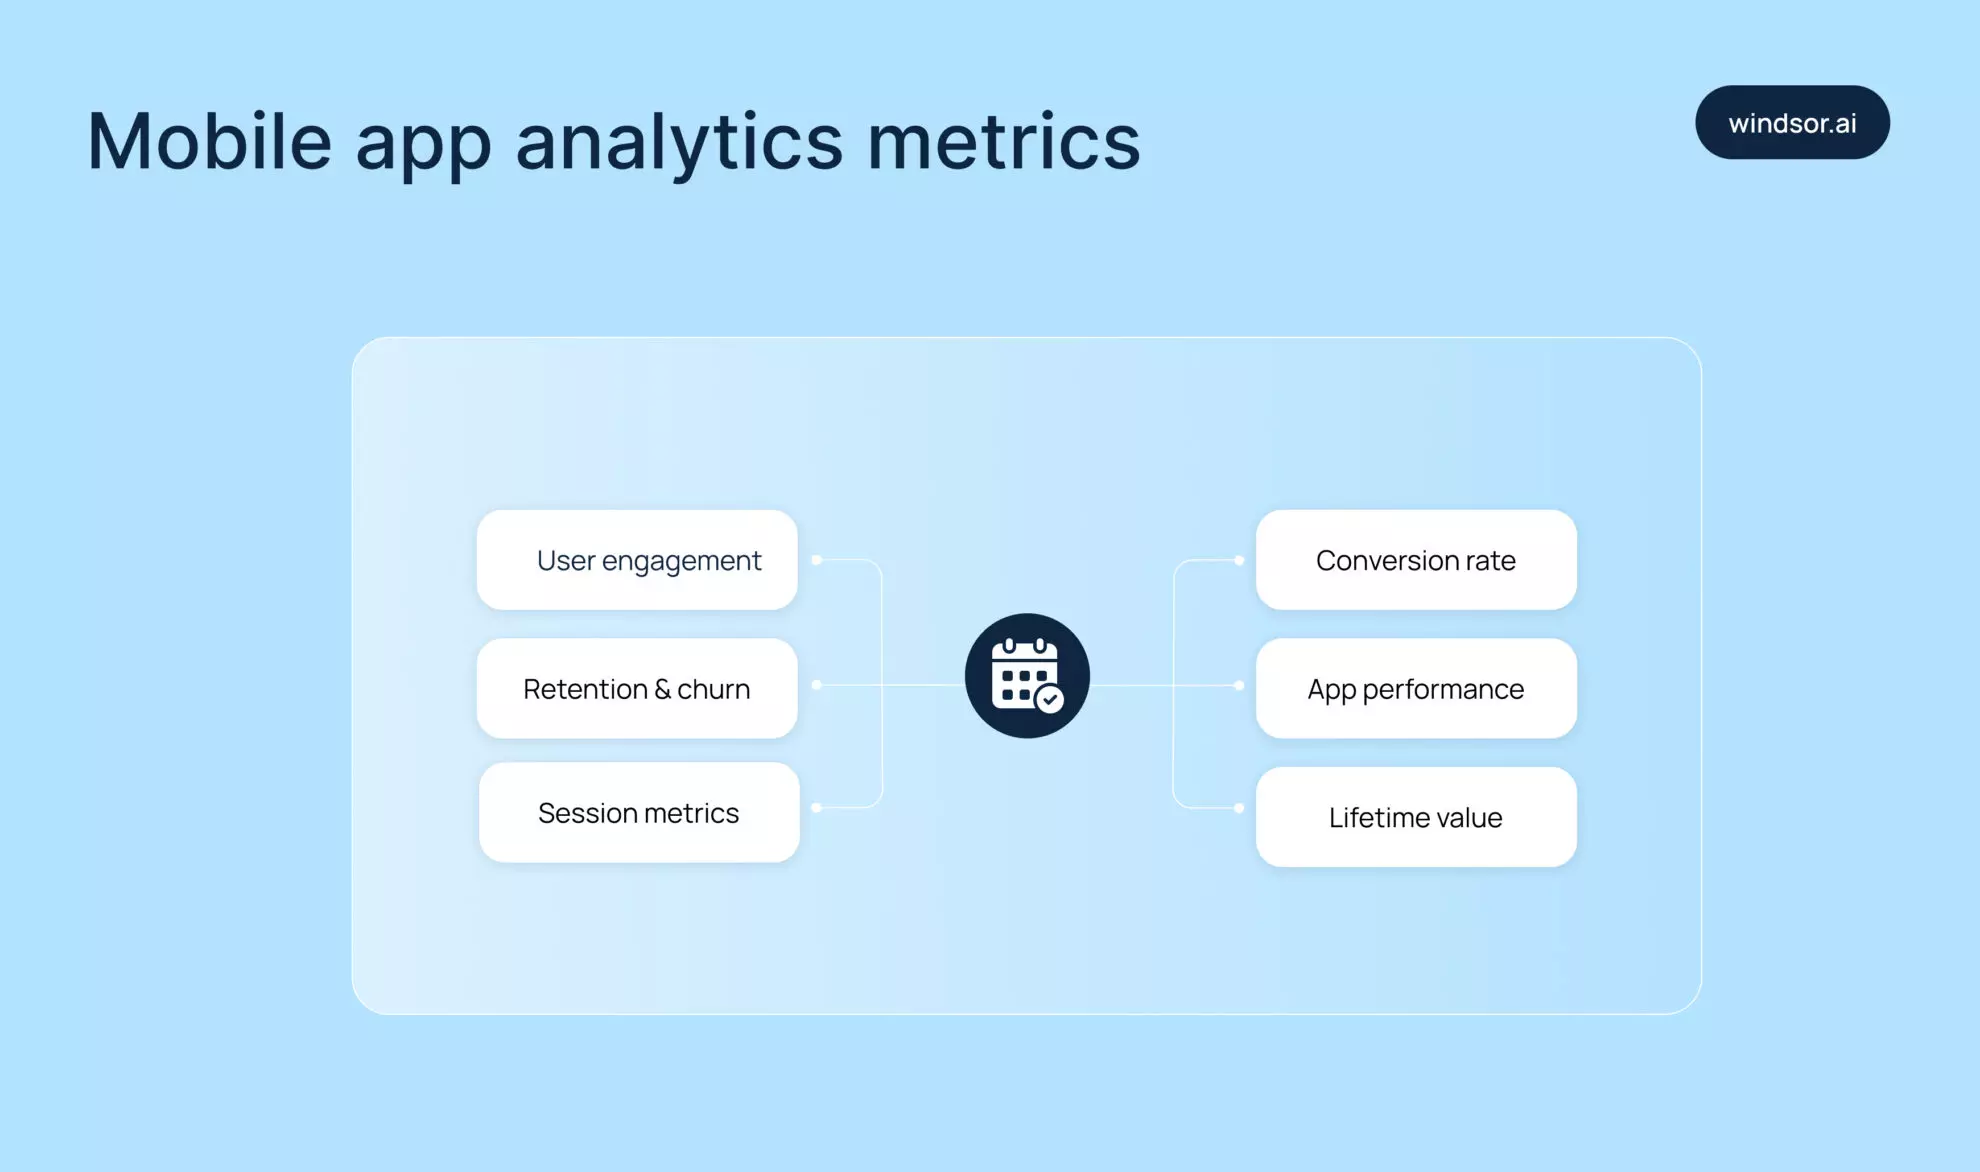
- Start with daily and monthly active users (DAU / MAU). These show how many people use your app regularly, not just how many have installed it. High download counts mean little if nobody opens the app twice.
- Then look at the retention rate. It shows how many people come back after the first day, first week, or first month. A sharp drop usually means users either didn’t get value or hit friction too early.
- On the flip side, churn rate tells you how many users leave and never return. When churn spikes, it usually means something’s broken or never clicked in the first place. It could be a confusing first-time experience, buggy screens, or just the wrong audience.
- And then there’s session length. If someone opens your app and leaves in seconds, that says a lot. Maybe they didn’t get what they expected. Maybe the app didn’t load fast enough. Either way, short sessions often point to missed expectations. If they drag on, the app might be slow or hard to navigate.
- Pair that with session frequency – how often users come back. A helpful app becomes part of someone’s routine. If they barely open it once a week, something’s missing.
- Conversion rate measures whether users take key actions: signups, purchases, and upgrades. It connects behavior to business value and shows whether your funnel holds up under real use.
- Sometimes the app works fine in testing, then falls apart in the wild. It freezes on one phone, drains battery on another, or crashes right before checkout. You won’t always catch that in QA, but users will. That’s why app performance analytics matters. It helps you spot these issues early, see where they happen, and fix them before angry reviews start rolling in.
- Finally, there’s lifetime value (LTV). It shows how much revenue an average user brings over time, from subscriptions, in-app purchases, or anything else that adds up. If your LTV is lower than what it costs to acquire a user, even great engagement won’t save the business. Growth that looks good on the surface can still lose money underneath.
Tracking these mobile data analytics metrics doesn’t just show what users do. It shows what needs fixing, what to double down on, and whether your app is actually growing (or just surviving).
Take Clever Cleaner as an example. It’s a free iPhone cleaner that helps users bring order to their photo and video libraries. The app tracks how often people use the cleanup feature, what they usually ignore, and which tools they actually return to. That kind of data helps the team understand what matters to users and decide what to improve next.
Top mobile analytics tools that actually help you grow
We’ve gone through the key metrics. Now it’s time to talk about how to track them.
Plenty of mobile analytics tools promise to solve everything, but each one comes with trade-offs. Some are easy to start with, but limited in flexibility. Others give you more control but take longer to set up.
Before choosing, it helps to understand what each one actually does and what kind of data you really need.
1. Google’s Firebase
It’s usually the first stop for many mobile teams and for good reason. It’s free, easy to integrate, and covers the basics: active users, session data, retention, and crash reports.
You also get real-time analytics and event tracking without much setup. It works especially well for Android apps, but iOS support holds up too. It’s a solid choice for small to mid-sized teams that want clean data without a complex learning curve.
2. Mixpanel
Mixpanel goes deeper than Firebase. It’s all about understanding how people move through your app, step by step. You can build funnels, track drop-offs, and compare behavior across segments.
Want to know what percentage of users skip onboarding or never finish a signup flow? Mixpanel answers that without extra code. It suits teams that want product-level visibility and need to fine-tune the experience based on actual usage.
3. Amplitude
Amplitude feels similar to Mixpanel at first, but it gives more control over how you track behavior and make sense of it later. You can set up custom events, explore user paths, and tweak reports without writing SQL. Dashboards update fast, even with large data sets, and the tool handles them well without lag.
There’s also a layer of predictive analytics built in, which comes in handy when you’re trying to catch issues early. It’s a favorite among teams that have already moved past the MVP stage and need deeper insight without building out a full analytics team.
If numbers aren’t enough and you want to see how users actually behave, UXCam adds session replays, heatmaps, and screen recordings. You can watch real usage flows and spot where people rage-tap or get stuck. It’s especially useful for UX and design teams that want more than just charts – they want to understand how the app feels in practice.
4. Windsor.ai
While all the abovementioned tools focus on in-app behavior, Windsor.ai helps you automatically extract data from Mixpanel and Amplitude and send it to any analytical environment, be it a BI tool or data warehouse.
You can also feed that data into your preferred LLM via our powerful MCP server. There, you can ask questions to know which campaigns bring not just downloads, but high-value users who stick around and convert. If you’re spending money on ads, this is how you make sure it’s not going to waste.
Not every app needs deep funnels or cross-channel attribution from day one. The best tool depends on what you want to understand and how your team works. Also consider the size of your app, your budget, and your internal skill set. Some tools require more setup and data modeling than others. Some prioritize simplicity, while others give full control. The key is to pick one that fits your current goals, not just your future roadmap.
Now, when you have mobile data analytics. What’s next?
Data on its own doesn’t change anything. What matters is how you read it and what you do with it. Growth happens when teams use analytics to find out what holds users back, what pulls them in, and what needs to change next.
Sometimes it’s obvious. People drop off on the third screen of onboarding? That’s where you look first. But often, the data points to smaller things, like a button that never gets tapped, or a feature that launches but no one returns to.
This is where actionable insights come in. They describe behavior and also suggest what to fix. For example, if users spend time setting up their profile but never use sharing features, maybe those features are too hidden. If paid users cancel after one week, something in the experience pushes them away. Mobile app usage analytics helps teams connect these patterns to real outcomes and understand which parts of the app work and which ones quietly fail.
A/B testing makes it easier to stop guessing. Try out two versions of the same screen: one that asks less and another that explains more. Then, watch what people actually do. Do they finish the process? Do they leave halfway? It’s not just about clicks. You look at real differences: how many people sign up, how many stick around. Without that kind of data, every change feels like throwing darts in the dark. With it, at least you know where the board is.
Over time, this feedback loop starts to shape your product roadmap. You stop adding features just because competitors have them, and instead build what your users actually need. You focus on what moves numbers, not just what sounds good in a meeting.
Conclusion
You don’t need to track everything. In fact, if you try, you’ll probably end up staring at five dashboards and still not know what’s wrong. The goal isn’t to measure every tap; it’s to catch the signals that tell you where things are working, where they’re falling apart, and where you need to step in.
If you’re just getting started, begin small. Look at retention. Watch where users drop off. See which features they actually use. You don’t need to set up five platforms at once, so pick one tool that fits your team and build from there. As your app grows, so will your questions. That’s where tools like Mixpanel, Amplitude, and Windsor.ai start showing their value.
Before jumping into anything complex, talk to your team. If no one plans to check dashboards regularly, there’s no point in over-engineering. Also, look closely at what each tool tracks out of the box and what needs custom events or developer time. Some platforms seem simple until you try pulling the data that actually matters.
And remember that analytics won’t replace instincts, but it will keep you honest. Use it not to confirm what you hope is true, but to find out what’s actually happening.
Ready to stop guessing and start growing your mobile app with data-backed decisions?
Get started with Windsor.ai today with a 30-day free trial and automate your mobile analytics data integration, connect ad spend to real user behavior, and unlock actionable insights that truly drive retention and revenue.
👉 Build your first integration now and turn raw data into your app’s growth engine!

