 AI insights
 About us
 Careers
 Security
 Customer reviews
 Contact us
 Affiliate program
 Solution partners
 Looker Studio templates
 Tableau templates
 Facebook Ads templates
 Google Ads templates
 Data fields & Metrics
 AI prompt library & Guides
 Product documentation
 API documentation
 Case studies
 Blog
Blog Data models
 Windsor vs Supermetrics
 Windsor vs Fivetran
 Windsor vs Portermetrics
 Last updated: 11 September 2025

Today, marketing and data are completely tied together. Data-driven marketers are not only running ad campaigns or writing copy; they are also analyzing data to understand the effectiveness of every action taken.
Marketing dashboards can help you visualize data, but the real impact comes when you can extract deeper insights from your cross-channel data by asking the right questions using SQL (Structured Query Language).
Centralizing your marketing data in BigQuery
Before you can run SQL queries, your data has to be in BigQuery to create a single reliable source of truth.
For this, you have to merge data from all advertising (Google Ads, Facebook, Bing), web analytics (GA4, Amplitude), sales (Pipedrive, Zoho, Shopify), and CRM (HubSpot, Salesforce) platforms and send it to your data warehouse.
Don’t worry, you do not need to become a data engineer to connect all platforms to BigQuery. You can fully automate this task with a no-code data connector from Windsor.ai. Our platform covers the hardest part of data integration and unification, and delivers clean, analysis-ready datasets straight into your BigQuery project.
How to send your marketing data to BigQuery using Windsor.ai
The BigQuery data integration process with Windsor.ai is super quick and simple. You just connect your required marketing platforms (select from 325+ platforms) and choose BigQuery as the destination. Create a destination task with proper settings (choose your BigQuery project and schedule sync), and Windsor.ai will automatically handle data streaming. The entire process takes less than 5 minutes.
For a complete step-by-step integration guide, visit our documentation: How to integrate data into Google BigQuery with Windsor.ai.
You can also check out this video tutorial for visual instructions.
Now, you can forget dealing with messy CSVs and manual data pipelines that break all the time when source APIs change. Once Windsor connects and normalizes your data and sends it to BigQuery, you’ll have no more spending hours on manual data extraction and uploads. Instead, you can focus on unlocking valuable insights with SQL queries that actually help your business grow.
Use these top SQL queries to get marketing insights in BigQuery
Let’s explore 5 advanced SQL queries that help marketers uncover powerful insights from their BigQuery datasets.
Important: When writing these queries, replace the project and dataset names with your own. For example, if your project is called marketing-analytics and the dataset is ads_data, your table name would look like this: marketing-analytics.ads_data.marketing_touchpoints.
Query 1: Unified cross-channel performance overview
Question: “What’s my total spend, impressions, and clicks across all channels for the past 30 days, and how does it trend daily?”
Logic: Pull all your data from different platforms together into one table. Then group it by date so you can see a clear day-by-day picture. This makes it easy to build dashboards that give a quick overview for managers or executives.
Query:
SELECT
  date,
  SUM(spend) AS total_daily_spend,
  SUM(impressions) AS total_daily_impressions,
  SUM(clicks) AS total_daily_clicks,
  SUM(spend) / NULLIF(SUM(clicks), 0) AS blended_cpc
FROM (
  SELECT date, spend, impressions, clicks FROM `your_project.your_dataset.facebook_ads_insights`
  UNION ALL
  SELECT date, spend, impressions, clicks FROM `your_project.your_dataset.google_ads_insights`
  UNION ALL
  SELECT date, spend, impressions, clicks FROM `your_project.your_dataset.linkedin_ads_insights`
)
WHERE date >= DATE_SUB(CURRENT_DATE(), INTERVAL 30 DAY)
GROUP BY 1
ORDER BY 1 DESC;
💡 Performance tip: For large datasets, partition by date and cluster by channel.
Output:
- date: the day the metric belongs to
- total_daily_spend: the sum of spend across all platforms
- total_daily_impressions: the sum of impressions for that day
- total_daily_clicks: the sum of clicks for that day
- blended_cpc: the cost per click, calculated by dividing spend by clicks
BigQuery result snippet:
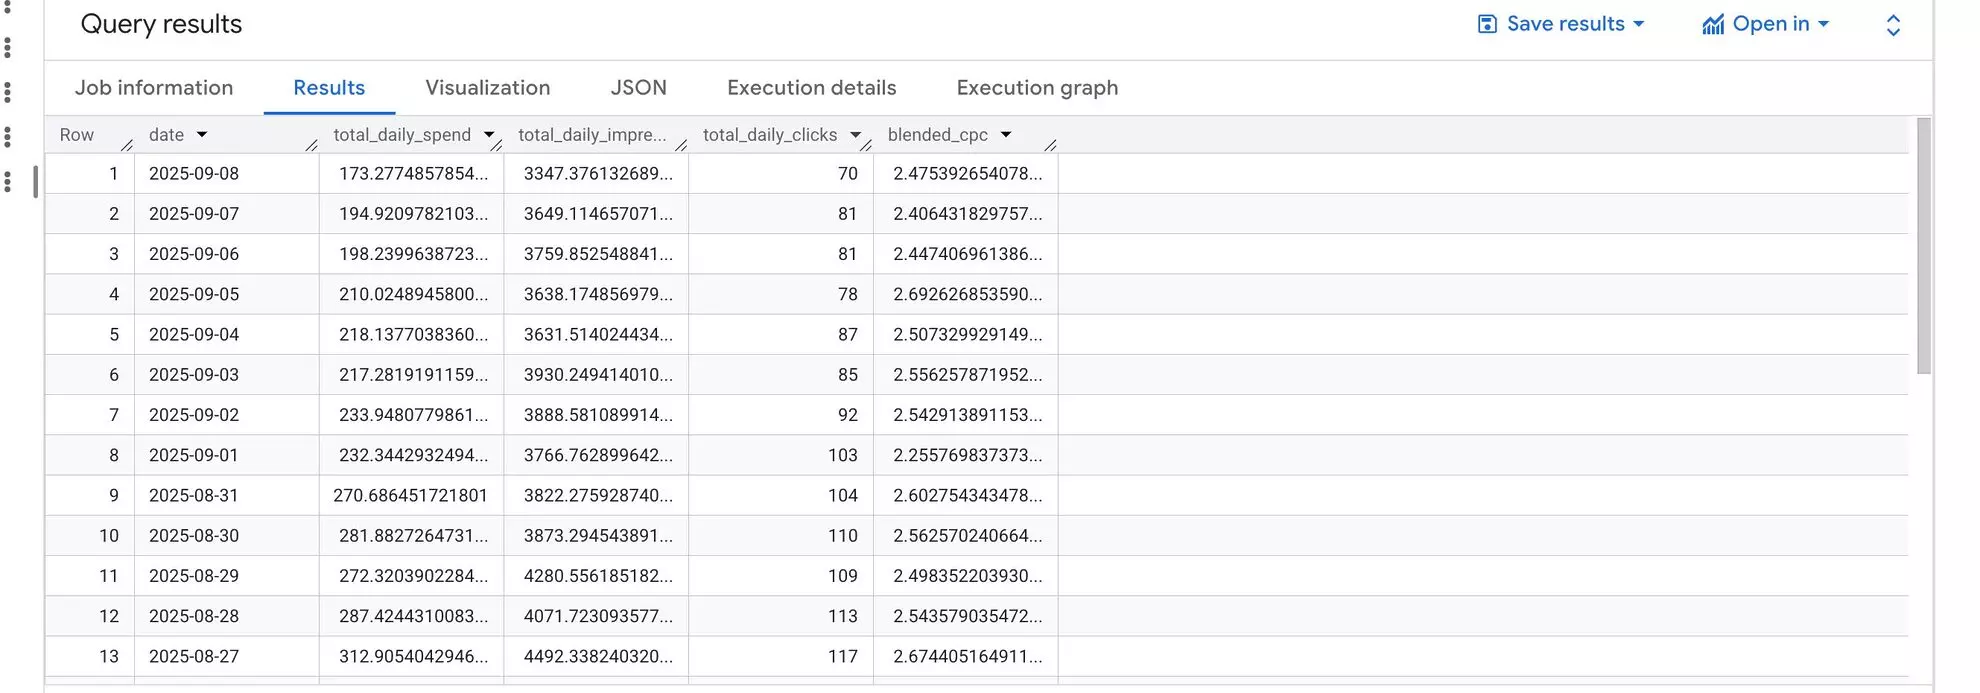
Interpretation: This table gives you a clean daily summary of total spend and engagement across all your connected platforms. It’s ready to use in BI tools like Looker Studio or Power BI. With it, you can quickly answer questions such as why spend went up on a specific day or whether your overall click volume is moving up or down.
Query 2: True ROAS by campaign
Question: “Which campaigns are truly profitable when measured against actual sales, not just ad platform conversions?”
Logic: Aggregate spend by campaign across platforms and join it with real sales revenue (from Shopify, Stripe, or your CRM) via utm_campaign. This produces ground-truth ROAS.
Query:
WITH campaign_spend AS (
  SELECT campaign_name, SUM(spend) AS total_spend
  FROM (
    SELECT campaign_name, spend FROM `your_project.your_dataset.facebook_ads_insights`
    UNION ALL
    SELECT campaign_name, spend FROM `your_project.your_dataset.google_ads_insights`
  )
  GROUP BY 1
),
sales_revenue AS (
  SELECT utm_campaign, SUM(order_value) AS total_revenue
  FROM `your_project.your_dataset.sales_orders`
  WHERE utm_campaign IS NOT NULL
  GROUP BY 1
)
SELECT
  cs.campaign_name,
  cs.total_spend,
  sr.total_revenue,
  sr.total_revenue / NULLIF(cs.total_spend, 0) AS true_roas
FROM campaign_spend cs
JOIN sales_revenue sr ON cs.campaign_name = sr.utm_campaign
ORDER BY true_roas DESC;
💡 Optional: Standardize currency if combining multiple regions/platforms.
Output:
- campaign_name: campaign identifier from ad platforms
- total_spend: combined ad spend across all sources
- total_revenue: real revenue from Shopify/Stripe/CRM
- true_roas: actual return on ad spend
BigQuery result snippet:

Interpretation: This table serves as a practical budget guide. It shows you which campaigns are truly driving profit and which ones only appear strong inside the ad platforms’ analytics.
Query 3: First-touch attribution by channel
Question: “Which channels attract more new customers to our brand?”
Logic: Using a window function, identify each customer’s first recorded touchpoint, then aggregate by channel.
Query:
WITH user_touchpoints AS (
  SELECT user_id, touchpoint_date, channel
  FROM `your_project.your_dataset.marketing_touchpoints`
  WHERE user_id IN (SELECT DISTINCT user_id FROM `your_project.your_dataset.conversions`)
),
first_touch AS (
  SELECT user_id, channel,
         ROW_NUMBER() OVER(PARTITION BY user_id ORDER BY touchpoint_date ASC) AS touch_rank
  FROM user_touchpoints
)
SELECT channel, COUNT(DISTINCT user_id) AS total_first_touch_conversions
FROM first_touch
WHERE touch_rank = 1
GROUP BY 1
ORDER BY 2 DESC;
💡 Performance tip: Cluster by channel if the dataset is large.
Output:
- Channel: your marketing channel
- total_first_touch_conversions: number of users for whom this was the first touchpoint
BigQuery result snippet:

Interpretation: This table highlights the number of new customers brought by every channel based on the first-touch attribution model.
Query 4: Ad creative fatigue analysis
Question: “Which ad creatives are losing effectiveness over time?”
Logic: Group ad performance data weekly and monitor CTR and CPA trends to spot ad fatigue.
Query:
SELECT
  DATE_TRUNC(date, WEEK) AS week_start,
  ad_id,
  ad_name,
  AVG(ctr) AS weekly_avg_ctr,
  AVG(cpa) AS weekly_avg_cpa,
  SUM(spend) AS weekly_spend
FROM `your_project.your_dataset.ads_daily_performance`
WHERE date >= DATE_SUB(CURRENT_DATE(), INTERVAL 90 DAY)
GROUP BY 1, 2, 3
HAVING SUM(spend) > 50
ORDER BY ad_id, week_start;
💡 Performance tip: Partition by date, cluster by ad_id for large datasets.
Output:
- week_start: the start of the week for grouping
- ad_id: unique ad identifier
- ad_name: creative name
- weekly_avg_ctr: average click-through rate for the week
- weekly_avg_cpa: average cost per acquisition for the week
- weekly_spend: total spend for the week
BigQuery result snippet:

Interpretation: By gathering these results, you can clearly see when ad CTR and CPA are going down or up. This gives you an early signal to update your creatives before they start wasting budget.
Query 5: Most common customer journey paths
Question: “What are the most common user touchpoint sequences that lead to conversion?”
Logic: Organize ordered touchpoints into a string for each user, then count the most frequent paths.
Query:
WITH user_paths AS (
  SELECT
    user_id,
    STRING_AGG(channel, ' > ' ORDER BY touchpoint_date ASC) AS conversion_path
  FROM `your_project.your_dataset.marketing_touchpoints`
  WHERE user_id IN (SELECT DISTINCT user_id FROM `your_project.your_dataset.conversions`)
  GROUP BY user_id
)
SELECT conversion_path, COUNT(user_id) AS number_of_conversions
FROM user_paths
GROUP BY 1
ORDER BY 2 DESC
LIMIT 20;
💡 Optional: For huge datasets, sample users or aggregate by week/month.
Output:
- conversion_path: the ordered sequence of channels a user touched before converting
- number_of_conversions: total number of users who followed that path
BigQuery result snippet:

Interpretation: This table shows the most frequent customer journeys for your brand. For example, the sequence “Facebook Ad -> Email -> Organic Search” means most people saw a Facebook ad first, then opened an email, and finally converted through organic search (from the website). Knowing this information helps you plan campaigns across channels better and figure out which touchpoints should come first.
Conclusion
These advanced SQL queries for marketers do more than just show basic metrics. They help you understand how efficiently you’re spending your marketing budget, which campaigns are actually profitable, how different channels influence business results, and how your typical customer journey looks.
The real game-changer isn’t just writing SQL. It’s having automation in place. By automating data integration with a no-code ELT tool like Windsor.ai that feeds your cross-channel data into BigQuery, you can stop wasting time on routine tasks and completely focus on the analysis and insights that actually fuel business growth.
🚀 Ready to harness the full potential of your marketing data?
Try Windsor.ai free and set up your BigQuery pipeline in minutes!

