 AI insights
 About us
 Careers
 Security
 Customer reviews
 Contact us
 Affiliate program
 Solution partners
 Looker Studio templates
 Tableau templates
 Facebook Ads templates
 Google Ads templates
 Data fields & Metrics
 AI prompt library & Guides
 Product documentation
 API documentation
 Case studies
 Blog
Blog Data models
 Windsor vs Supermetrics
 Windsor vs Fivetran
 Windsor vs Portermetrics
 Last updated: 29 June 2026

Did you know that data-driven companies are 58% more likely to exceed their revenue goals? That’s a major competitive edge, but only if the data powering your analytics is clean, consistent, and integrated.
However, the real challenge is in pulling information from so many different places and then unifying and normalizing it for effective cross-channel analysis. Modern businesses are collecting data from advertising, sales, accounting, analytics platforms, CRMs, etc. Each of these sources uses its own naming conventions, data types, and schema structures.
So, how do you transform all that disparate data into a consistent, analysis-ready format that your target system, whether it’s a BI tool, database, or cloud data warehouse, can process correctly? That’s where data mapping in ELT (Extract, Load, Transform) comes in.
Read on to learn how data mapping works within the ELT framework, explore its core components, and see how Windsor.ai automates the process to ensure speed, accuracy, and reliability in your analytics pipeline.
What is data mapping in ELT?
Simply put, data mapping defines how fields from your data sources correspond to fields in your destination schema. Within an ELT workflow, it ensures that data is correctly structured, normalized, and aligned across all systems, keeping integrity, completeness, and accuracy.
The purpose of data mapping is clear: to ensure all data fields are correctly aligned, eliminate inconsistencies or duplication, and maintain referential integrity. Think of it as a translator that ensures every dataset “speaks the same language.”
Usually mixed up with data transformation, data mapping defines what goes where, while data transformation defines how data changes along the way (e.g., aggregating, converting, or reformatting).
💡 Practical example:
Suppose you want to analyze performance data from Meta Ads, LinkedIn Ads, Google Ads, and GA4 in BigQuery. Each of these sources uses different field names and data types. BigQuery also enforces its own schema and type constraints.
Before loading your data, you must map fields like cost, clicks, impressions, and so on to the corresponding fields and compatible data types in the BigQuery schema. If mapping isn’t done correctly, even a small mismatch, like a metric labeled cost in one source and ad_cost in another, or a numeric field defined as a string, can cause schema conflicts and break your BigQuery tables.
Data mapping methods
There are two main ways to perform data mapping: manual mapping and automated mapping. While both approaches serve the same goal of aligning data fields from multiple sources to a unified schema, they differ significantly in efficiency, scalability, and accuracy.
1. Manual data mapping
Manual data mapping involves defining and matching data fields across all systems by hand.
Here’s how it typically works:
- First, you identify data source(s) from which you want to pull data, and target system(s) where you want to send data to.
- Define the data fields that you want to report on across all these systems.
- Next, you create a detailed map, in a document or spreadsheet, to show how each source field corresponds to a target field (for example, how a certain field is called in Shopify and BigQuery).
- Finally, you test the mapping with a small sample set of data, apply any necessary transformation or cleaning logic, and validate that the data is displayed accurately in the destination.
Although this process can be streamlined with custom scripts, it’s obviously time-consuming, highly prone to error, and hard to handle at scale. It also requires coding knowledge and ongoing maintenance as data sources or schemas evolve.
2. Automated data mapping
The modern approach is automated data mapping using a dedicated ELT platform like Windsor.ai.
Windsor automatically:
- Connects to hundreds of data sources
- Applies normalization and transformation rules under the hood
- Matches schemas between source and destination systems
- Delivers consistent, analysis-ready datasets to your BI tools, databases, or data warehouses
No manual input or programming skills are required.
Windsor.ai connects data from 350+ sources to 20+ destinations, delivering fully normalized datasets in minutes. That means you get consistent metrics and unified schemas ready for analysis in tools like BigQuery, Snowflake, Looker Studio, Power BI, or others with no SQL scripts or data wrangling.
In addition, Windsor detects schema drift when a data source adds, renames, or removes fields and automatically adjusts mappings to keep ELT pipelines stable.
This approach is ideal for complex and scalable data integration needs, and if you require regular updates.
Manual vs. automated data mapping
| Feature | Manual data mapping | Automated data mapping (Windsor.ai) |
| Setup time | Long; requires manual field matching and documentation | Under 5 minutes; Windsor auto-detects and maps fields across all systems |
| Scalability | Difficult to maintain as the number of sources and destinations grows | Scales easily with hundreds of sources and multiple destinations |
| Accuracy | Highly prone to human error and mismatched fields | Maximum accuracy through predefined mapping rules |
| Coding skills required | Yes, requires scripting and SQL knowledge | No, fully no-code process |
| Maintenance | Continuous updates are needed when schemas change | Automatically adapts to source changes |
| Transformation logic | Applied manually via scripts or Excel formulas | Handled automatically under the hood |
| Speed of data delivery | Slow; manual testing and validation are needed | Fast; normalized data is delivered in minutes |
| Best for | Small projects or one-time mappings | Continuous, large-scale ELT pipelines with frequent updates |
Data mapping challenges
Even with the best tools, data mapping can be complex. Here are some common challenges teams face when managing ELT workflows manually or at scale:
- Inconsistent data types across systems
One platform may store “cost” as an integer, while another uses a floating-point number or string. Without type alignment, data can’t load or aggregate correctly.
- Missing or duplicate fields
Some data sources might not provide all required fields, or they may deliver duplicates under slightly different names, leading to confusion and reporting errors.
- Schema drift in source APIs
When a platform updates its API, for example, by renaming or adding fields, existing mappings can break. Automated platforms like Windsor.ai detect and adjust to schema drift automatically.
- Manual documentation errors.
When mapping logic is stored in spreadsheets or code comments, it’s easy for mismatches or omissions to creep in, especially as sources evolve.
👉 Windsor.ai eliminates these challenges by automatically normalizing data, aligning schemas, and adapting to source changes, keeping your ELT workflows accurate and reliable at scale.
Why data mapping matters in ELT
Data mapping is the foundation of reliable analytics as it ensures data consistency and quality across all your platforms.
Here are the main reasons why data mapping matters:
- Streamlining multi-source reports
Data mapping is essential for fast and accurate multi-source reporting. Think about your marketing channels. You run campaigns on Google Ads. You manage leads in HubSpot. You track website behavior in GA4. If the field for “cost” is called ad_spend in one system and total_cost in another, your reports will be inaccurate. Data mapping resolves this conflict. It creates a single, trusted “spend” metric.
- Simplifying the integration of new data sources
Data mapping simplifies schema alignment. Imagine integrating a new data source, for example, a customer support system like Zendesk. Automated data mapping quickly aligns Zendesk’s unique fields, such as “ticket_ID” or “resolution_time,” and maps them with your existing target structure. This saves your data team days of manual coding and testing.
- Enforcing data governance
Data mapping is also crucial for robust data governance, for example, by helping you enforce compliance rules. You can define which source fields contain PII (Personally Identifiable Information). Do this right at the mapping stage. You can then apply strict security protocols to those specific fields in your warehouse.
- Powering smart decisions
Effective data mapping supports better data-driven decisions. You move from fragmented, siloed reports to a unified business performance view.
Key components of data mapping
Here is a quick breakdown of what makes up a complete data map:
| Component | Definition | Example |
| Source fields | Data fields from the source system (e.g., Ads, CRM) | campaign_id from Google Ads |
| Target fields | Destination schema fields | marketing_campaign_id in BigQuery |
| Transformation rules | Define conversions or cleaning logic | Convert currency or standardize date format |
| Mapping logic | Relationship between source and target fields | lead_id → customer\_id |
| Validation layer | Ensures mapped data is accurate and complete | Check for null or invalid IDs |
How Windsor.ai automates data mapping
Windsor.ai fully automates two underlying processes of data mapping: cross-source mapping (data blending) and source-to-destination mapping.
1. Cross-source mapping (data blending)
Windsor.ai doesn’t just extract data from source systems; it normalizes it.
Behind the scenes, Windsor maintains a standardized internal schema that defines a single, consistent field for each common metric or dimension (such as spend, clicks, impressions, campaign_id, date, etc.) across all supported platforms.
When you connect multiple sources, Windsor automatically maps each platform’s native API fields into this unified schema. This ensures a consistent naming convention, data type, and structure across all connected platforms, making cross-channel analysis seamless.
💡 Example: the “spend” field
| Platform | Original API field | Windsor’s unified field | Type |
| Google Ads | cost | spend | NUMERIC |
| Facebook Ads | amount_spent | spend | NUMERIC |
| Bing Ads | spend | spend | NUMERIC |
You can view this unified field structure in Windsor’s Blended Data Connector Field Reference. This cross-source mapping happens automatically when you connect more than one data source; no manual configuration or field matching is required.
2. Source-to-destination mapping
When you connect different data sources and load data to a destination, Windsor effectively handles the transfer by aligning the previously normalized fields to the destination table.
Windsor.ai automates this process through schema detection and alignment:
- Table creation: If a table doesn’t exist in your destination (BigQuery, Snowflake, etc.), Windsor creates it automatically with the selected fields, ensuring a matching schema.
- Schema alignment: If the table already exists, Windsor aligns only the matching fields, loads data into those columns, and skips mismatched ones. This ensures schema consistency and ELT pipeline reliability.
That’s how Windsor removes the need to manually define column names and types for each source and destination combination.
Data mapping process flow in Windsor
Windsor.ai’s data mapping process is designed to be fast, accurate, and easy. This lets you focus on analysis, not data preparation.
1) Connect your data source(s)
First, you choose a source platform from our extensive list. Windsor supports over 350+ tools (Google Ads, HubSpot, Facebook Ads, Salesforce, etc.) and automatically detects available fields and schemas for you.

2) Select reporting fields (cross-source mapping)
Based on your reporting needs, select the relevant metrics and dimensions, and preview your data right in the windsor dashboard.

In case you connected multiple sources, Windsor instantly performs cross-source mapping by mapping all native source fields (e.g., cost, spend, amount_spent) to our unified internal field schema (e.g., spend). This standardizes names, formats, and data types for unified metrics.
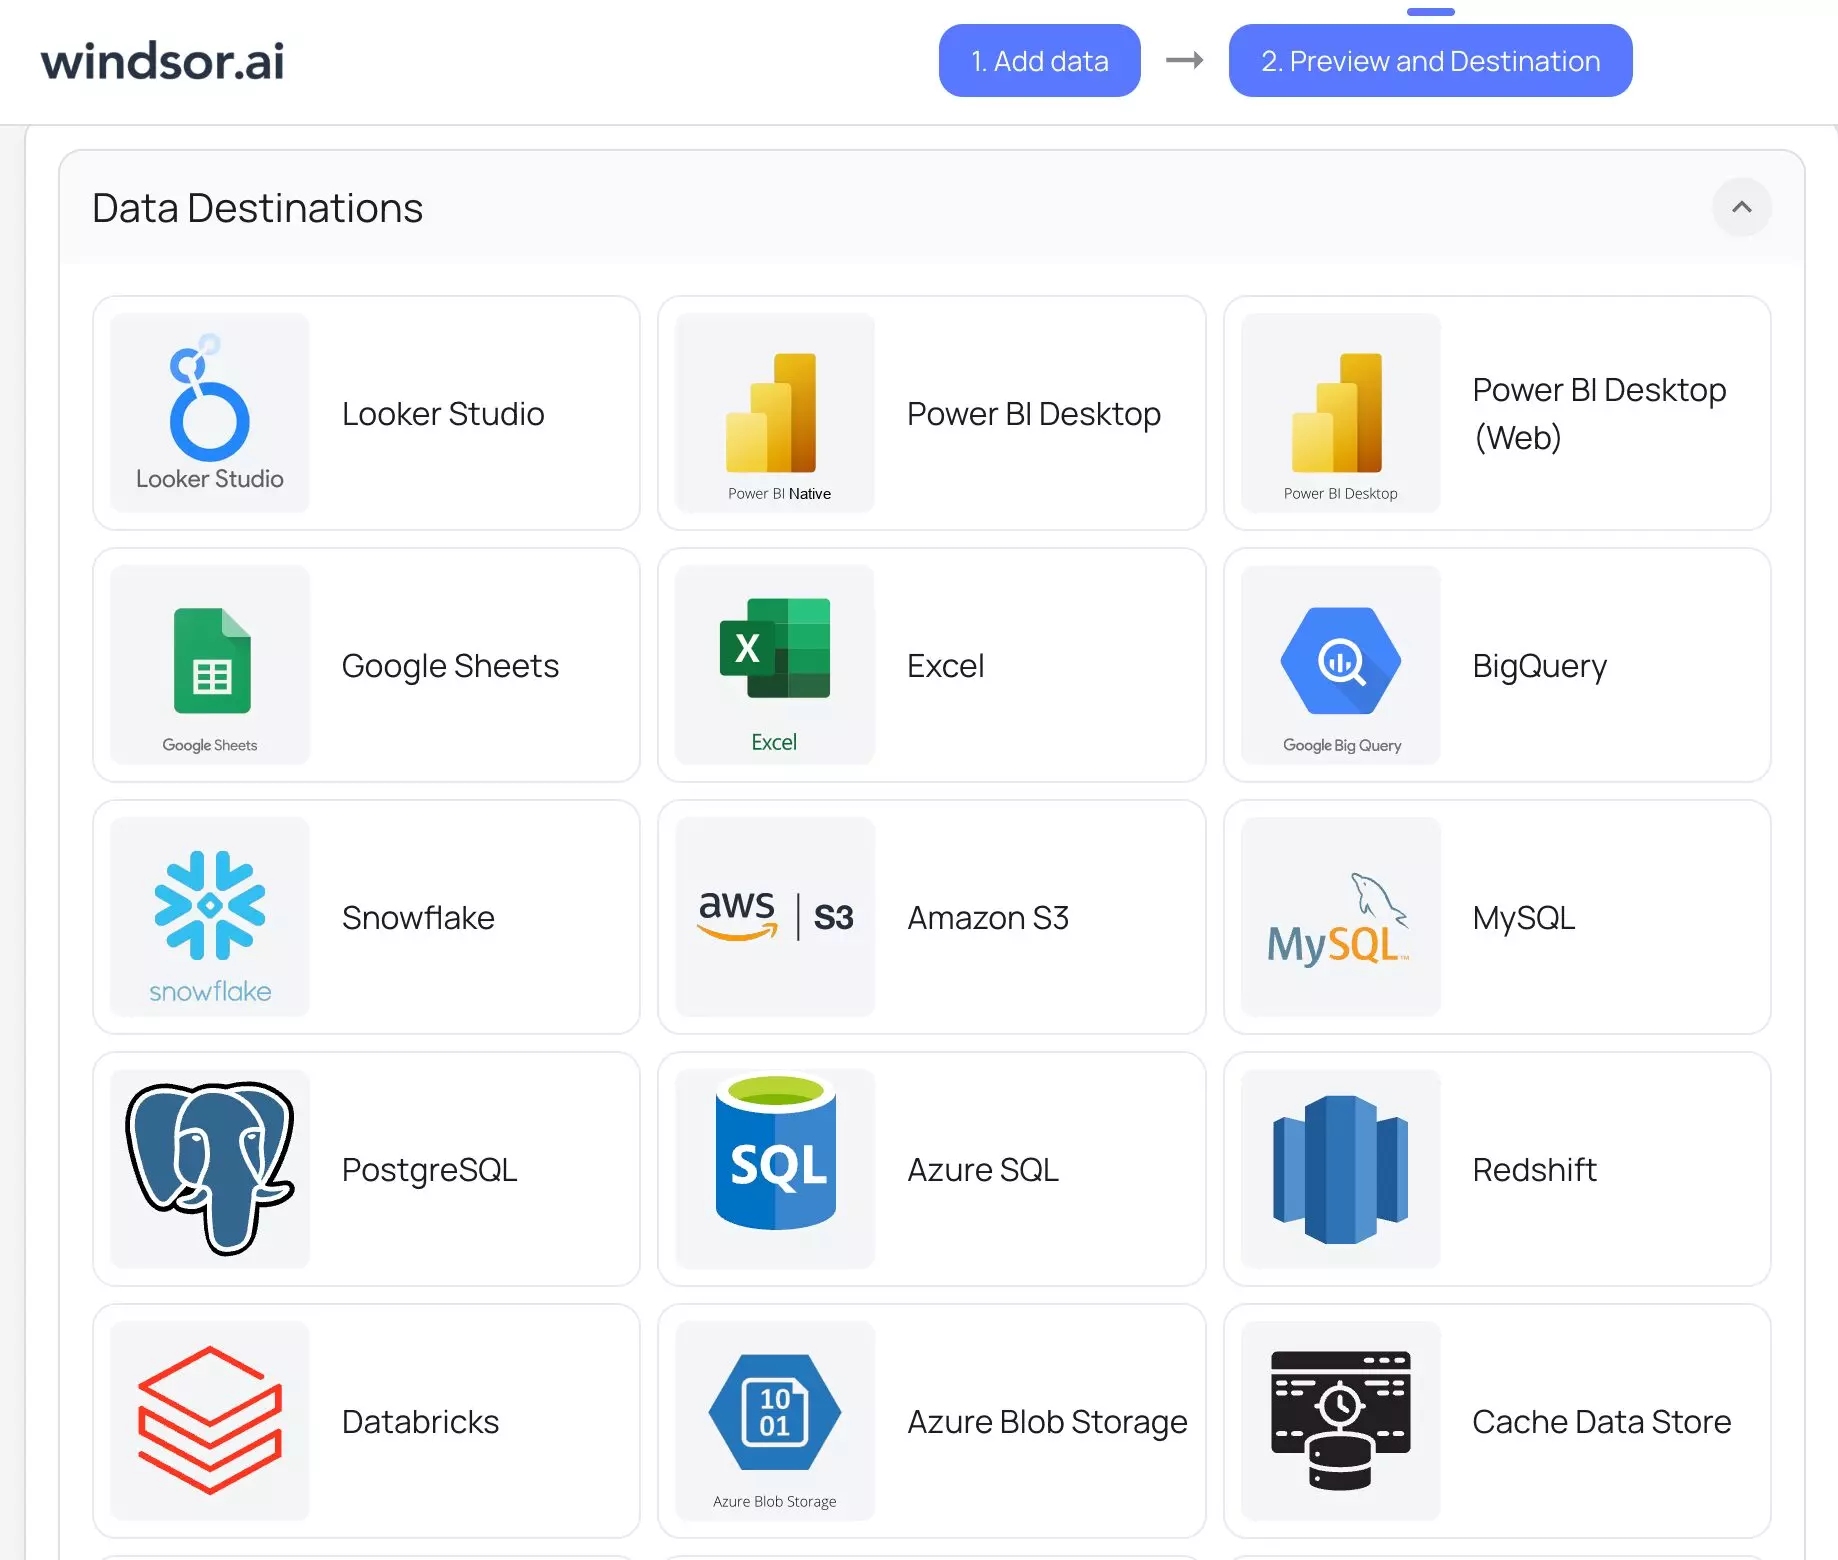
3) Choose your destination (source-to-destination mapping)
Select where you want to send your data (Looker Studio, Power BI, BigQuery, Snowflake, Google Sheets, etc.) and follow the integration instructions. Windsor.ai automatically performs source-to-destination mapping by aligning the schema of the extracted data with your destination.
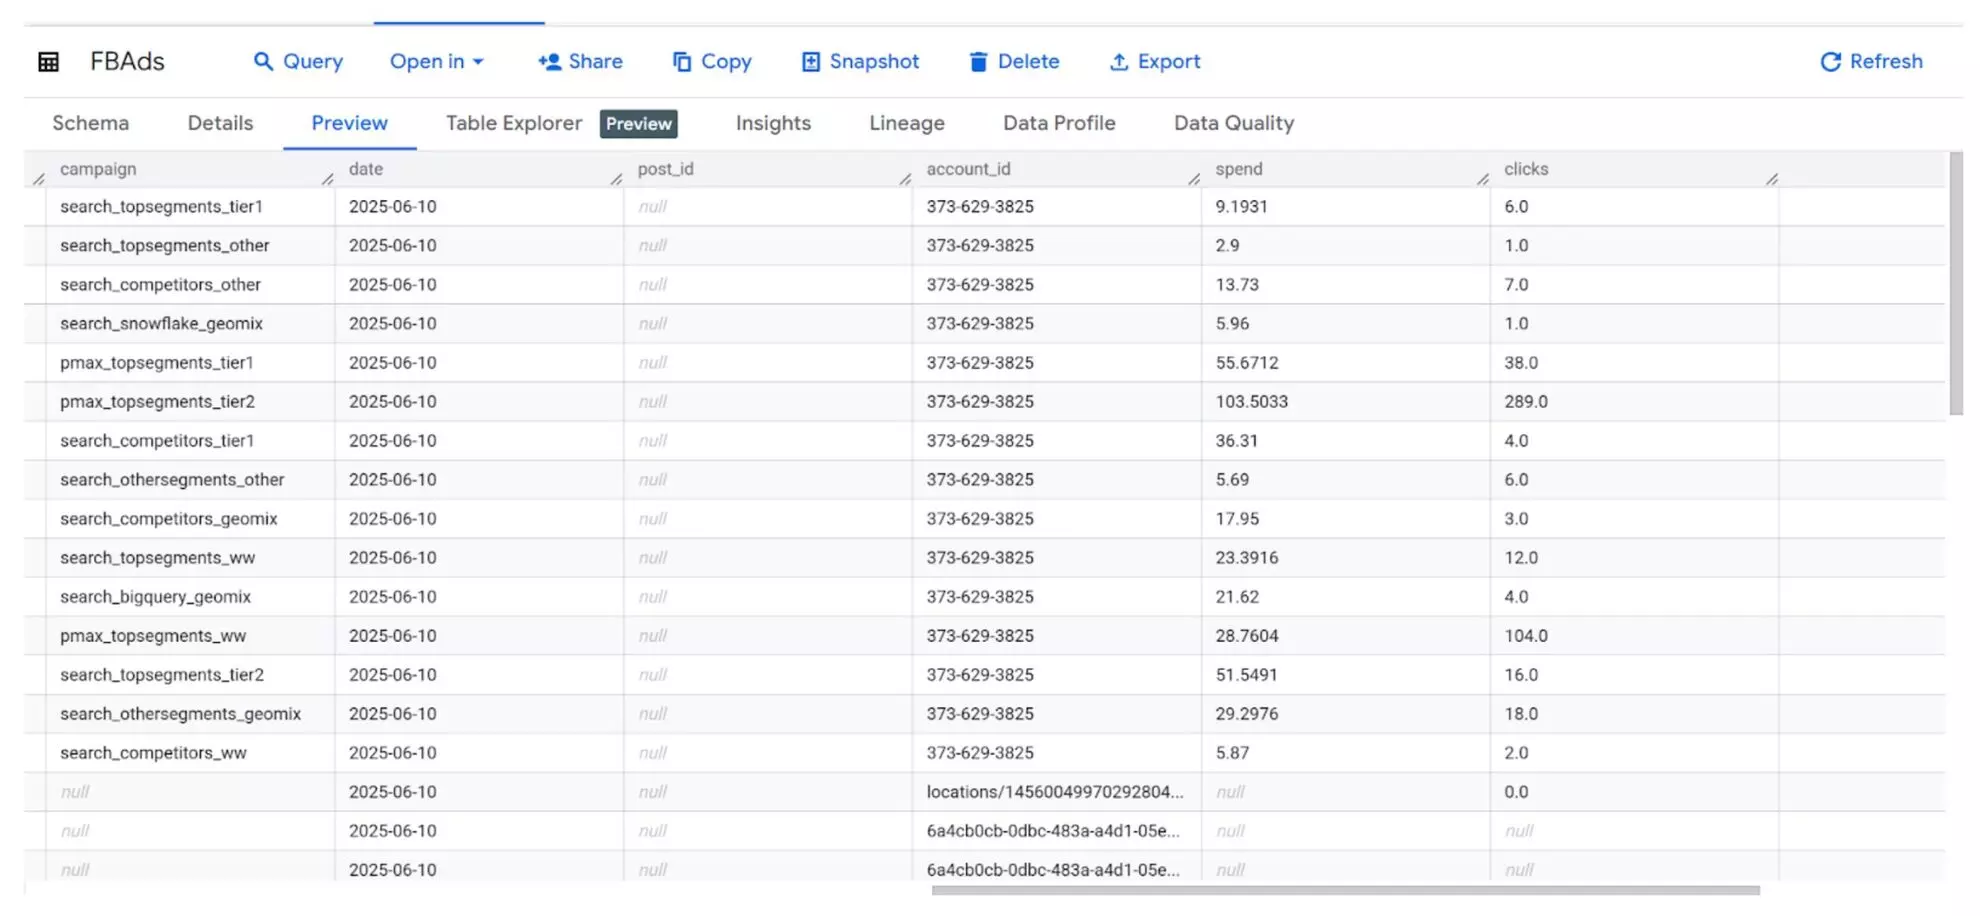
4) View your data in the destination
Now you can view your integrated data directly in the connected destination, be it a Looker Studio dashboard or BigQuery table, ready for further reporting and analysis.
Bonus: data mapping best practices
Here are a few simple best practices for data mapping ELT processes that will help you achieve maximum accuracy of your reports:
- Consistency is key. Therefore, keep field naming consistent across all your source systems. Use clear, descriptive names so that the data is understandable for everyone.
- Document the mapping logic for full transparency. Keep a detailed log of every connection and transformation rule. This documentation is essential for auditing and debugging later.
- Regularly review and update mappings as your data evolves. Your business changes constantly. You launch new campaigns, new products, or new platforms. Make the review process a regular task to avoid gaps that can break your ELT pipelines.
- Always perform validation to catch inconsistencies early. Validation checks help identify missing fields, wrong data types, or duplicate entries. This saves you from running inaccurate reports.
- Automate the entire data mapping process with Windsor.ai. Windsor.ai automatically maps and normalizes data from 350+ sources into a unified schema, ensuring consistent fields and data types across platforms and target systems. This eliminates manual work, prevents mapping errors, and keeps your ELT pipeline accurate and up to date.
Conclusion
Data mapping is the backbone of effective ELT workflows, transforming chaotic raw information into structured, analysis-ready datasets.
With Windsor.ai, you can fully automate this crucial process, removing the need for manual, error-prone mapping steps. This powerful automation dramatically reduces data errors and speeds up your time-to-insight. Ultimately, you can easily create a single source of truth for all your marketing and business data for smart decision-making.
🚀 Ready to simplify data mapping?
Automate your ELT workflows with Windsor.ai’s no-code data integration platform. Start for Free with a 30-day trial or Book a Demo.
FAQs
What is data mapping in ELT?
Data mapping is the process of defining connections between data fields from a source system and their corresponding fields in a target system. Data mapping acts as a translator, ensuring that separated data points flow correctly and consistently between different applications, databases, or cloud warehouses during a data integration task.
What are some common data mapping examples?
Common data mapping examples include standardizing campaign identifiers across different ad platforms; for instance, linking “Campaign ID” from Google Ads to a unified “marketing_campaign_id” in BigQuery. Another example is connecting lead IDs from a CRM like HubSpot with associated session IDs from web analytics tools to create a complete customer attribution picture.
Do I need coding skills to use Windsor.ai for data mapping?
No, you do not need coding skills to use Windsor.ai for data mapping. Our platform has a completely no-code interface with built-in field mapping tools. The system uses AI-powered features to automatically suggest and implement field matching and validation, making the entire ELT setup accessible to marketing and business users.
What are the benefits of data mapping?
Data mapping offers numerous benefits, including enabling unified reporting that consolidates performance across all business channels. It drives faster analysis, allows for precise tracking of campaign ROI, and significantly reduces the manual, time-consuming effort of preparing data for reporting, freeing up time for strategic work.
What is schema drift in ELT?
Schema drift refers to unexpected changes in the structure of your source data, such as when a new column is added, an existing one is renamed, or a field’s data type changes. These modifications often occur when platforms update their APIs or when new data points are introduced.
If your ELT system isn’t equipped to handle schema drift, these changes can break your pipelines, cause loading errors, or lead to missing data in reports.
Windsor.ai automatically detects and adjusts to schema drift. When a source schema changes, Windsor aligns the new or modified fields with its internal unified schema, keeping your data mapping and pipelines stable without manual intervention.

