 AI insights
 About us
 Careers
 Security
 Customer reviews
 Contact us
 Affiliate program
 Solution partners
 Looker Studio templates
 Tableau templates
 Facebook Ads templates
 Google Ads templates
 Data fields & Metrics
 AI prompt library & Guides
 Product documentation
 API documentation
 Case studies
 Blog
Blog Data models
 Windsor vs Supermetrics
 Windsor vs Fivetran
 Windsor vs Portermetrics
 Last updated: 28 October 2025
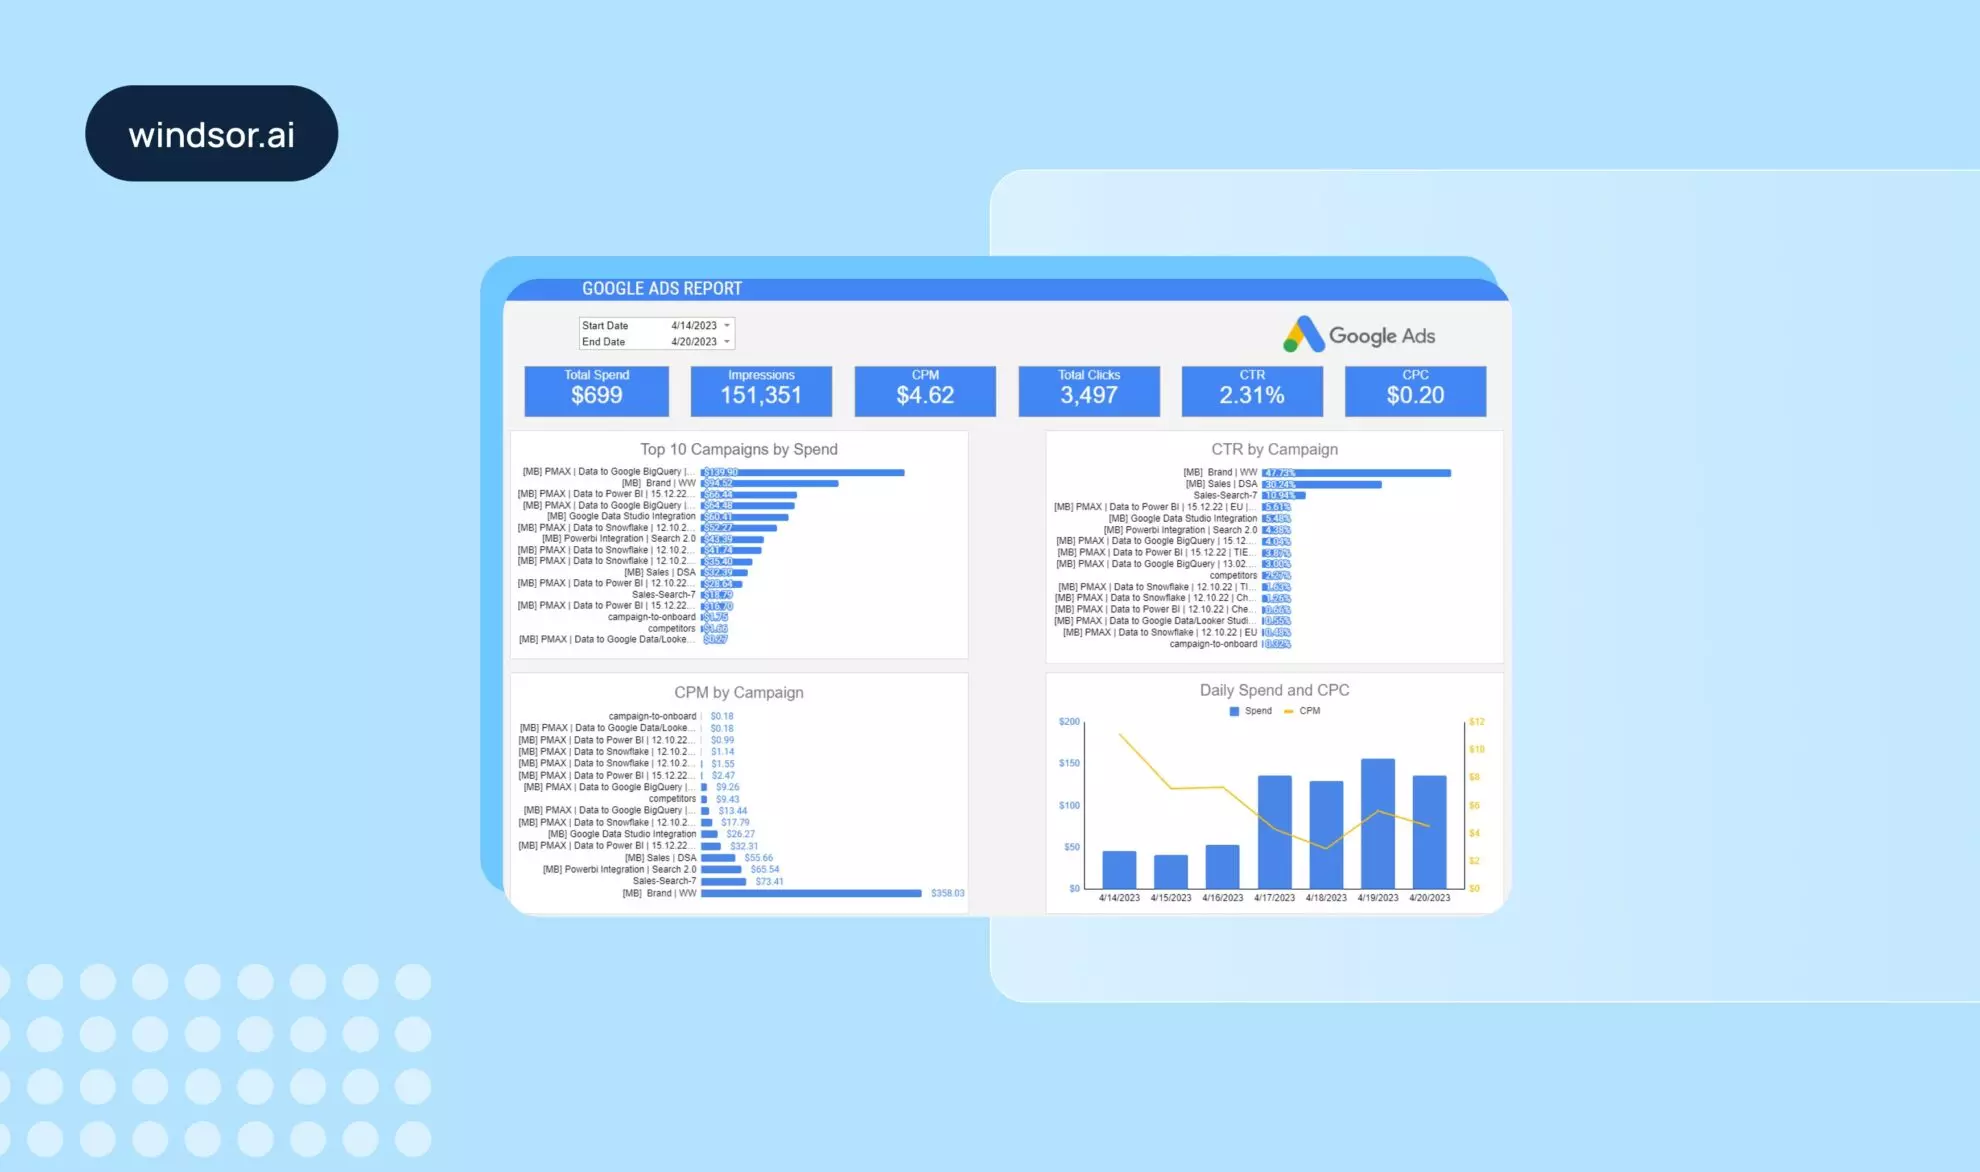

Tracking marketing KPIs shouldn’t mean endless data exports, copy-pasting, or late-night reporting sessions.
With Google Sheets, you can create a real-time, automated KPI dashboard that brings all your marketing metrics together in one place. And when you connect data from multiple sources with Windsor.ai, the entire process becomes fully automated: no scripts, no manual updates, no technical headaches.
In this guide, I‘ll show you how to set up an automated KPI dashboard in Google Sheets that updates in near real-time or at scheduled syncs, integrates all your cross-channel data, and requires zero manual maintenance.
Why track and automate marketing KPIs in Google Sheets
Google Sheets is one of the most flexible and collaborative tools for marketing reporting. It allows you to visualize metrics, calculate KPIs, and share dashboards instantly with your team and clients.
However, when you update spreadsheets manually, your reports can quickly become inconsistent, outdated, and prone to error.
Windsor.ai eliminates these issues by fully automating Google Sheets KPI dashboards and delivers these benefits:
- Blend data from multiple platforms like Google Ads, Facebook Ads, LinkedIn, GA4, HubSpot, etc.
- Keep your metrics always fresh with automated dashboard refreshes at scheduled intervals.
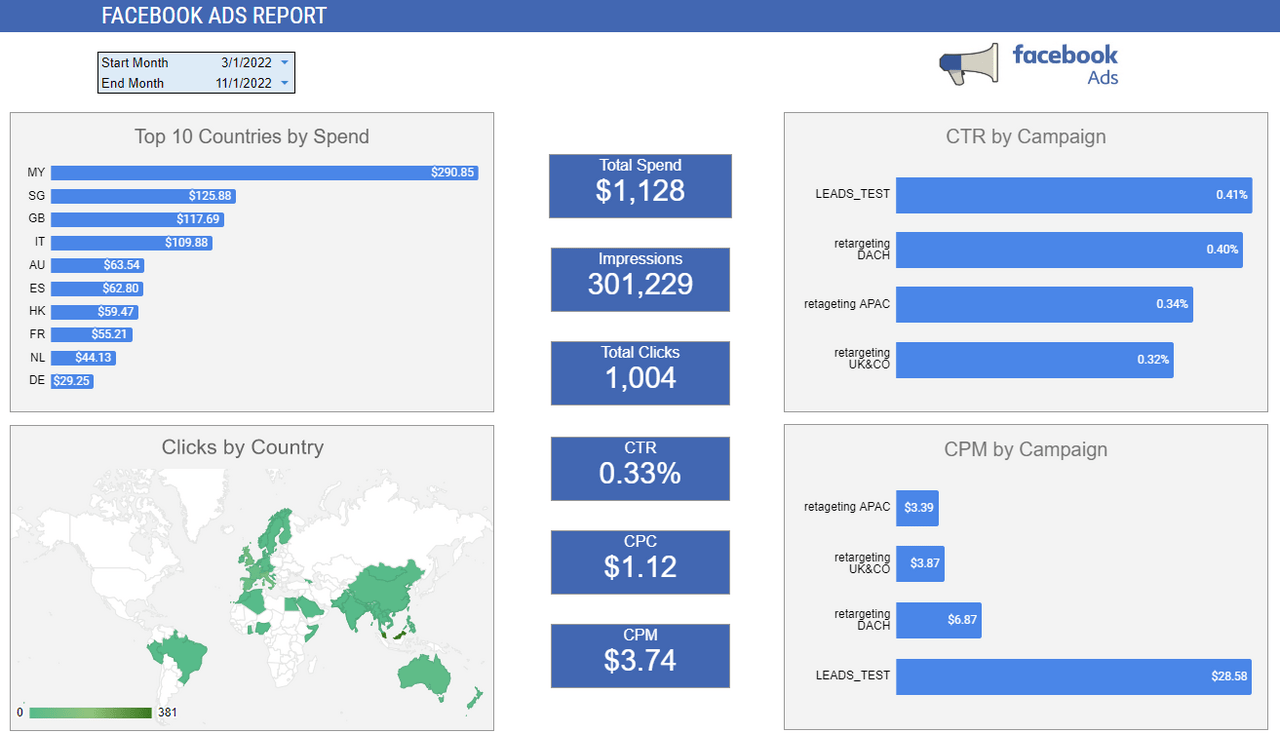
- Leverage pre-built Google Sheets marketing reporting templates for an instant start and comprehensive performance overview.
- Standardize KPIs like spend, clicks, impressions, and conversions across all your channels.
- Manage your reporting scale by adding or removing data sources anytime as your marketing stack grows.
- Enable real-time decision-making with always up-to-date, reliable reporting.
By automating KPI tracking in Google Sheets with Windsor.ai, you eliminate the manual work, reduce reporting errors, and gain more time to focus on insights, optimization, and growth instead of data wrangling and maintenance.
Why cross-channel KPI tracking matters
Most marketers today manage campaigns and track results across multiple platforms, from paid search and social to analytics and CRM tools. Without automation, extracting and consolidating this data for cross-channel performance analysis is really time-consuming and error-prone.
With cross-channel KPI tracking in Google Sheets powered by Windsor.ai, you can:
- Compare ROI, CPA, and other essential metrics across channels (e.g., Google Ads + Meta + HubSpot).
- Identify high-performing channels where your ad spend drives the best results.
- View and compare metrics across multiple data sources side-by-side in one dashboard.
- Eliminate data discrepancies caused by manual uploads or copy-paste reporting.
Ultimately, automating cross-channel KPI tracking in Google Sheets helps you visualize and analyze your entire marketing funnel, enabling faster insights and smarter, data-driven decisions.
How Windsor.ai powers Google Sheets dashboard automation
Windsor.ai acts as the data ingestion and automation layer that connects all your advertising and analytics platforms directly to Google Sheets, eliminating manual work and ensuring real-time accuracy.
Here’s how it works under the hood:
- Connect 325+ data sources: including Google Ads, Facebook Ads, LinkedIn, GA4, and more.
- Blend & standardize data: unify spend, impressions, clicks, conversions, and thousands of other metrics that matter into a consistent schema using Windsor’s automated data mapping.
- Stream data to Google Sheets automatically: skip manual uploads, file imports, or complex API handling.
- Schedule auto-refreshes: keep your dashboards continuously updated by setting custom sync intervals.
All these Windsor’s features allow you to build a solid real-time KPI dashboard in Google Sheets, constantly synchronized with your live campaigns and ready for instant analysis.
How to build an automated cross-channel KPI dashboard in Google Sheets using Windsor
Step 1: Connect your marketing data sources
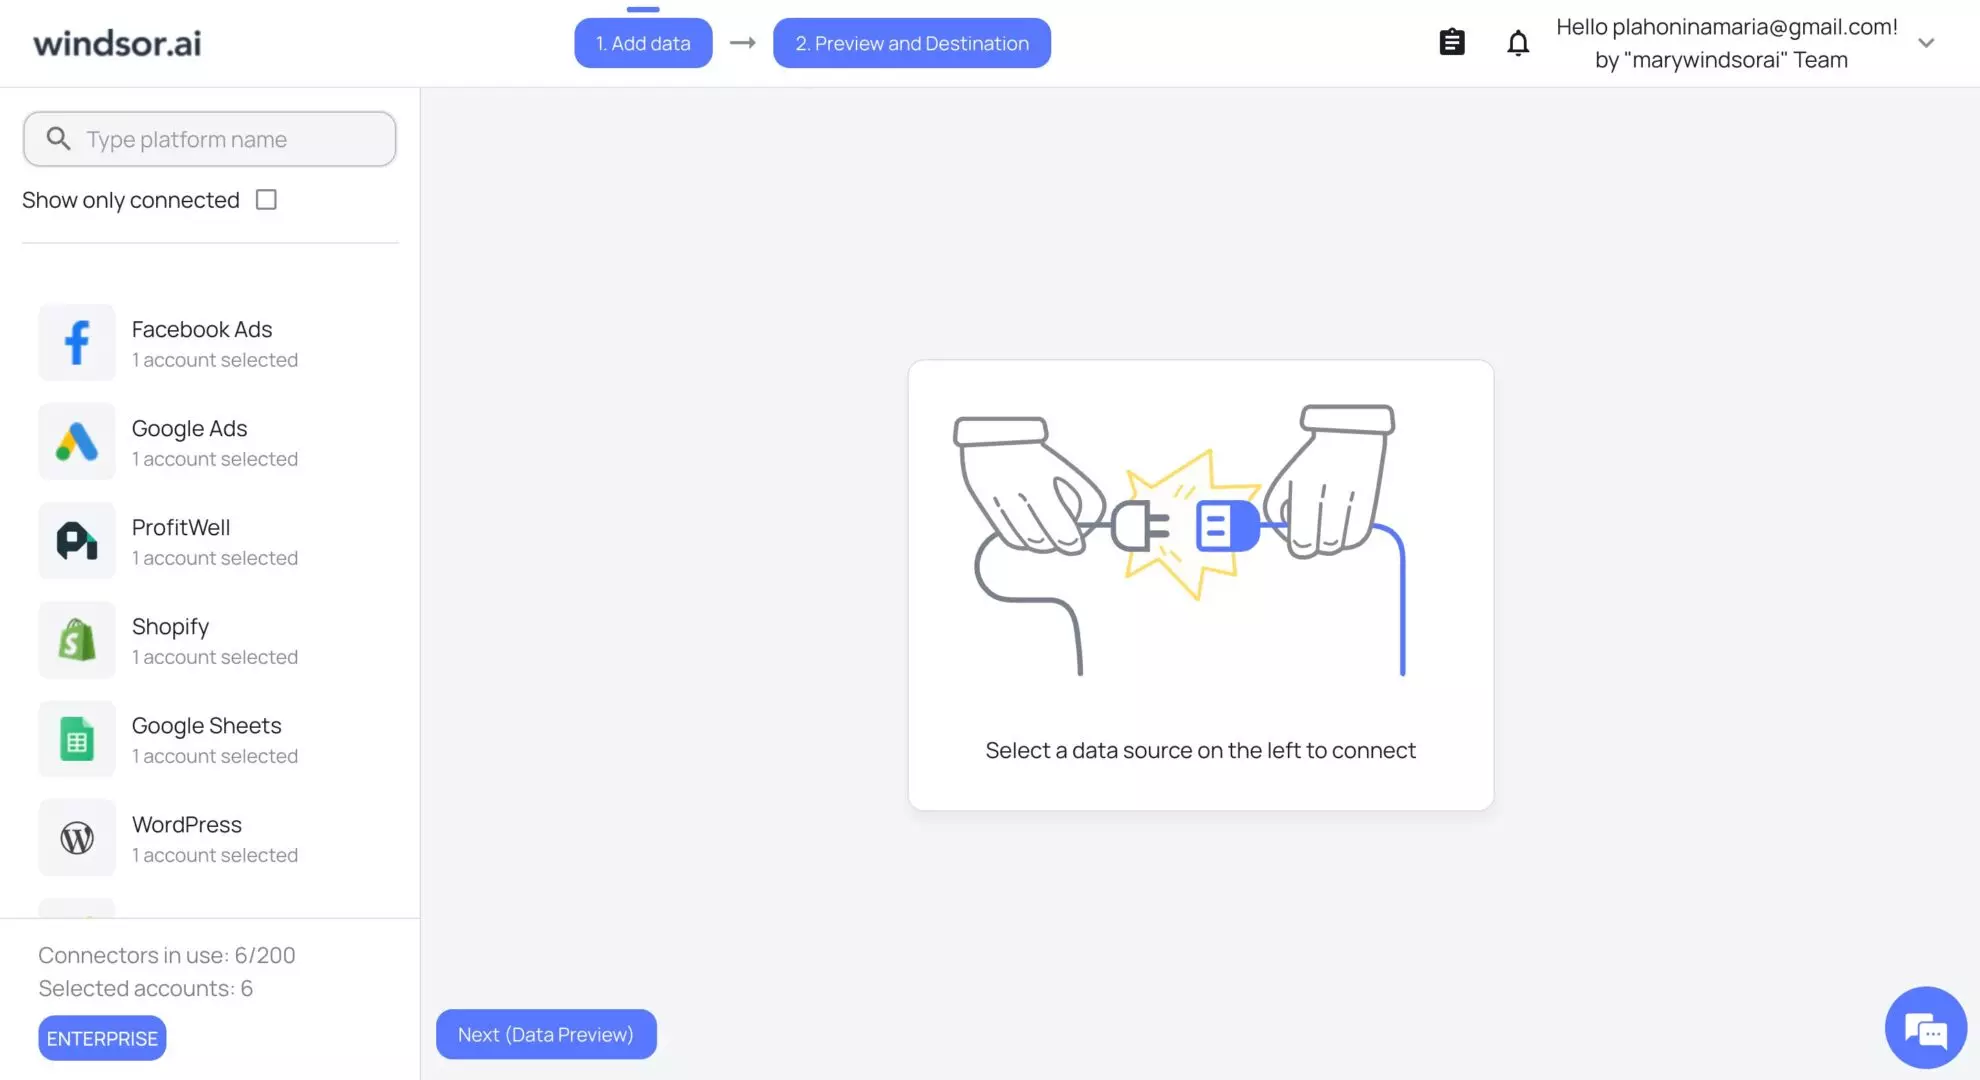
1. Log in to your Windsor.ai account or register if you don’t have one.
2. In the Data Sources section, select and connect your marketing accounts:
- Google Ads
- Facebook (Meta) Ads
- LinkedIn Ads
- Google Analytics 4
- etc.
Step 2: Build your query
On the Preview and Destination page, refine your query by selecting and filtering the data you need:
1. Select time period: Choose the reporting window (last 7 days, last 30 days, this month, or custom).
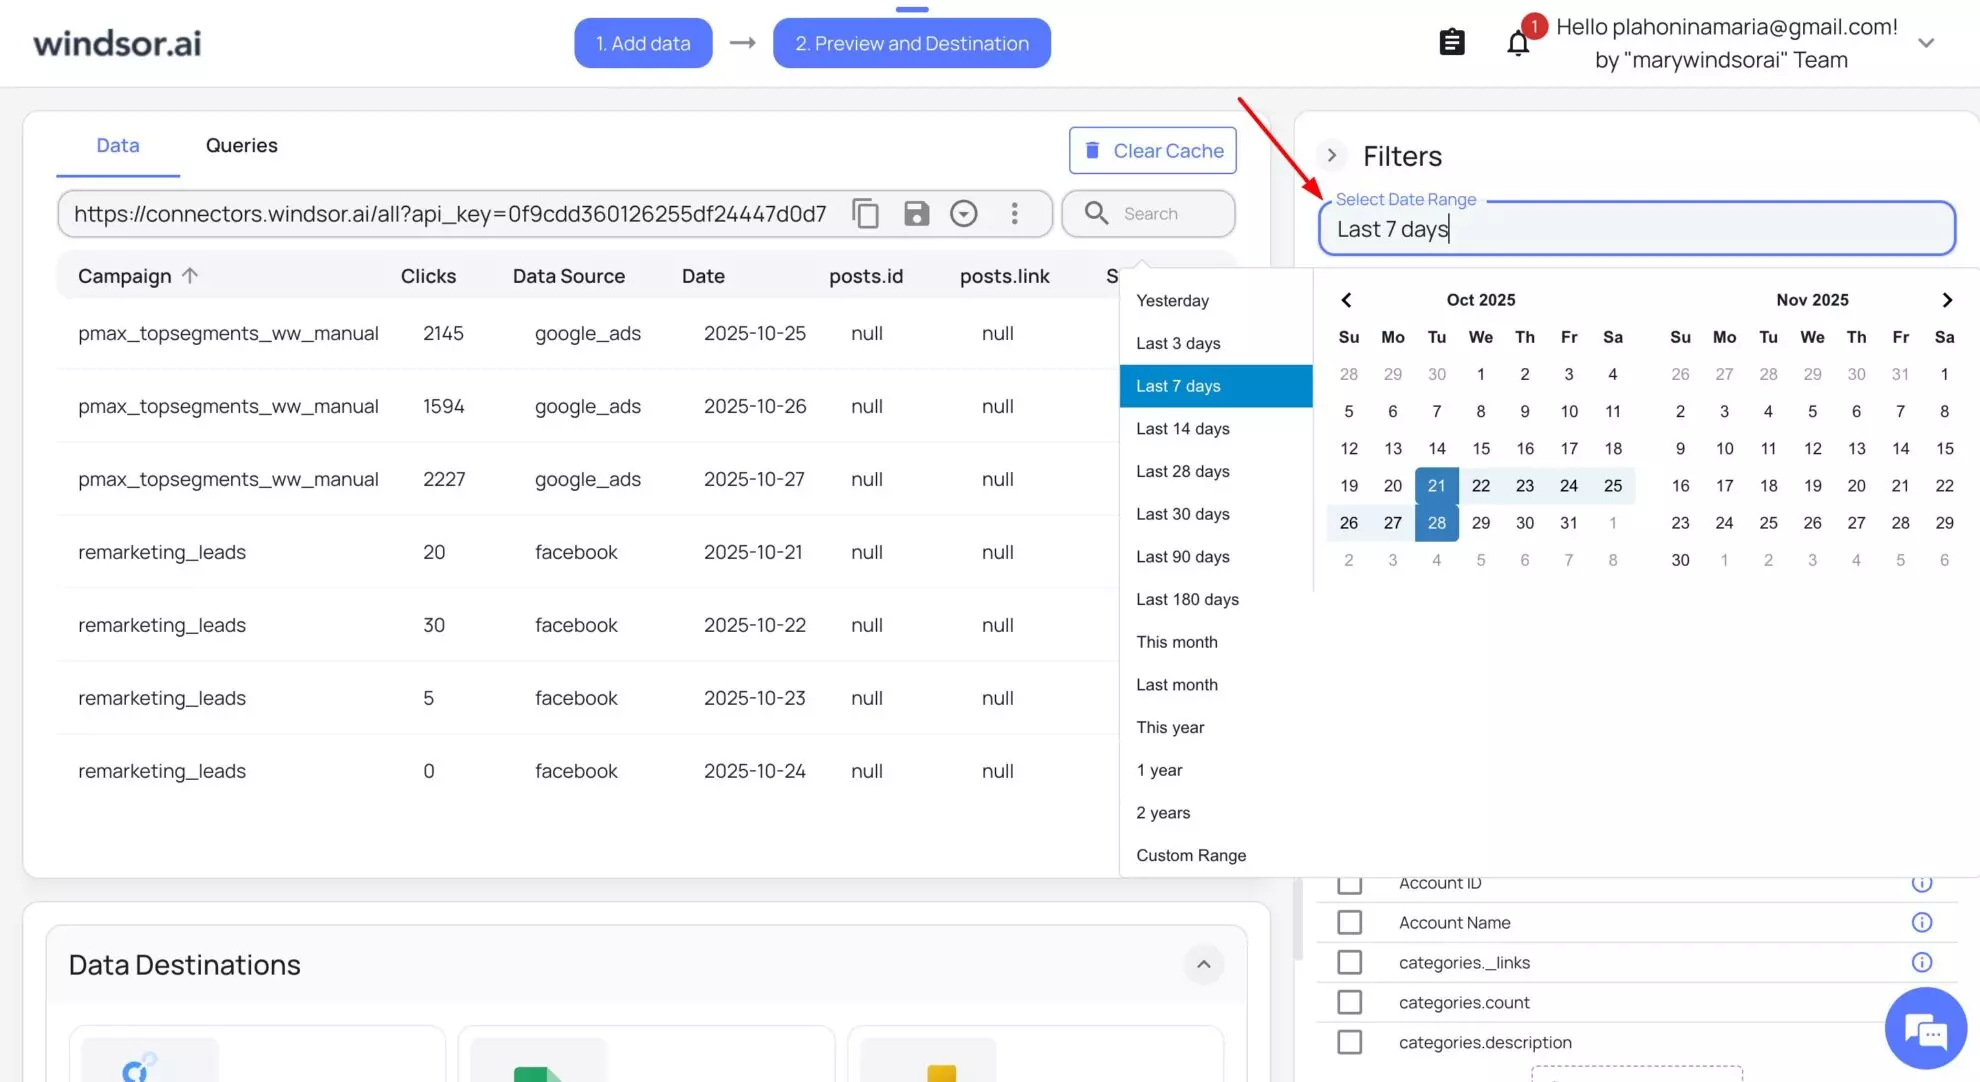
2. Select data source: From the “Select Data source” field, select a specific platform or all for cross-channel analysis.
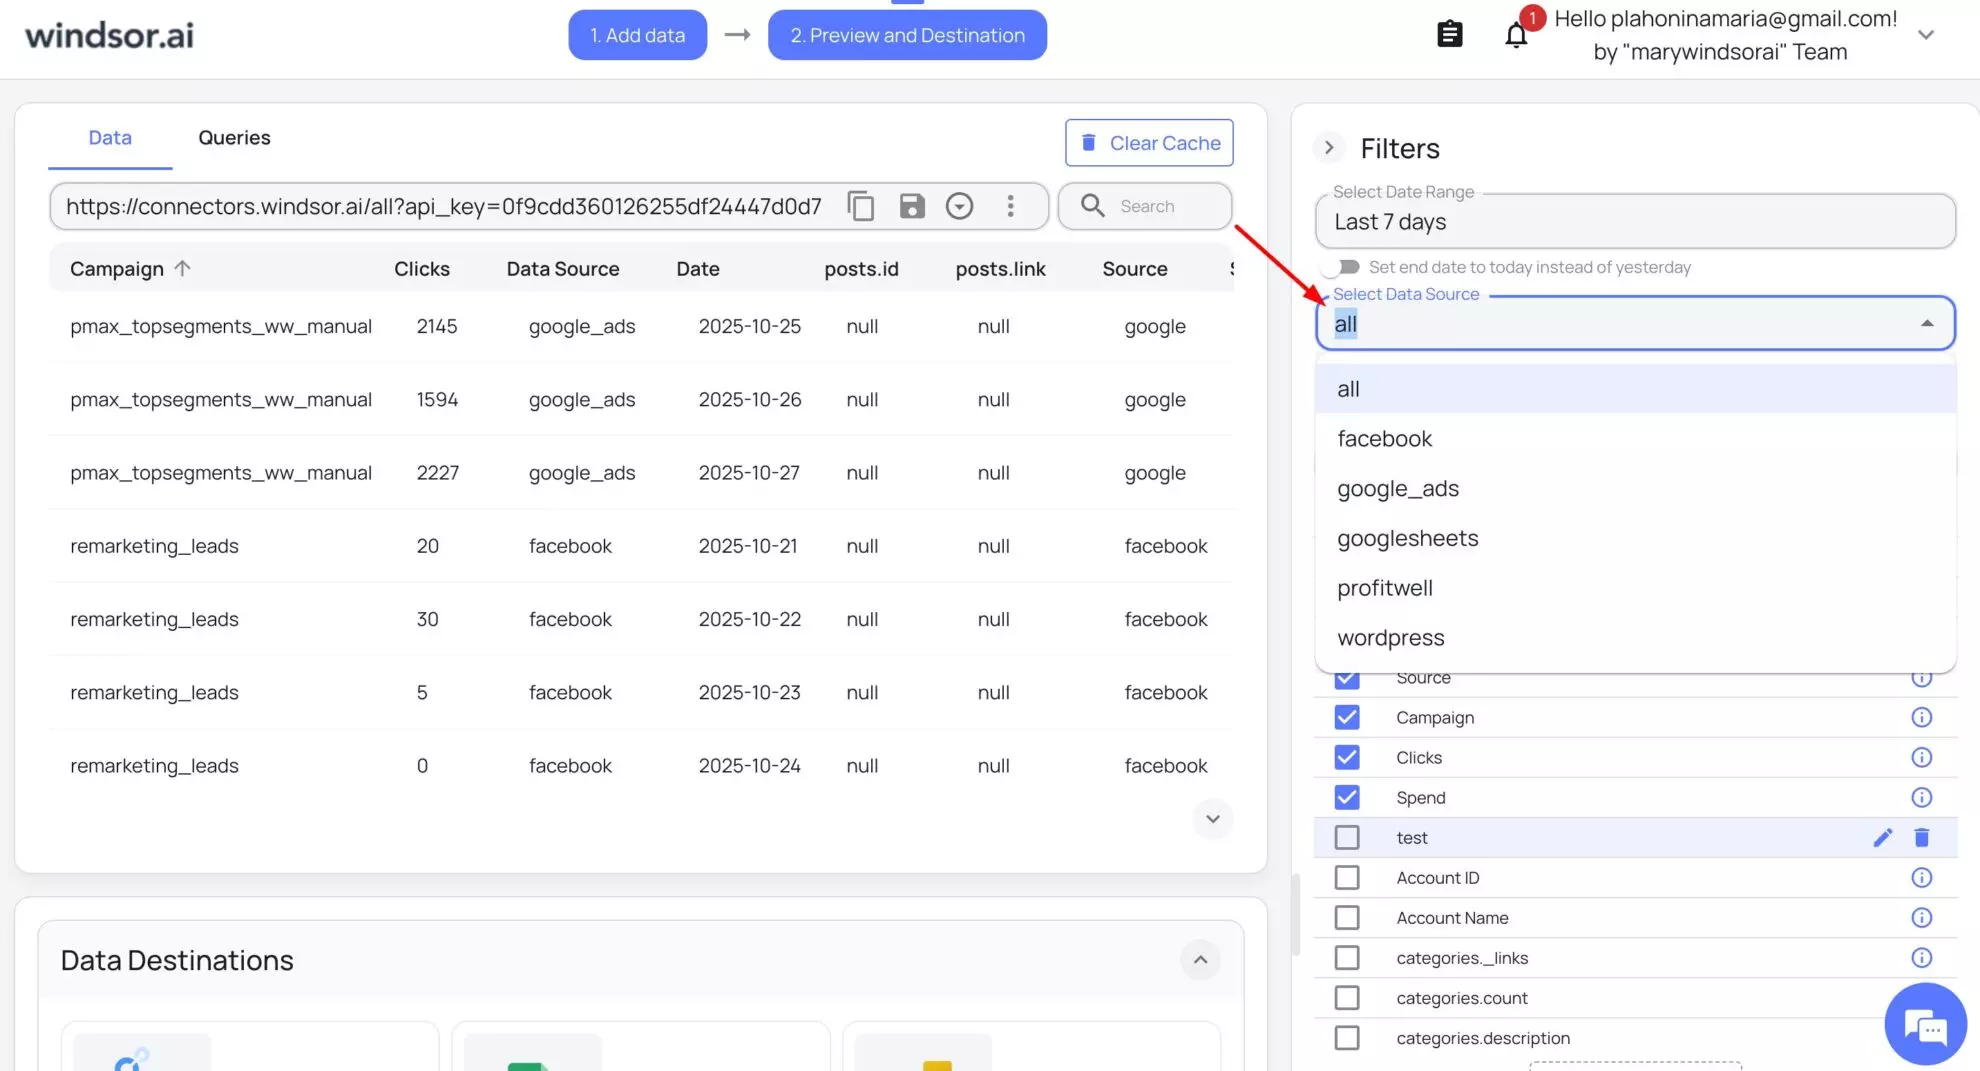
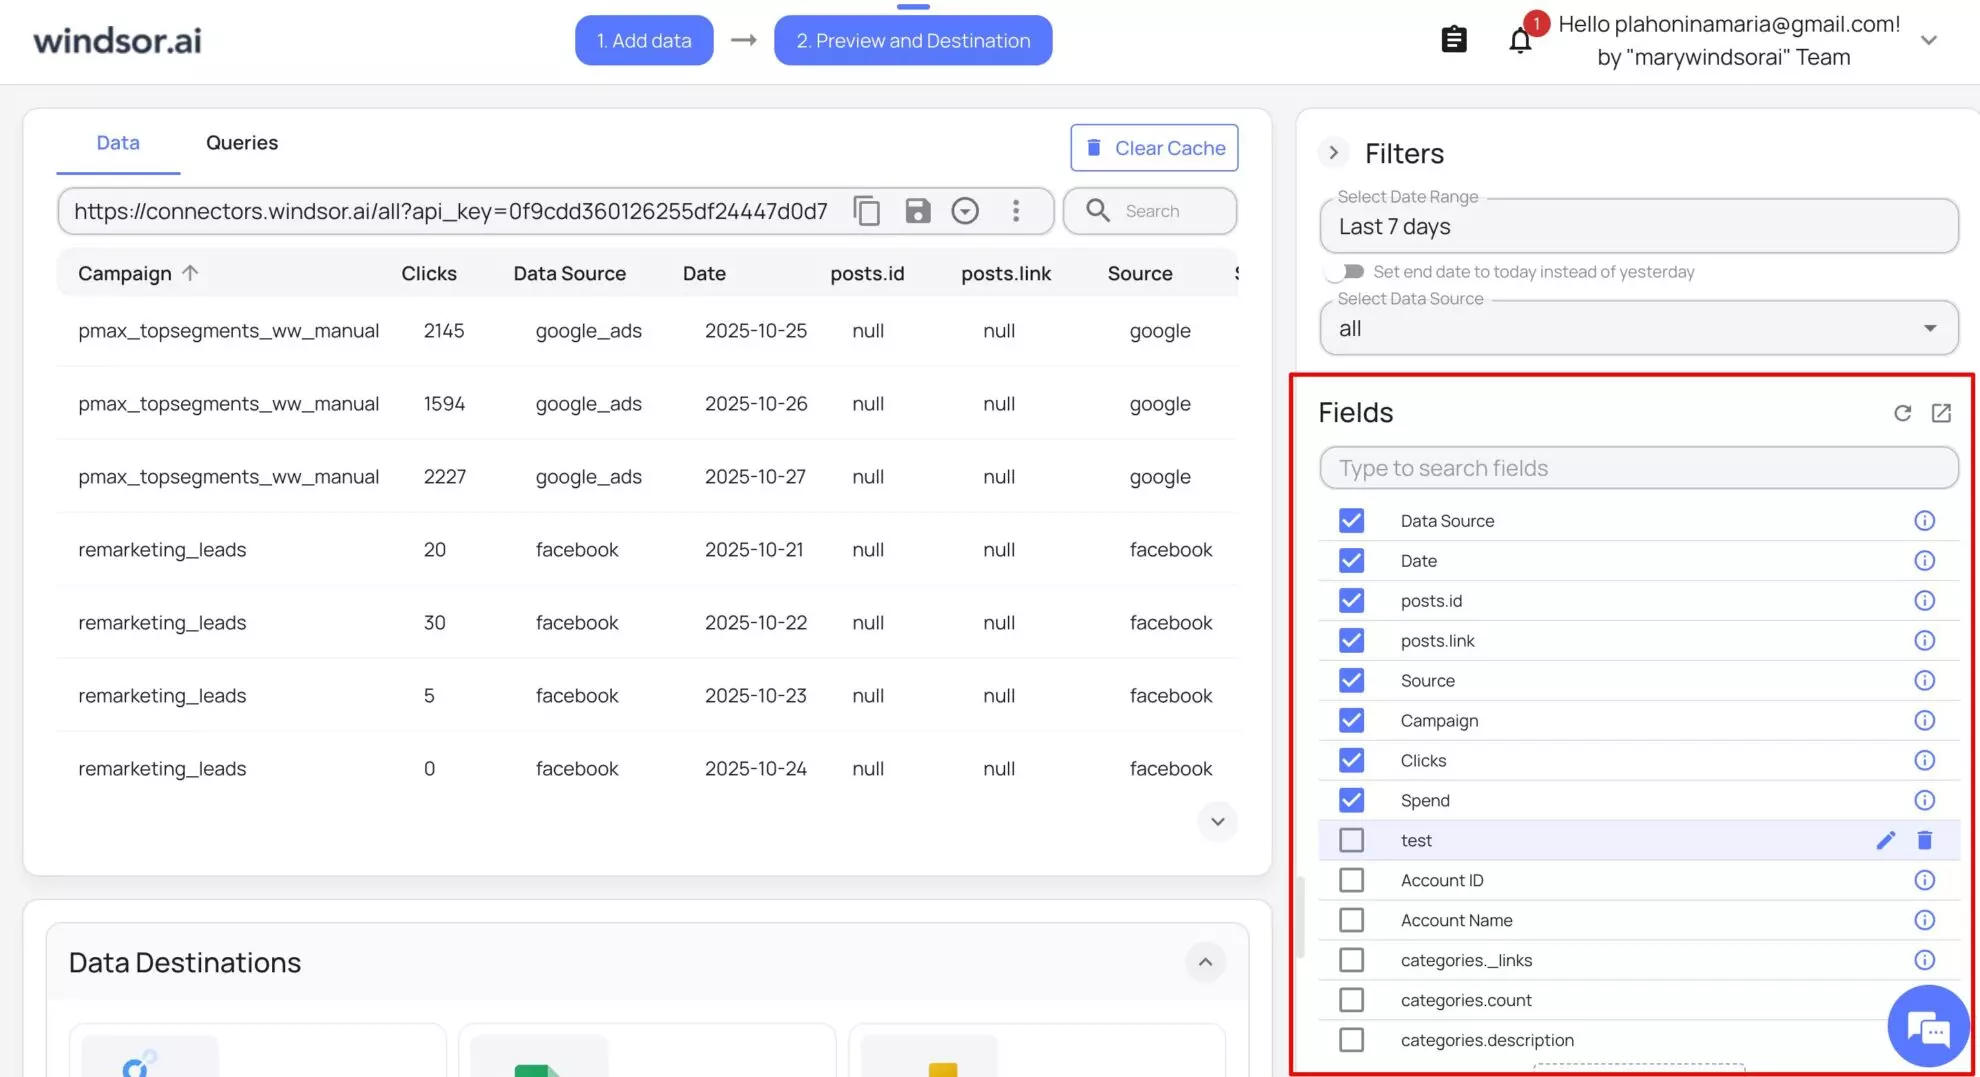
3. Choose fields: Choose your desired fields ( date, source, campaign, medium, spend, clicks, impressions, conversions, revenue, and so on).
4. Advanced filters & options: Further refine your dataset or exclude unwanted records.
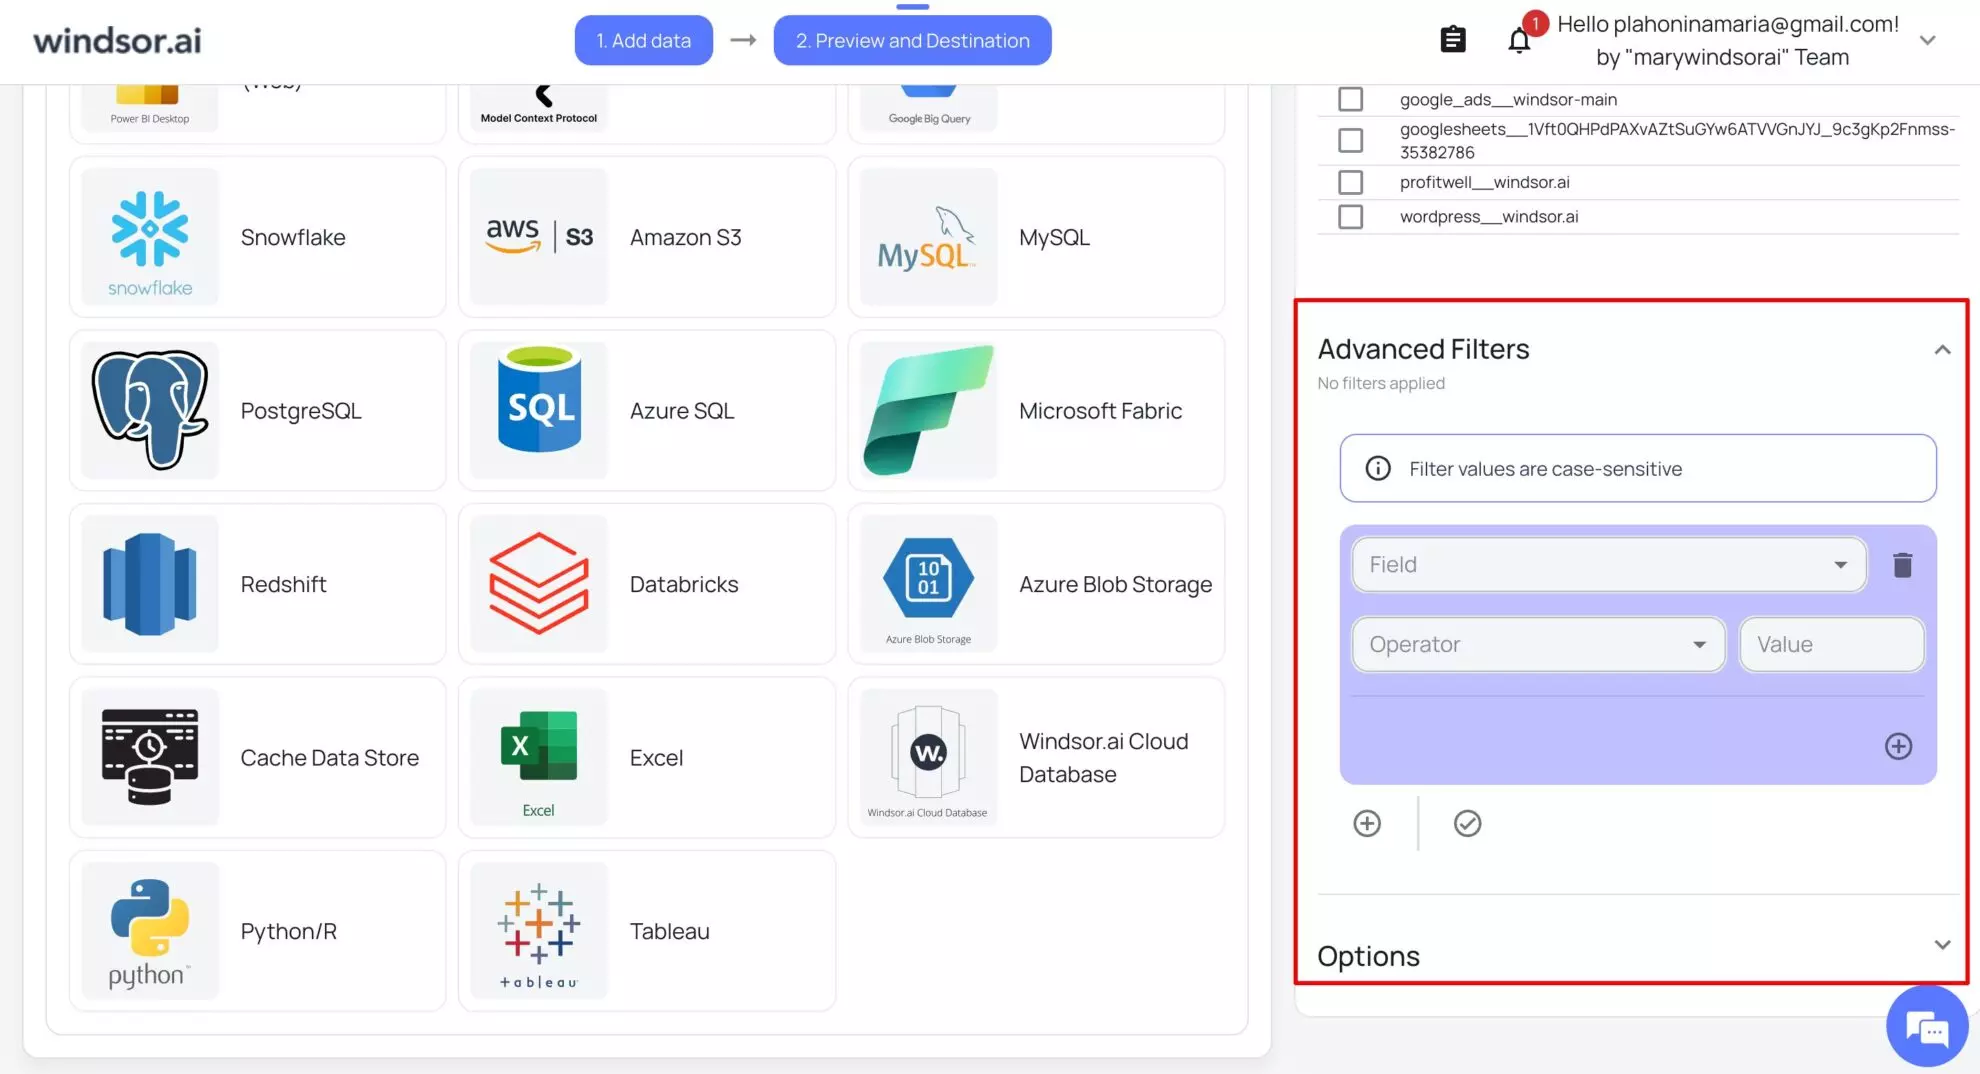
You now have a unified, blended dataset ready for export. It’s the backbone of your automated marketing KPI reporting in Google Sheets.
Step 3: Connect Google Sheets as your destination
1. In the Data Destinations section, select Google Sheets.
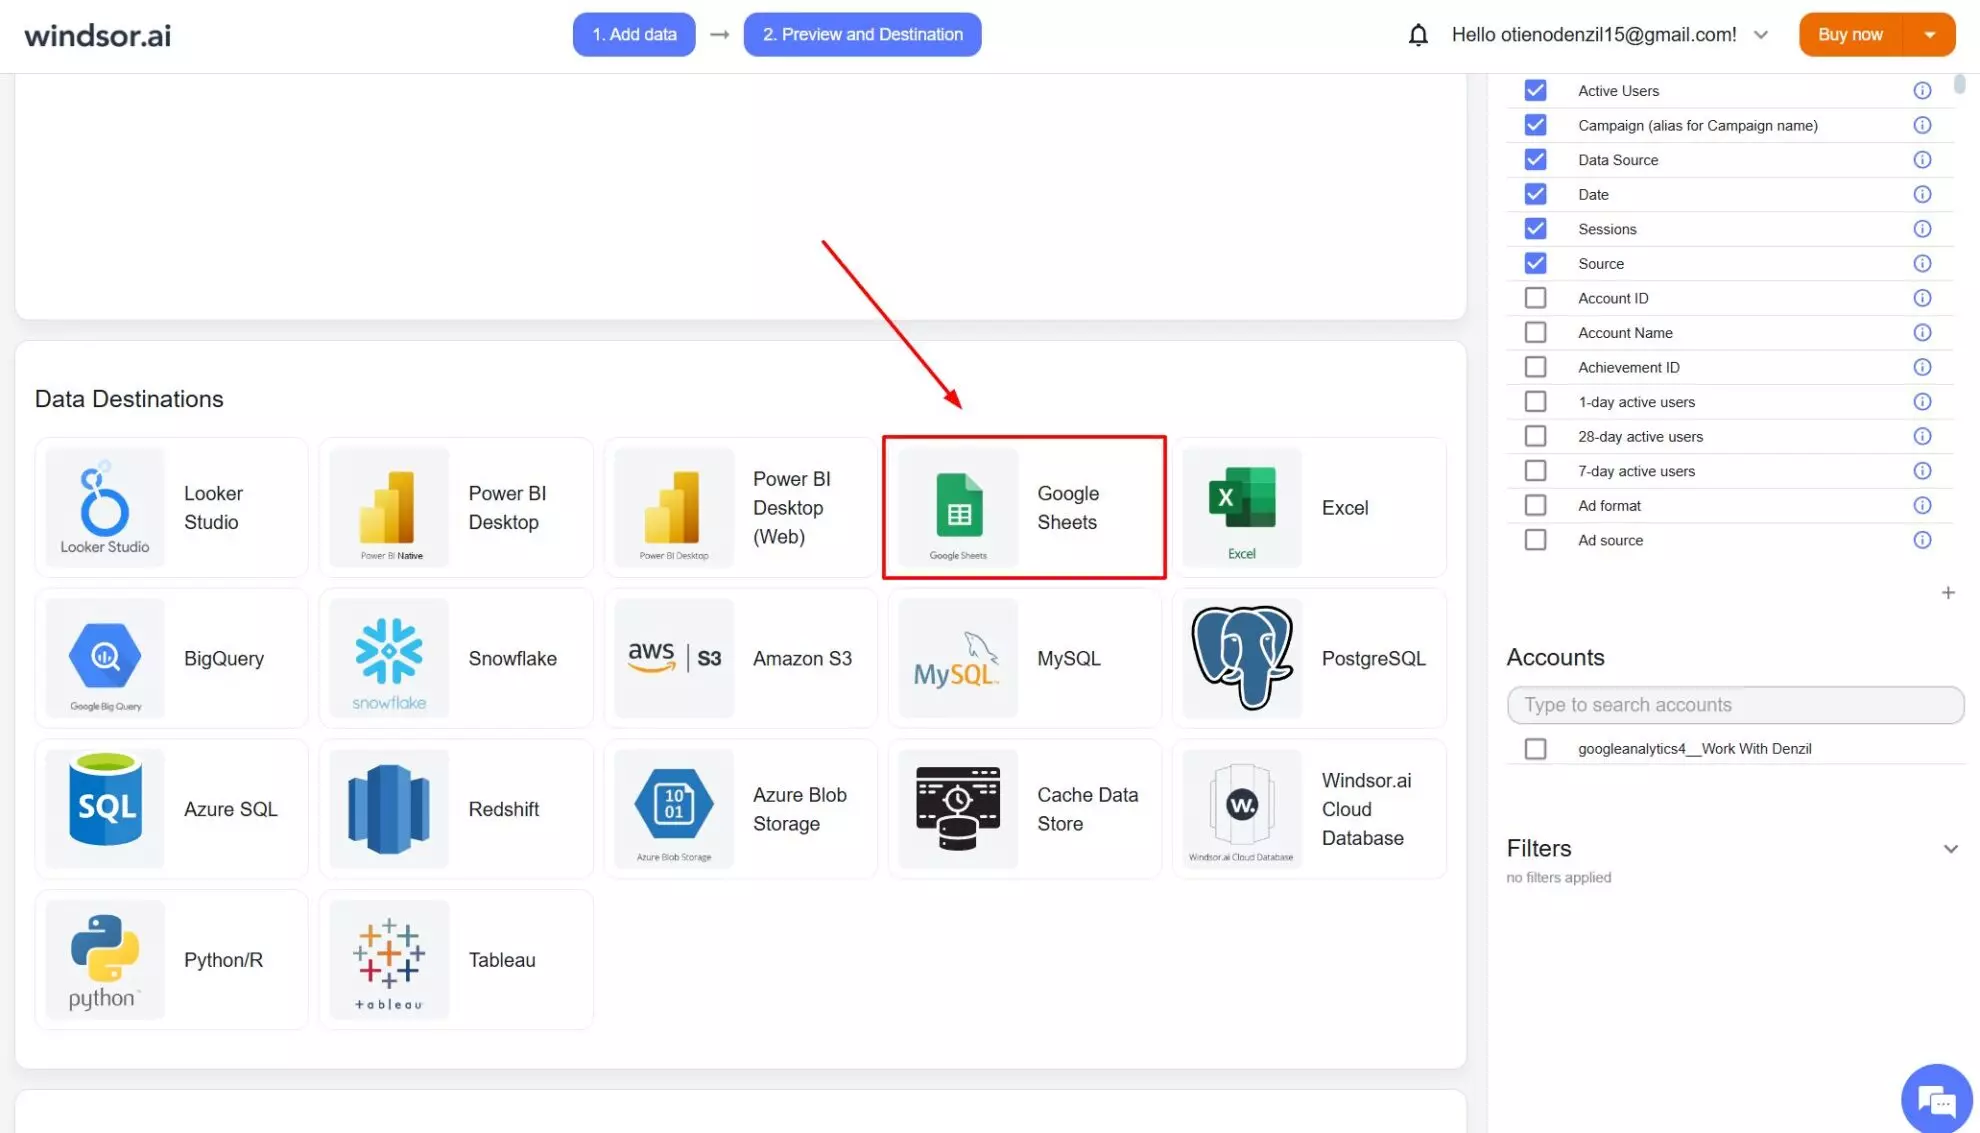
2. Click Add Destination task.

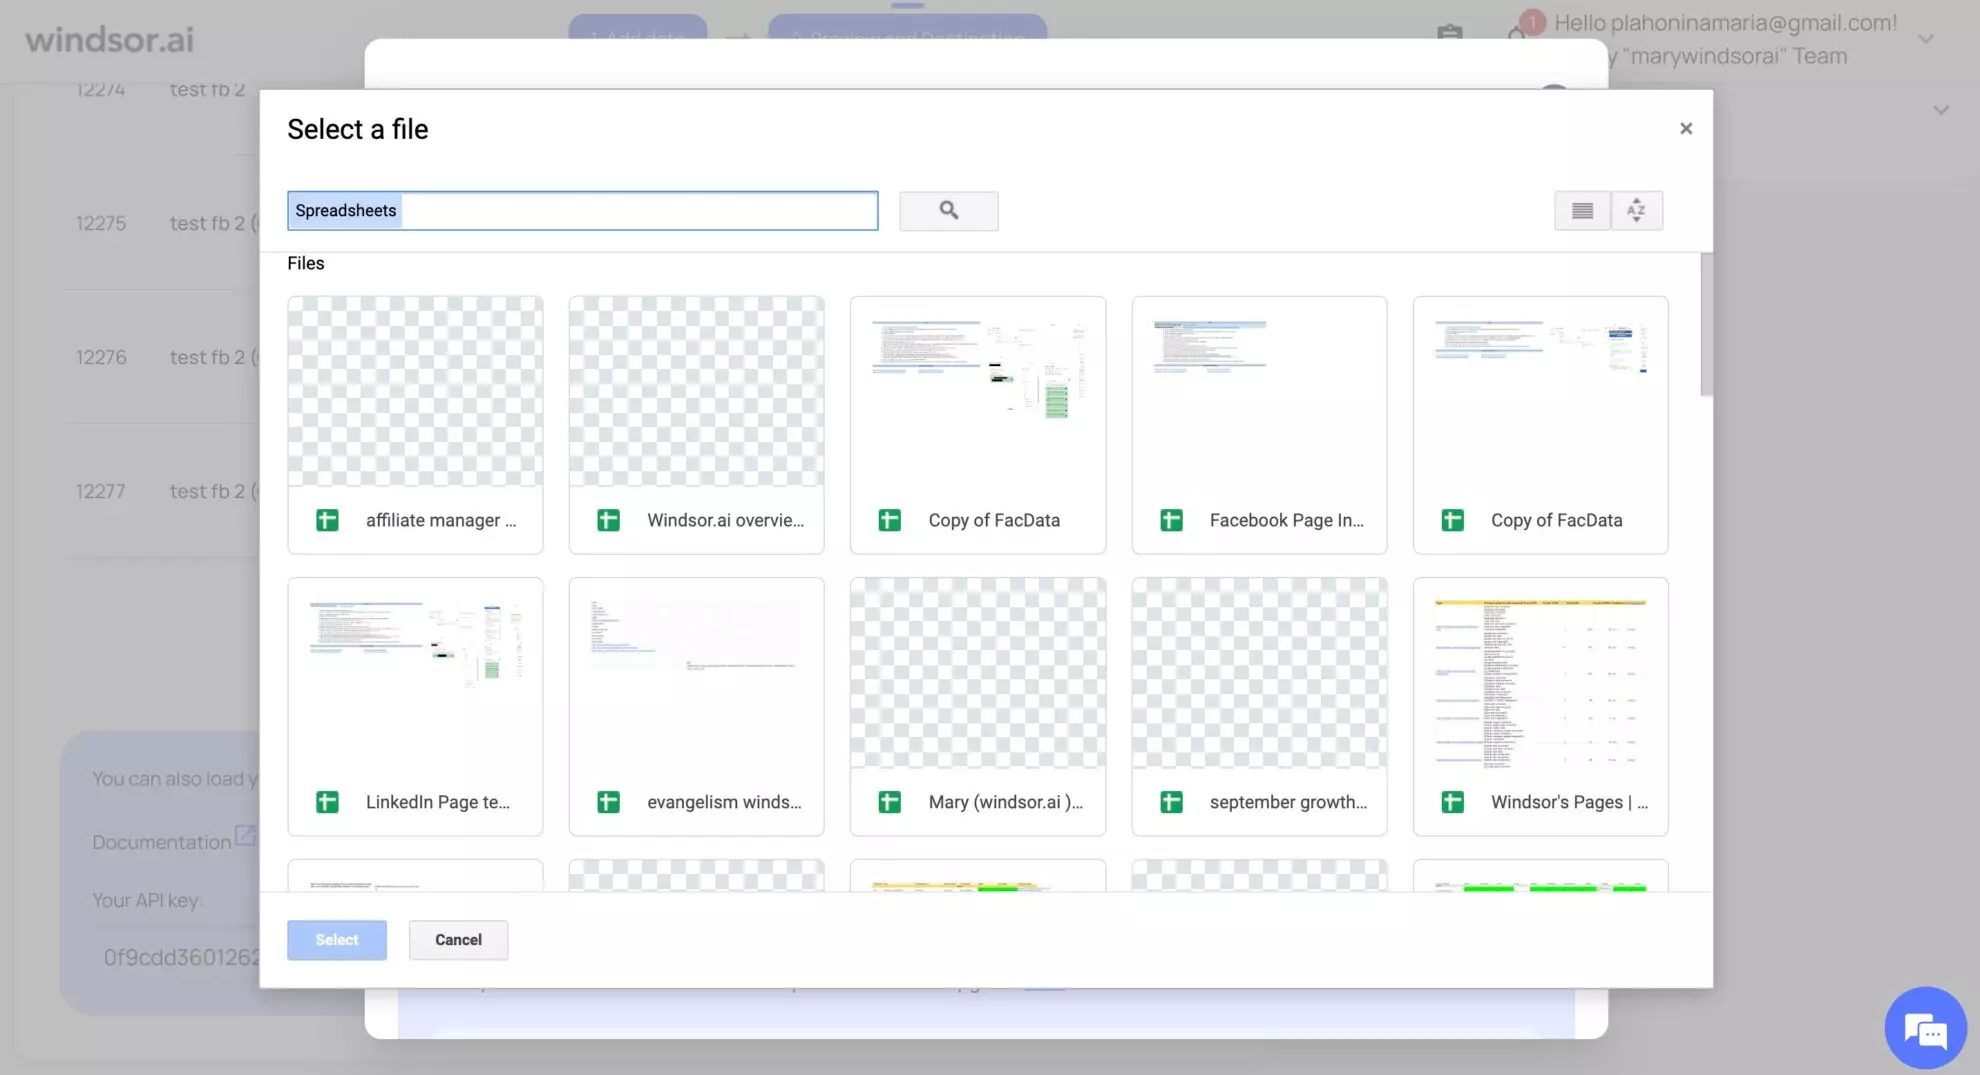
3. A pop-up will appear prompting you to authenticate your Google account. Once authenticated successfully, select the sheet where you want the data to be populated. You can either search for the sheet by name or choose it directly from your files.
4. After selecting the sheet where you want the data to be loaded, you’ll need to configure the destination task settings.
You have to enter the following details in the destination task:
- Task Name: Enter any name you wish.
- Document: Write down the name of the existing spreadsheet you want to stream data to, or select it using the button.
- Sheet Name: Select the existing name or create a new one.
- Backfill: You can backfill historical data when setting up the task (available only on the paid plans).
- Schedule: Define how often data should be updated in the spreadsheet (every 15 minutes, hourly, or daily; available on Standard plans and above).
- Columns to Match: The fields used to update data with each upload.
- Advanced options (optional) – Google Sheet Query id: The ID of the query in your Google Sheets document. This is automatically generated when you create a query.

5. When all is set, click Test connection and Save.

Now Windsor.ai will automatically write your marketing data into Google Sheets, enabling Google Sheets automation for reports.
6. Now in the dashboard, you can monitor the status of your destination task(s).
Once the upload is complete, the status will change to “Upload: OK.”

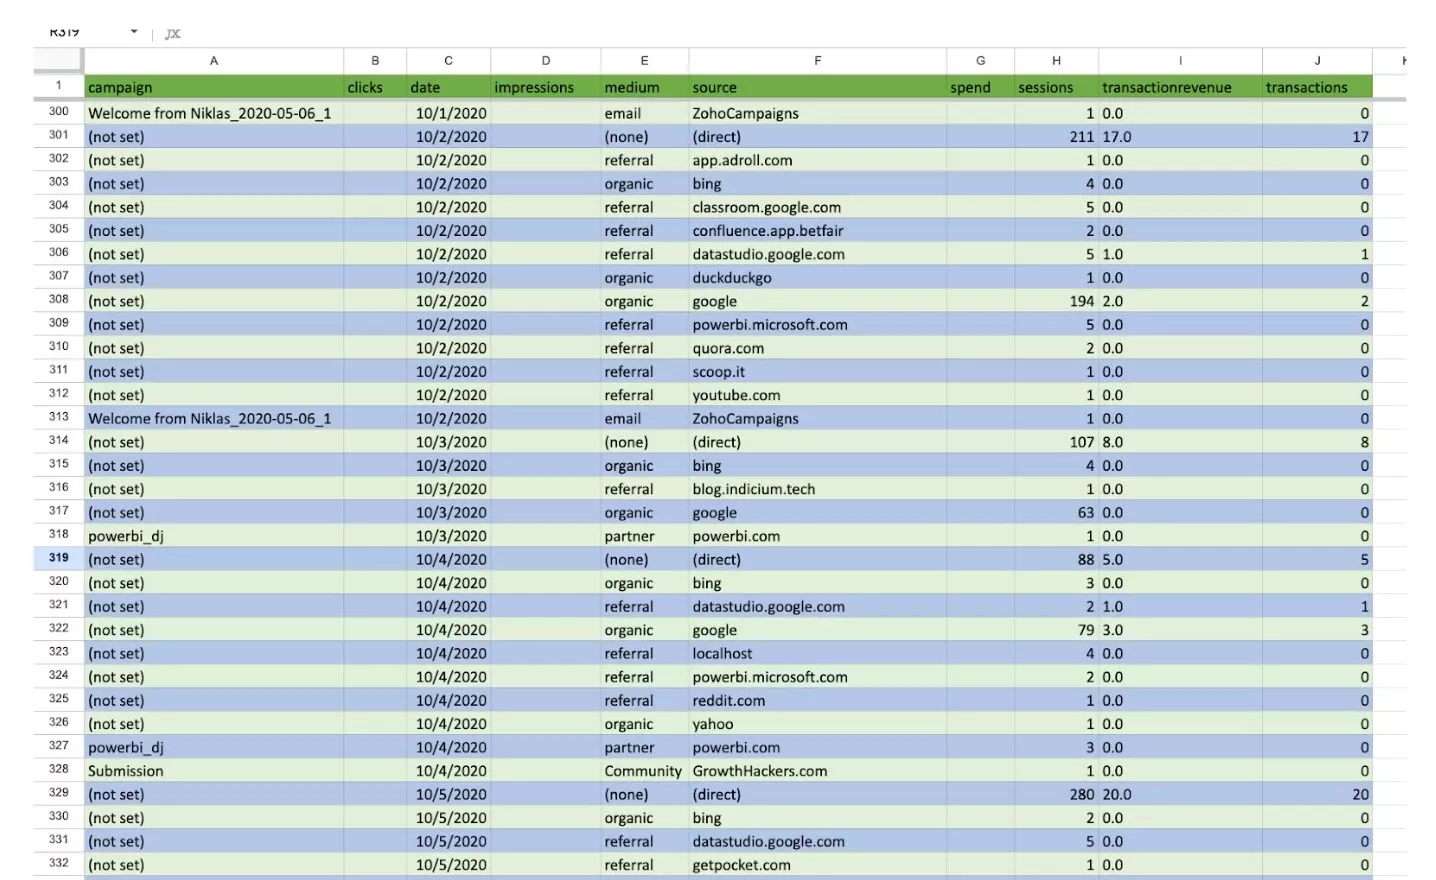
7. Open your connected spreadsheet to see the integrated data.
Pro tip: To make the data easier to read, you can apply color highlights to different data sources, helping you quickly identify and distinguish them.
Congratulations!
All your cross-channel marketing data is now blended, harmonized, and available for advanced reporting and analysis directly in Google Sheets.
Step 4: Visualize and customize your dashboard
With live data loaded, use Google Sheets features to build visuals and analysis layers:
- Charts: Line charts for trend analysis, pie charts for budget allocation.
- Pivot tables: Summarize spend, clicks, and conversions by channel or campaign.
- Formulas: Compute ROAS, CPA, CTR, etc.
- Conditional formatting: Highlight KPIs above or below target.
For a faster start and more comprehensive reports, use Windsor.ai’s pre-built Google Sheets dashboard templates for marketers, ready to plug in and customize.
Explore Windsor.ai’s Google Sheets Templates Here

These templates support multiple data sources (Google Ads, Facebook Ads & Organic, Instagram, LinkedIn Ads & Organic, and more) and are ideal for tracking real-time marketing metrics in Google Sheets without building dashboards from scratch.
Conclusion
Building an automated KPI dashboard in Google Sheets does not have to be complex. With Windsor.ai’s data connectors, you can visualize all your marketing data into a unified live dashboard that refreshes automatically.
No manual work. No messy imports. Just clear, accurate, and fresh marketing metrics in Google Sheets.
Start automating your marketing KPI dashboard in Google Sheets today using Windsor.ai and focus on analyzing results, not updating spreadsheets.
FAQs
What is a marketing KPI dashboard in Google Sheets?
A marketing KPI dashboard in Google Sheets is a centralized report that displays key performance metrics, such as spend, clicks, conversions, and ROI, across multiple marketing platforms.
Why should I automate KPI tracking instead of updating my Google Sheets manually?
Manual updates take time and often lead to inconsistencies, errors, or outdated data. Automating your KPI dashboard through Windsor.ai ensures your metrics are always accurate, fresh, and synchronized with your live campaigns, saving hours of repetitive work each week.
Can I connect multiple platforms to my Google Sheets dashboard?
Yes. Windsor.ai integrates with 325+ data sources, including Google Ads, Meta (Facebook) Ads, LinkedIn, GA4, HubSpot, and many others. You can blend all these datasets into a single Google Sheets dashboard for full cross-channel visibility.
How often does the data in my Google Sheets dashboard refresh?
You can configure your refresh schedule directly in Windsor.ai during a destination task setup, from every 15 minutes to once hourly, daily, or weekly, depending on your reporting needs. This ensures your KPI dashboard always reflects the most recent performance data.
Do I need technical skills or coding knowledge to set a Google Sheets KPI dashboard with Windsor?
Not at all. Windsor.ai is a no-code platform, meaning you can connect data sources, set up your dashboard, and schedule automated syncs without writing a single line of code or managing complex APIs.
Are Windsor.ai’s pre-built Google Sheets templates free to use?
Yes, all our templates are absolutely free to use. The only fees relate to data syncing, depending on the number of connected data sources, active destination tasks, and refresh schedule.
Is it possible to visualize KPIs beyond Google Sheets with Windsor.ai?
Absolutely. In addition to Google Sheets, Windsor.ai supports direct connections to Excel, Looker Studio, Power BI, Snowflake, BigQuery, and other BI tools and warehouses, giving you flexibility to adjust your analytics.
How does Windsor.ai ensure data accuracy across multiple platforms?
Windsor.ai uses automated data mapping and schema standardization to align field names, types, and metrics across all sources. This ensures your data stays consistent and comparable, even when platforms use different naming conventions.

