 Destinations
 Data sources
 AI insights
 About us
 Careers
 Security
 Customer reviews
 Contact us
 Affiliate program
 Solution partners
 Template gallery
 Looker Studio templates
 Power BI templates
 Excel templates
 Google Sheets templates
 Tableau templates
 Facebook Ads templates
 Google Ads templates
 Data fields & Metrics
 AI prompt library & Guides
 Product documentation
 API documentation
 Case studies
 Blog
Blog Data models
 Windsor vs Supermetrics
 Windsor vs Funnel.io
 Windsor vs Fivetran
 Windsor vs Rivery
 Windsor vs Portermetrics
 Windsor vs Coupler.io
Connect Amplitude to Claude
Automatically sync your Amplitude data to Claude using the Windsor.ai connector.
Identify the behaviors that drive retention and revenue, and turn your Amplitude data into a prioritized product roadmap with Claude.
Forget CSVs. Stop copy/paste. Connect data in minutes. No code required.
 Sign up with Google
 Free forever plan
No credit card needed
Free forever plan
No credit card needed










Increase user retention with Amplitude to Claude integration
Connect Amplitude to Claude with Windsor.ai to turn your behavioral data into instant AI insights and next step recommendations. Discover key use cases below:

Pinpoint drop-off friction
Ask Claude to analyze your conversion funnels to find exactly where users lose interest. It identifies whether a sudden exit is a one-time fluke or a consistent pattern caused by a specific step in your app.

Measure marketing ROI
Connect your ad spend (sources like Meta or Google Ads) to actual in-app actions from Amplitude. Claude can tell you which marketing campaigns are bringing in users who actually use the product, rather than just clicking an ad and bouncing.

Predict churn
By analyzing the behavior of users who became inactive over the past 14 days, Claude identifies the last actions they took before dropping off. It uncovers patterns, such as repeated settings changes or unsubscribe activity, that signal early signs of churn and help you act before more users leave.

Map user intent
Claude evaluates the sequence of actions within a single session to categorize what a user is trying to achieve. It distinguishes between someone ‘just browsing’ and someone showing ‘high-intent’ signals to buy.
Using Windsor.ai to connect data from Amplitude to Claude
Forget manual exports, API work, and time-consuming data cleanup. Windsor.ai’s connector automatically pulls, cleans, and streams your Amplitude behavioral data directly into Claude.
Connect in minutes and use natural language prompts to analyze user journeys, detect friction points in your funnels, and identify behaviors that convert.















How to connect Amplitude to Claude with Windsor.ai
Explore our video tutorial and a step-by-step guide to integrate your data from any source into Claude with the Windsor.ai connector.
Select your data source
Choose Amplitude as your data source and grant access to Windsor.ai.

Install the Windsor.ai connector in Claude
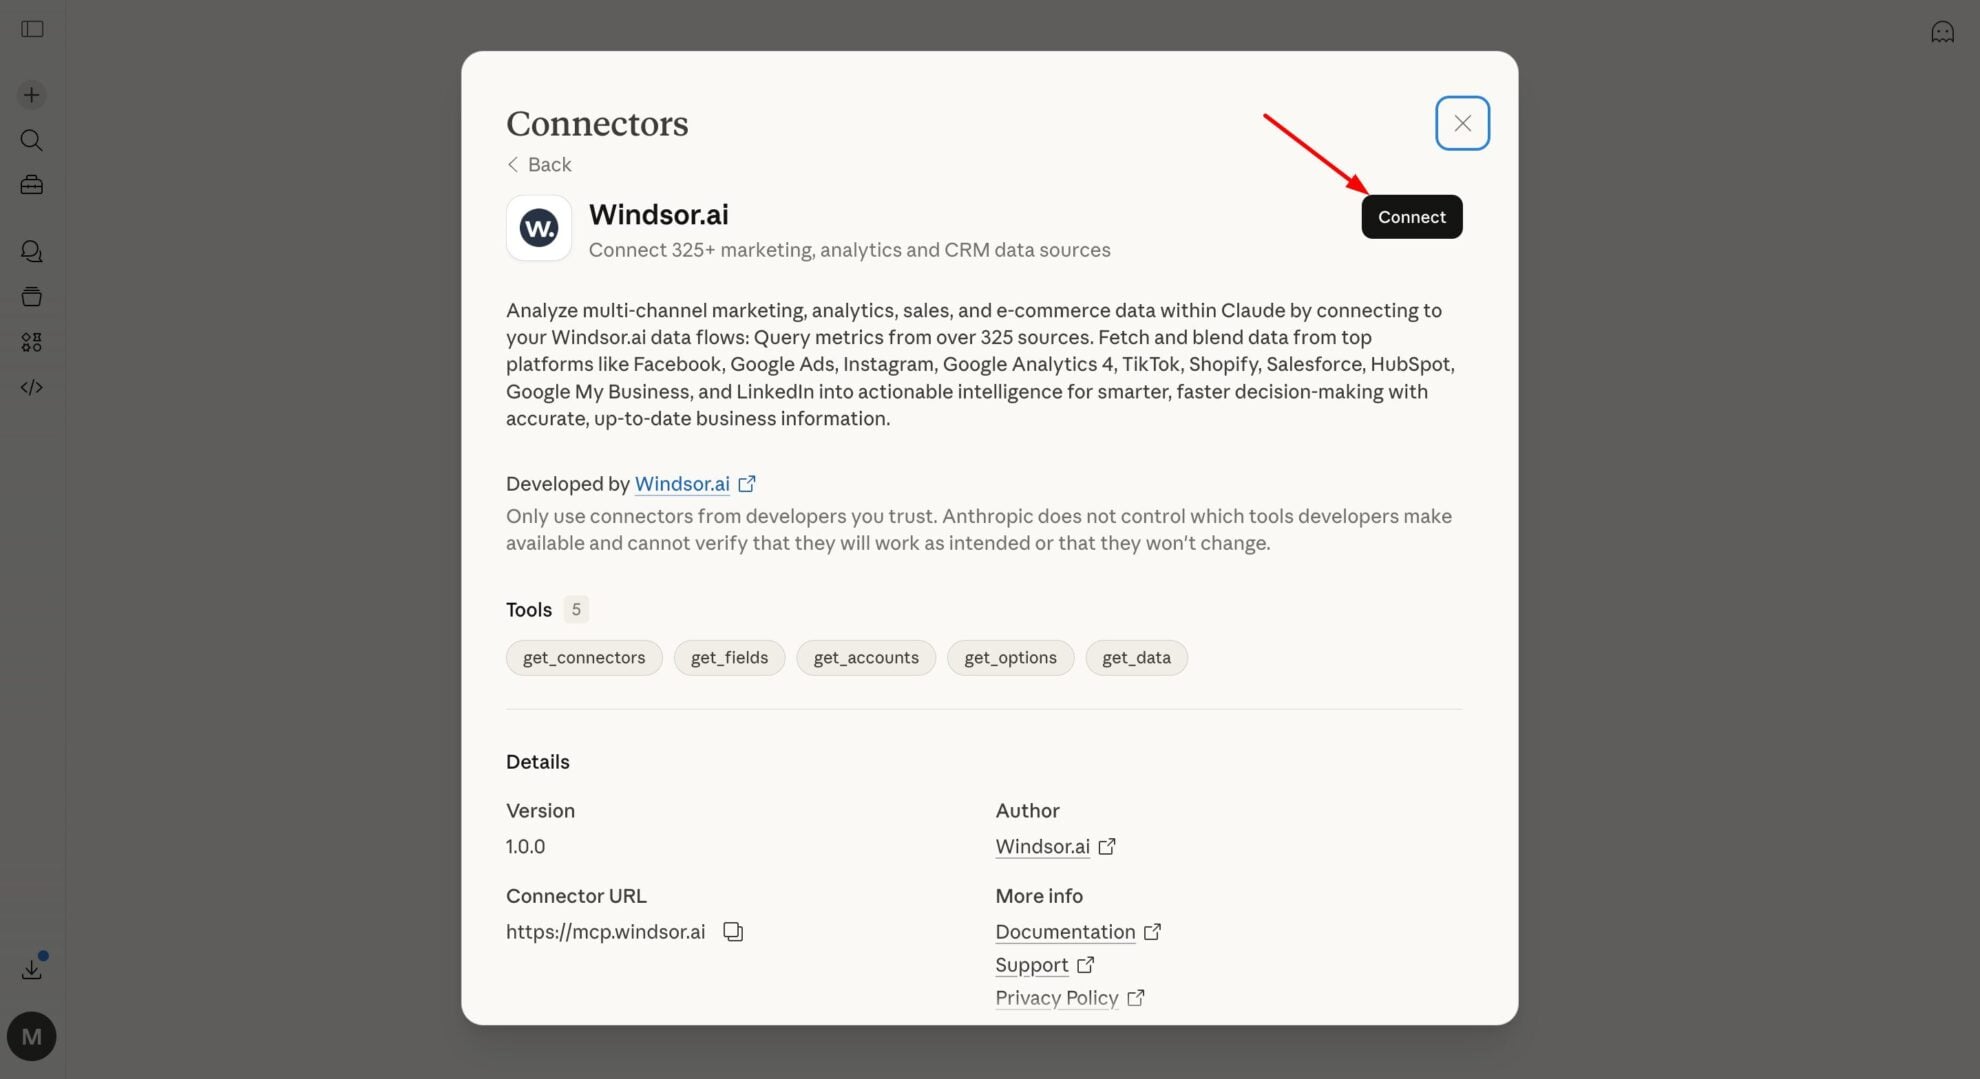
In Claude, open Customize, then Connectors, search for Windsor and click Add. Sign in to your Windsor.ai account when prompted, and the connector appears in your Connectors list. You can also open the Windsor.ai listing in the Claude directory and click Connect.
Query your data in Claude
Start a new chat and ask Claude questions about your connected data: summarize KPIs, create client reporting dashboards, or run advanced analyses.

FAQs
What can I do with Amplitude data in Claude with Windsor MCP?
Once your Amplitude data is in Claude, you can:
- Understand user behavior by analyzing user journeys, feature adoption, and behavior patterns without building dashboards.
- Identify retention drivers, churn signals, and drop-off points across the user lifecycle to understand what keeps users engaged or causes them to leave.
- Compare user segments and cohorts to find your most valuable audiences and understand how different groups contribute to growth and revenue.
- Run cross-channel analysis by combining Amplitude data with 350+ marketing, CRM, or revenue sources to connect product behavior with conversions and revenue.
- Get instant insights, explanations, and recommendations to improve product performance and drive growth.
Find more details about Windsor MCP for Claude use cases in this guide: https://windsor.ai/how-to-use-windsor-mcp-examples-use-cases/.
Can this integration help with A/B test analysis?
Claude can analyze your Amplitude experiment data to determine which variant performed better, explain differences in user behavior, and highlight what likely drove the results.
Can Claude suggest new events I should be tracking?
Definitely. By analyzing your existing data and business goals, Claude can identify gaps in your current tracking and recommend additional events to measure user behavior, conversions, and product performance.
What prompts can I use when analyzing Amplitude data in Claude?
Use more advanced, specific prompts to extract deeper insights from your Amplitude data. For example:
-
Analyze retention trends for users acquired over the last 3 months. At what point does engagement start to decline for each group, and what actions do high-retention users take before that drop?
-
Compare users acquired from marketing campaigns vs organic over the last 30 days. Are campaigns driving new conversions, or mostly re-engaging users who would have converted anyway?
-
Over the last 60 days, identify users who consistently use one core feature but never adopt another key feature. What typically happens before users adopt that second feature, and how can we encourage that transition?
-
Analyze the journeys of users who converted over the last 30 days. How many sessions does it typically take, and what key actions happen at each stage before conversion?
How much does it cost to integrate Amplitude into Claude using Windsor.ai?
Windsor.ai’s pricing for Claude data integration varies depending on the number of connected accounts and data sources. We offer absolutely transparent pricing plans for diversified business needs and budgets.
How long does it take to connect Amplitude to Claude?
With Windsor.ai’s easy-to-use connector, the integration process takes just a few minutes. No technical expertise is needed; syncing Amplitude to Claude is simple, straightforward, and completely code-free.
Do you have helpful links to get started with integrating Amplitude and Claude using Windsor.ai?
Yes, we have helpful resources to help you get started. You can explore our official documentation and tutorials for seamless Amplitude to Claude integration with Windsor.ai:
Tired of manual Amplitude data exports? Try Windsor.ai today to automate your reporting


