 AI insights
 About us
 Careers
 Security
 Customer reviews
 Contact us
 Affiliate program
 Solution partners
 Looker Studio templates
 Tableau templates
 Facebook Ads templates
 Google Ads templates
 Data fields & Metrics
 AI prompt library & Guides
 Product documentation
 API documentation
 Case studies
 Blog
Blog Data models
 Windsor vs Supermetrics
 Windsor vs Fivetran
 Windsor vs Portermetrics
 Last updated: 22 April 2026

Meta API is quite complex, with hundreds of metrics and dimensions. However, tracking results inside Ads Manager has its limits and could be challenging, especially if you manage multiple accounts. For more effective and streamlined Facebook Ads analytics, Looker Studio comes as a better solution.
By connecting Facebook Ads to Looker Studio, you automate reporting, remove the need for manual CSV exports, and get access to deeper insights. Looker Studio Meta Ads dashboards enable you to track CTR, CPA, ROAS, conversions, and other essential metrics in near real-time. For agencies, this integration is even more powerful, as they can easily build client-facing reporting dashboards in minutes, without repetitive work.
In this guide, we’ll show you three methods to connect Facebook Ads to Looker Studio. You’ll learn how to set up the automated sync with Windsor.ai, as well as explore manual and developer options. Whether you manage one ad account or hundreds, you’ll find a solution that fits your needs.
3 methods to connect Facebook Ads to Looker Studio
Method 1: Fully automated setup via Windsor.ai native connector
Wondering how to link Facebook Ads to Looker Studio automatically? Get started with Windsor.ai.
Windsor.ai is a powerful data integration platform that helps you centralize and automate reporting across 325+ data sources. Instead of exporting CSVs or writing custom scripts, Windsor directly connects your Facebook Ads account(s) with Looker Studio, enabling real-time performance tracking without manual effort.
The best part? We offer a vast library of free marketing templates to help you set up automated Facebook Ads reporting in Looker Studio in minutes with no code.
Our native Facebook Ads connector for Looker Studio handles data extraction, transformation, and integration, making it ideal for both in-house teams and agencies.
Why use Windsor.ai for Facebook Ads to Looker Studio integration:
- Fully automated Facebook Ads reporting in Looker Studio
- Scheduled dashboard updates
- Integrate data from multiple ad accounts (ideal for agencies with hundreds of accounts)
- Pre-built templates for faster reporting
- Data blending with other marketing and sales platforms (Google Ads, GA4, Shopify, and more) for cross-channel analytics
- Starts at just $19/month with unlimited Facebook Ads Looker Studio integrations
- Supports further data streaming to Google BigQuery
Step-by-step guide to load Facebook Ads data to Looker Studio via Windsor.ai
Visit this integration guide for more information: https://windsor.ai/documentation/how-to-integrate-data-into-looker-studio.
1) Log in to Windsor.ai
Get started with Windsor.ai with a 30-day free trial. Create your Windsor.ai account and log in.
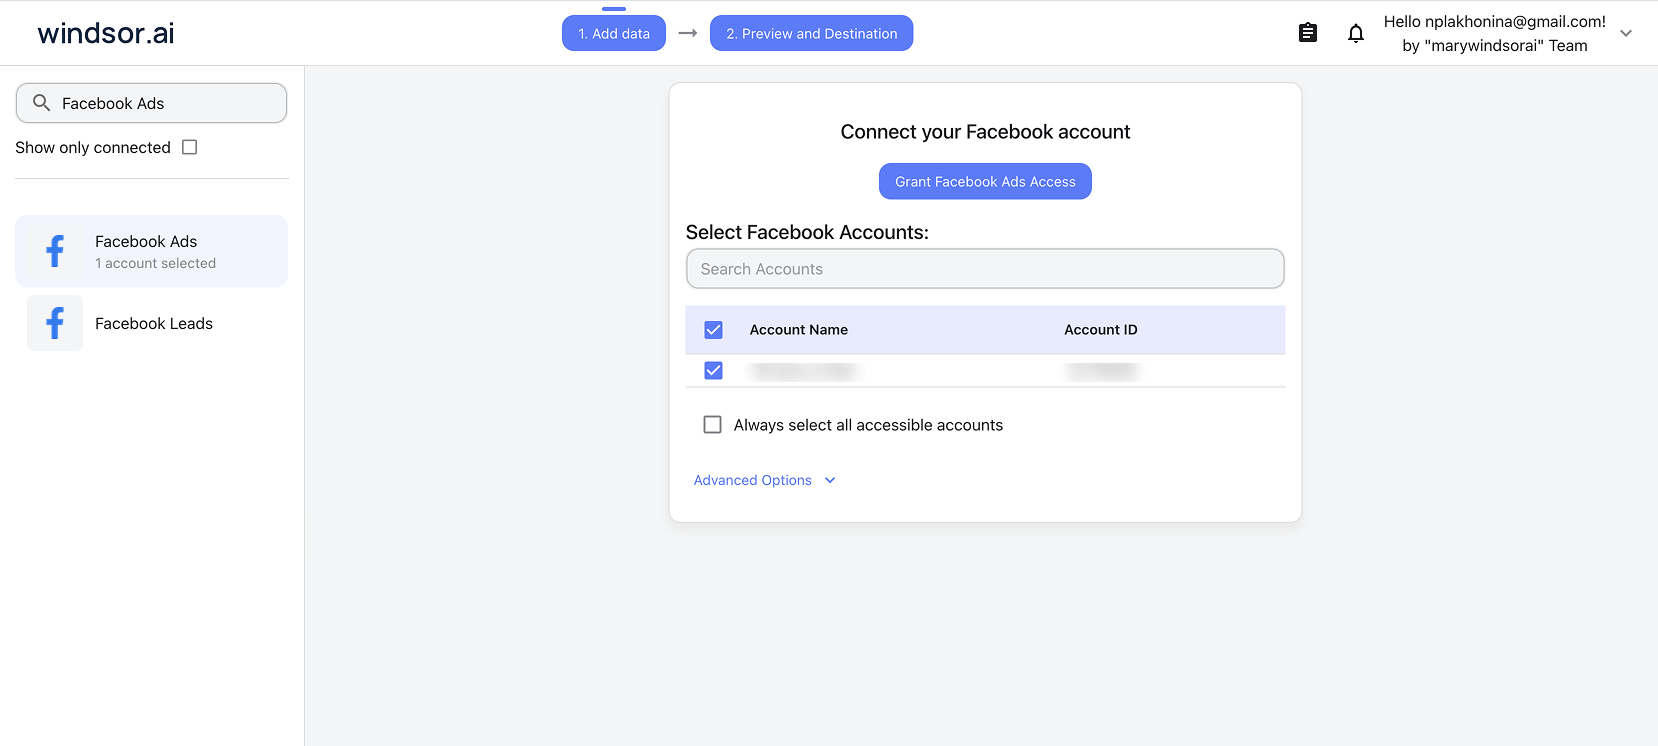
2) Connect Facebook Ads as your data source
In the left-side panel, select Facebook Ads and authorize your Facebook account(s) you want to pull data from. Click Next to continue.
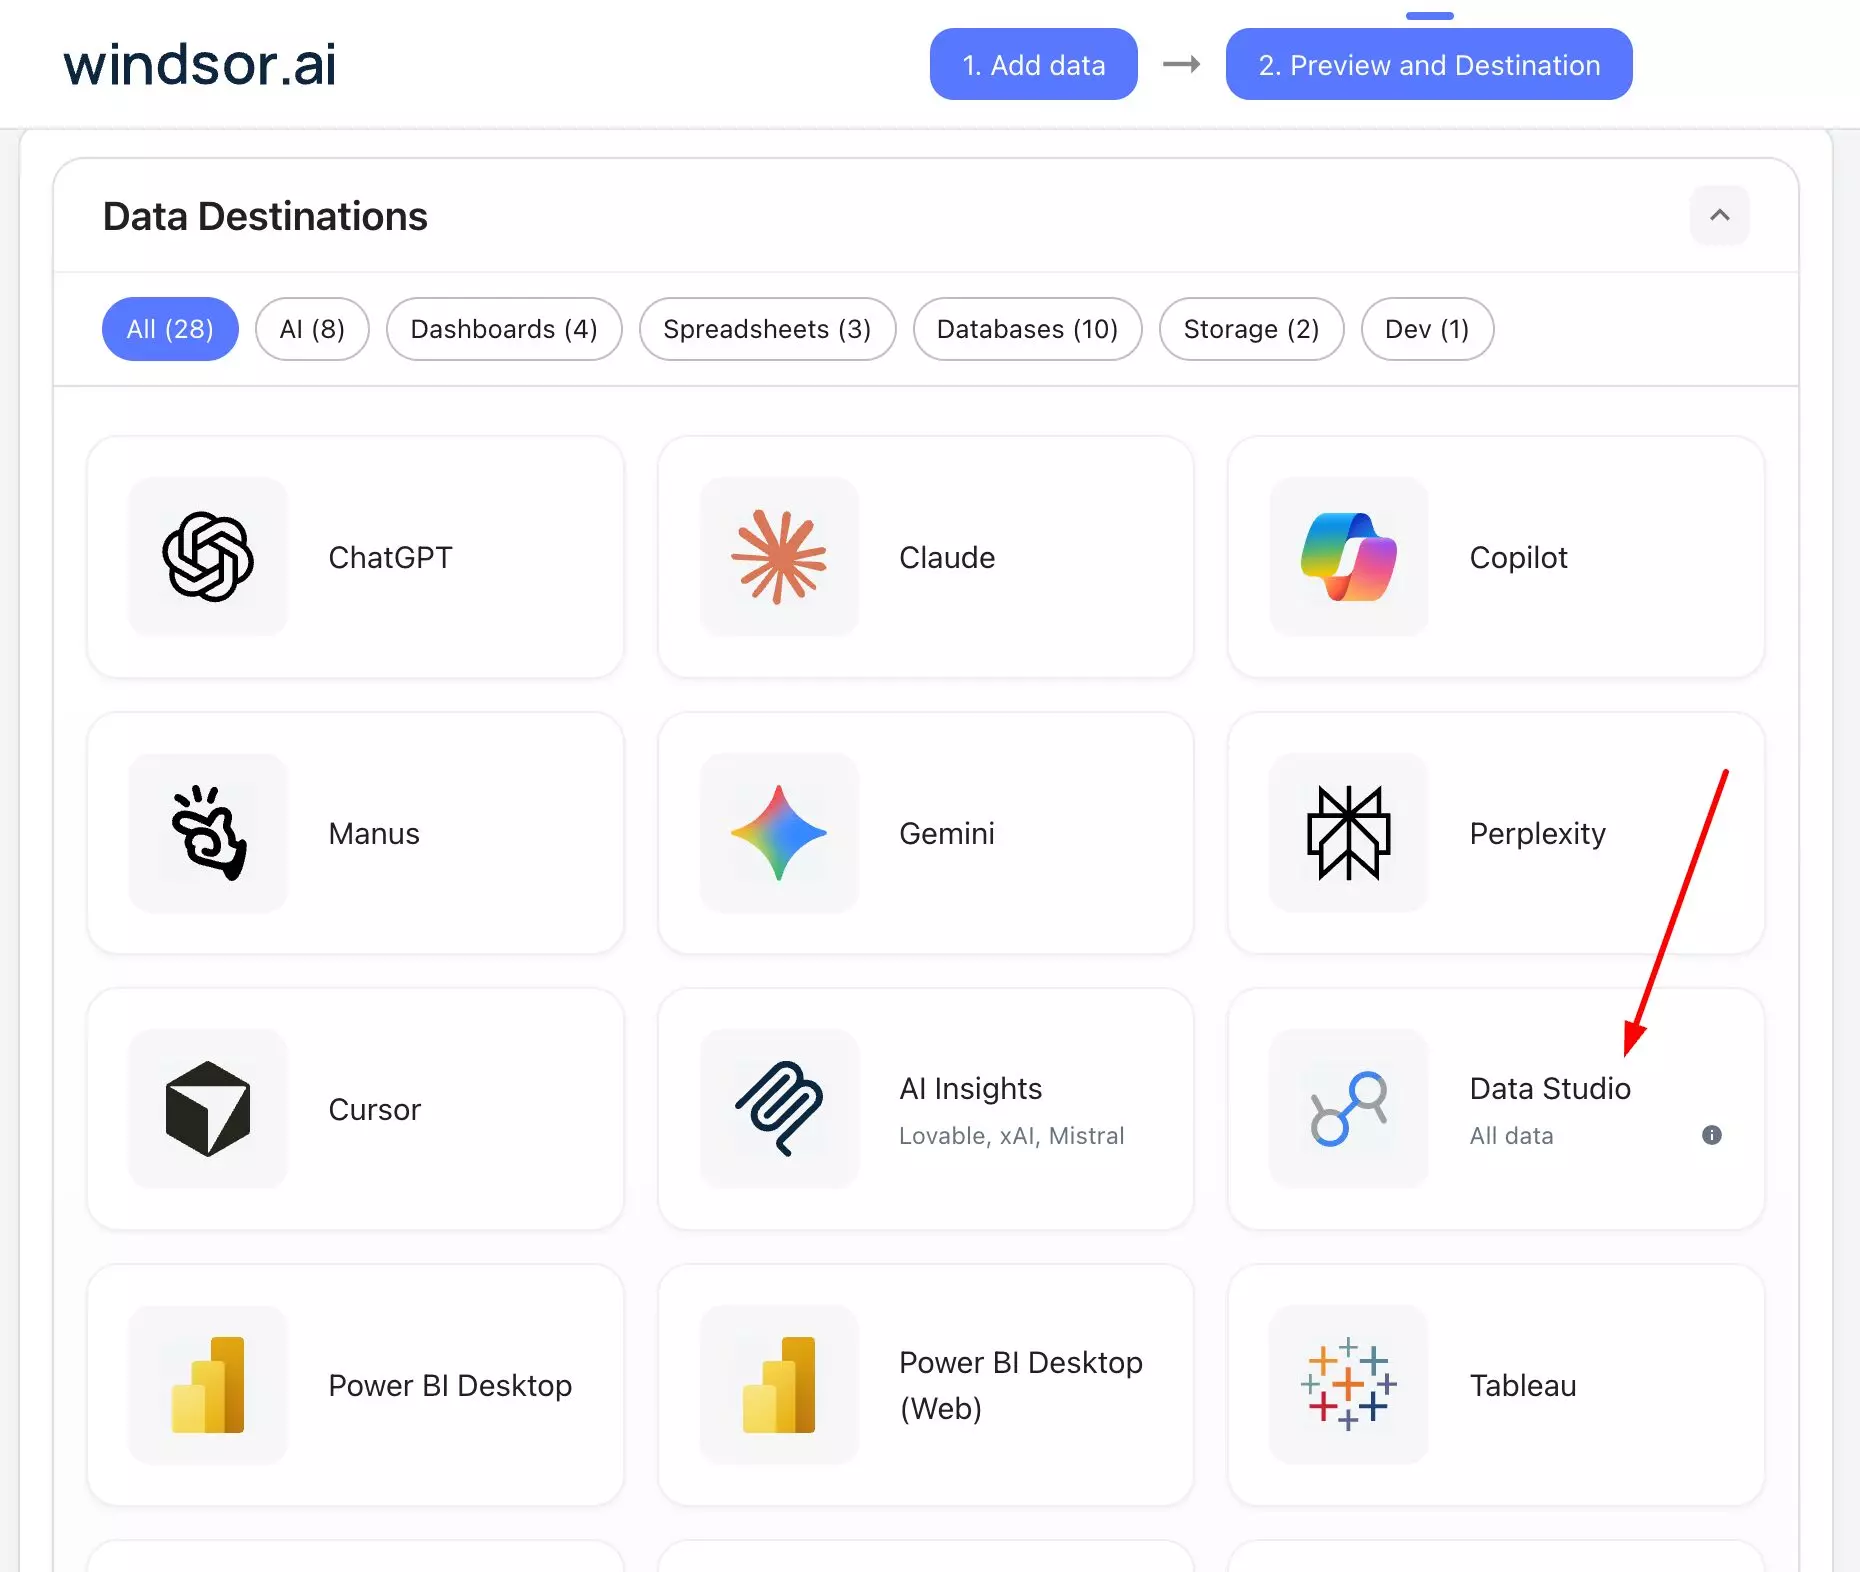
3) Select Data Studio (Looker Studio) as your destination
Scroll down to the Data Destinations section and choose Data Studio.
Authorize the connection to sync Windsor.ai with your Data Studio account.
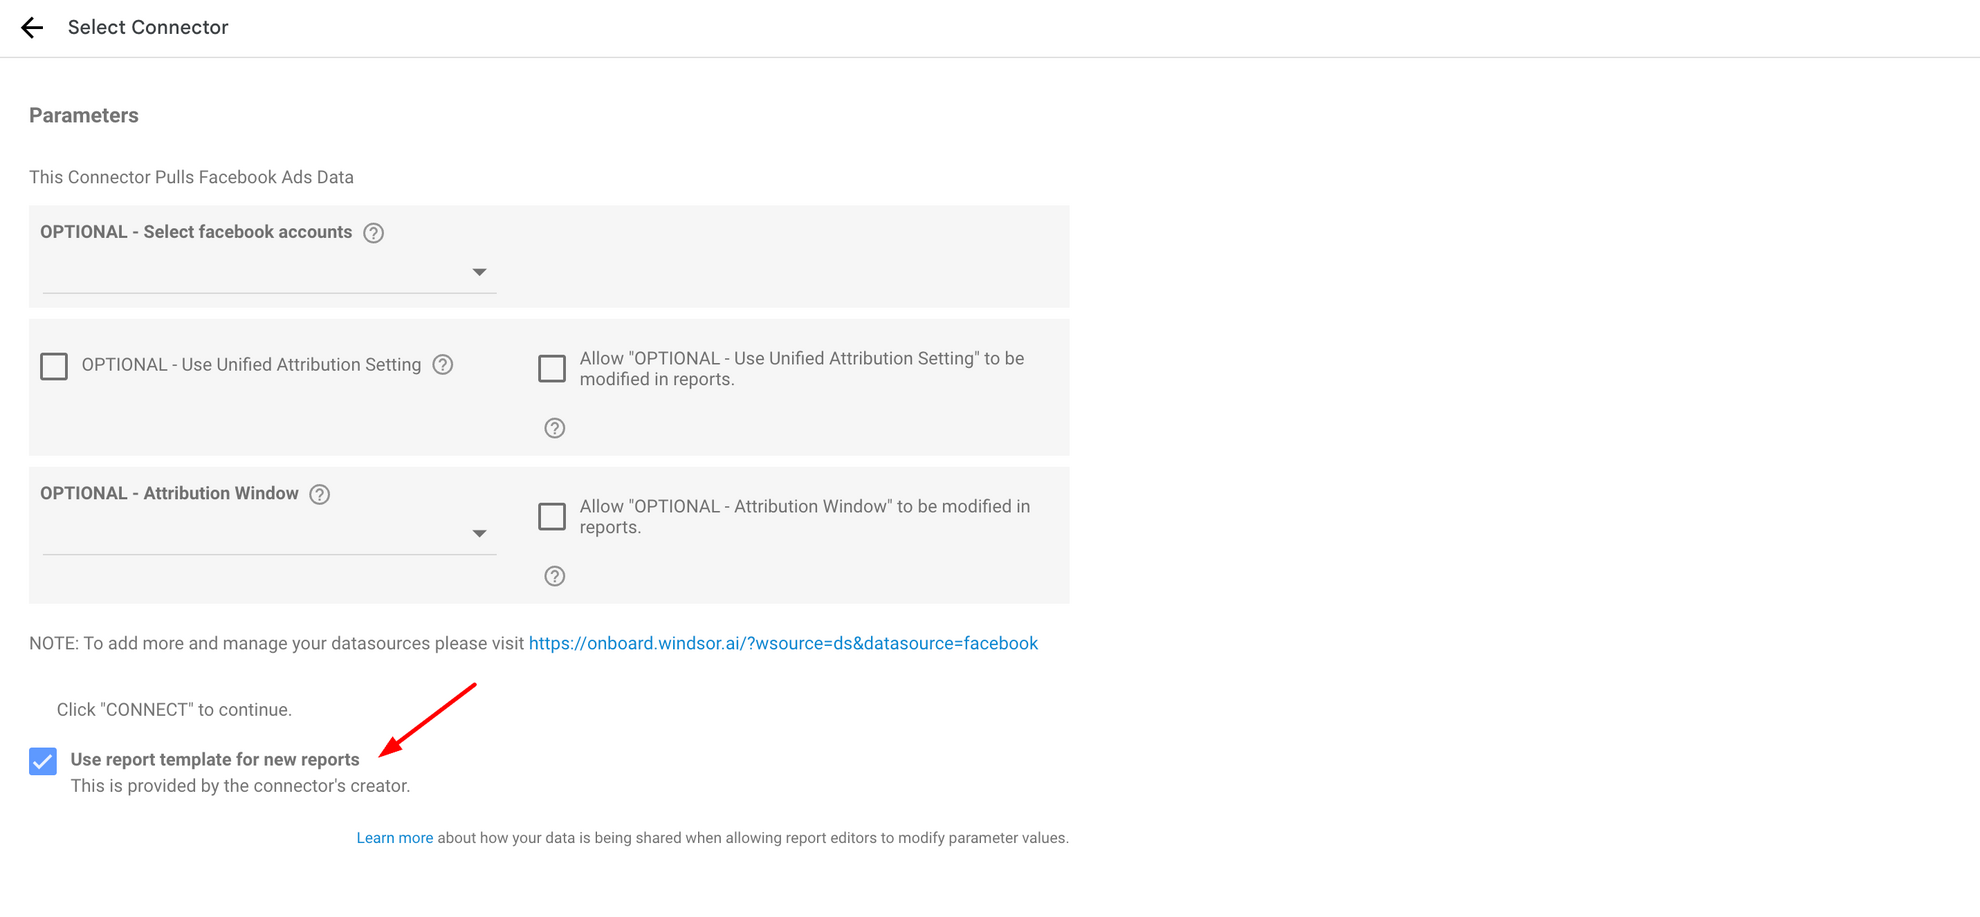
4) Finalize the setup
Windsor.ai’s Facebook Ads connector for Data Studio will open. Choose the Facebook Ads account(s) you want to track, then click Connect → Create Report. Windsor.ai will instantly push the data into Data Studio.

5) Use a pre-built template or build custom dashboards
You can either use Windsor.ai’s pre-built Facebook Ads Looker Studio templates to monitor specific KPIs or design a custom dashboard that aligns with your unique reporting goals.
This fully automated setup takes less than 5 minutes and removes repetitive manual exports, ensuring your dashboards always reflect live data.
Method 2: Manual export + Google Sheets connector
If you want a free, no-frills option for connecting Facebook Ads data to Looker Studio, you can use a manual export process combined with Google Sheets. This method avoids using third-party automation tools, but it requires more effort to keep data updated. It’s best suited for one-off reporting tasks.
Step-by-step guide to load Facebook Ads data to Looker Studio manually
1) Export data from Facebook Ads
Go to Facebook Ads Manager. From your reporting view, select the desired metrics and date ranges to analyze. Export the data as a CSV file.
2) Upload this CSV file to Google Sheets
Open Google Sheets and upload the exported CSV file. Ensure the columns are clean and properly labeled, as messy formatting can cause issues in Looker Studio.
3) Connect Google Sheets to Looker Studio
In Looker Studio, click Add Data Source and select Google Sheets. Choose the uploaded sheet, and map the fields to dimensions and metrics. Once connected, you can build charts, tables, and calculated fields directly in Looker Studio.
Pros:
- Free method: No subscription is required.
- Easy-to-use: No extensive technical skills are required.
- Flexible: You control what data is exported and uploaded.
Cons:
- Completely manual: You must repeat the process each time you want fresh data.
- Time-consuming: Frequent exports and uploads can quickly become a burden.
- Error-prone: Incorrect column format or a missing update may break your dashboards.
This approach works fine if you only need occasional snapshots of Facebook Ads performance. However, for ongoing monitoring, the manual process can be time-consuming and introduce reporting inconsistencies.
If your reporting needs are regular or scalable, shifting to an automated connector like Windsor.ai saves significant time and prevents errors.
Method 3: Using Meta’s Marketing API (dev setup)
For teams with in-house development resources, Meta’s Marketing API offers the most flexible way to connect Facebook Ads data with Looker Studio.
You can directly query Facebook’s ad performance data, transform it, and send it into a data warehouse or Google Sheets, which can then be linked to Looker Studio.
This approach is fully customizable but requires coding expertise and continuous maintenance.
How it works
Developers register a Facebook App in Meta for Developers, generate access tokens, and set the required permissions (ads_read, ads_management).
Using REST API calls, they can pull detailed campaign, ad set, and creative-level metrics in JSON format.
Once fetched, this data can be processed with Python, Node.js, or another backend language, then stored in a structured format.
From there, it can be connected to Looker Studio through Google Sheets, BigQuery, or another supported connector.
Pros:
- Full customization: You control which metrics, dimensions, and breakdowns are collected. There are limitless opportunities for custom metrics, derived KPIs, and blended datasets.
- Scalable solution: This setup can handle large volumes of data and integrate with multiple platforms (e.g., blending Facebook Ads with Google Ads or CRM data).
- Direct access: No reliance on third-party connectors or templates.
Cons:
- Requires coding: You should be familiar with APIs, authentication, and data pipelines.
- Ongoing maintenance: API versions change frequently, requiring updates to scripts and integrations to prevent broken pipelines.
- Time-intensive: The initial setup can be more complex compared to plug-and-play connectors.
This method is ideal for organizations that need complete control over their reporting pipeline. However, for most marketing teams without dedicated engineering support, a managed connector like Windsor.ai is a faster, easier, and more cost-effective option.
Comparison of Facebook Ads Integration Methods for Looker Studio
| Comparison factor | Vis Windsor.ai native connector | Manual export + Google Sheets | Vis Meta’s Marketing API (dev setup) |
| Setup effort | Very easy. Sign in, authorize accounts, connect data, and start streaming data to Looker | Moderate. Requires exporting CSVs, cleaning data, and syncing Sheets to Looker | Complex. Requires developer-first setup, coding, and API configuration and maintenance |
| Automation | Fully automated with scheduled updates | None. Manual re-export and upload needed | Automated once scripts and pipelines are built |
| Data freshness | Near real-time or scheduled sync | Static – only as fresh as your last upload | Near real-time, depending on pipeline setup |
| Customization | Field-level reporting, data blending, custom queries, pre-built templates | Limited to what you export and map in Sheets | Full customization of metrics, dimensions, and blended datasets |
| Scalability | Supports hundreds of accounts, ideal for agencies | Not scalable; becomes unmanageable for large datasets | Highly scalable with the right setup |
| Cost | Starts at $19/month with unlimited integrations | Free (only requires a Google account) | Infrastructure + development costs |
| Pros | Easy setup, scheduled syncs, ready-made templates, multi-account support, data blending with 325+ sources | Free, simple for beginners, flexible control over exports | Maximum control, scalable, direct data access |
| Cons | Paid subscription required | Manual, time-consuming, error-prone | Requires coding, high maintenance, time-intensive |
| Best for | Agencies, marketers, and teams that require reliable, automated dashboards | One-off reporting needs | Enterprises with dedicated dev teams that need full control over data |
Why connect Facebook Ads to Looker Studio
Whether you’re a freelance PPC expert or a marketing agency, integrating Facebook Ads data into Looker Studio brings the following valuable benefits:
Centralized reporting
Facebook Ads data often sits in isolation within Ads Manager. Adding other advertising campaigns from Google, LinkedIn, or other platforms can make performance tracking messy. Looker Studio brings all your accounts together in one place, so you can visualize results across multiple channels, without switching tabs or exporting spreadsheets.
Automated updates
Manual exports quickly become overwhelming and error-prone. Data has to be downloaded, copied, and refreshed each time. With Looker Studio, your Meta Ads results refresh automatically. Reports pull in live data, so CTR, spend, and conversions stay accurate without constant manual updates. This frees up time for analysis instead of data wrangling.
Custom dashboards
Different teams focus on different metrics. Some prioritize CTR, others want to see ROAS or cost per action. Looker Studio makes it easy to design dashboards that match specific reporting goals. Scorecards, tables, and charts highlight key insights, while comparisons over time reveal campaign trends and patterns.
Client reporting
For agencies and PPC managers, client reporting is a constant demand. Preparing individual reports often consumes valuable hours. Looker Studio simplifies the process by linking multiple Facebook Ads accounts into ready-to-use dashboards that can be easily adjusted to every client’s project.
Bonus tips: how to build an insightful Facebook Ads dashboard in Looker Studio
Designing a Facebook Ads dashboard in Looker Studio is not just about pulling numbers; it’s about visualizing them effectively to guide smart decisions. These tips will help you make a Facebook Ads dashboard a valuable source of insights:
Add scorecards for impressions, spend, and CTR
Scorecards are the simplest way to track key performance indicators. They provide quick answers to questions like: How many people saw the ads? How much was spent? Did users click?
For example, an e-commerce store running seasonal sales can display impressions, spend, and CTR in scorecards at the top of the dashboard. During a Black Friday campaign, if impressions rise but CTR falls, the team instantly understands creatives need adjustments.
Use charts for campaign performance over time
Static numbers don’t tell the full story. Trends matter. Line charts and bar charts make it easier to see how performance shifts over days, weeks, or months.
Consider a mobile app company tracking installs from Facebook Ads. A line chart can reveal if installs spike after a specific ad set launch. If installs start dropping after a week, the team sees when fatigue sets in and can rotate creatives.
Compare ROAS by campaign, ad set, or creative
Return on Ad Spend (ROAS) is a key measure of strategy efficiency. By comparing ROAS across campaigns, ad sets, or creatives, marketers can see where money delivers the most value.
Take a digital agency managing multiple clients. For one retail client, dashboards can break down ROAS by campaign type, such as prospecting versus retargeting. If retargeting delivers a 6x ROAS while prospecting stays below 2x, budgets can be shifted quickly.
Combine all these elements for deeper insights
A dashboard works best when scorecards, charts, and comparisons are combined. Top-level KPIs in scorecards give quick checks. Trend charts show movement over time. ROAS comparisons highlight what works best.
For instance, a SaaS company can build a dashboard that displays scorecards for spend and CTR, a line chart showing trial signups over time, and a ROAS table comparing ad creatives. This setup not only measures efficiency but also guides creative and budget decisions.
Conclusion
Connecting Facebook Ads to Looker Studio unlocks smarter reporting and faster insights. Instead of juggling CSV files and multiple accounts, all your advertising data flows into one place. Reports stay updated automatically, giving a real-time view of spend, CTR, ROAS, and conversions.
For marketers, this means less manual work and more time to optimize campaigns. For agencies, the benefits are even greater. Client-facing dashboards can be built once and then reused across multiple accounts. This reduces repetitive tasks and delivers professional, always-on Facebook Ads reporting in Looker Studio.
Among the available methods, Windsor.ai stands out as the most effective solution. Our native connector makes setup easy, supports syncing multiple accounts, and seamlessly integrates Facebook Ads with other channels, such as Google Ads, GA4, Shopify, and more. This creates a true cross-channel view of performance.
Whether managing one account or hundreds, Looker Studio with Windsor.ai helps teams scale reporting and focus on strategy.
👉 Get started today with Windsor.ai’s Facebook Ads Looker Studio connector and build your first automated dashboard with us in minutes!
FAQs
How do I connect separate accounts to different Looker Studio dashboards?
Connect each Facebook Ads account separately in Windsor.ai. Then assign it to a specific Looker Studio dashboard. This keeps your reporting clean and organized.
How do I blend data from multiple data sources?
Use Windsor.ai’s data blending feature. During query creation, combine Facebook Ads with Google Ads, LinkedIn, GA4, CRM, or e-commerce data. This way, you build comprehensive cross-channel reports.
How do I use Windsor.ai’s Looker Studio templates?
Windsor.ai offers ready-made templates. Just make a copy of the required template, connect your data source via Windsor.ai, and launch dashboards with pre-built KPIs and visuals in minutes.
Can I create custom metrics and dimensions with Windsor?
Yes, you can define custom fields directly in Windsor.ai. Create calculated ROAS or blended CPA. Then push them into Looker Studio for customized reporting.
How is currency conversion handled by Windsor.ai?
Windsor.ai manages this for you. Our platform supports automatic multi-currency conversion. As a result, you report consistently across regions without manual adjustments.

