 AI insights
 About us
 Careers
 Security
 Customer reviews
 Contact us
 Affiliate program
 Solution partners
 Looker Studio templates
 Tableau templates
 Facebook Ads templates
 Google Ads templates
 Data fields & Metrics
 AI prompt library & Guides
 Product documentation
 API documentation
 Case studies
 Blog
Blog Data models
 Windsor vs Supermetrics
 Windsor vs Fivetran
 Windsor vs Portermetrics
 Last updated: 26 June 2026

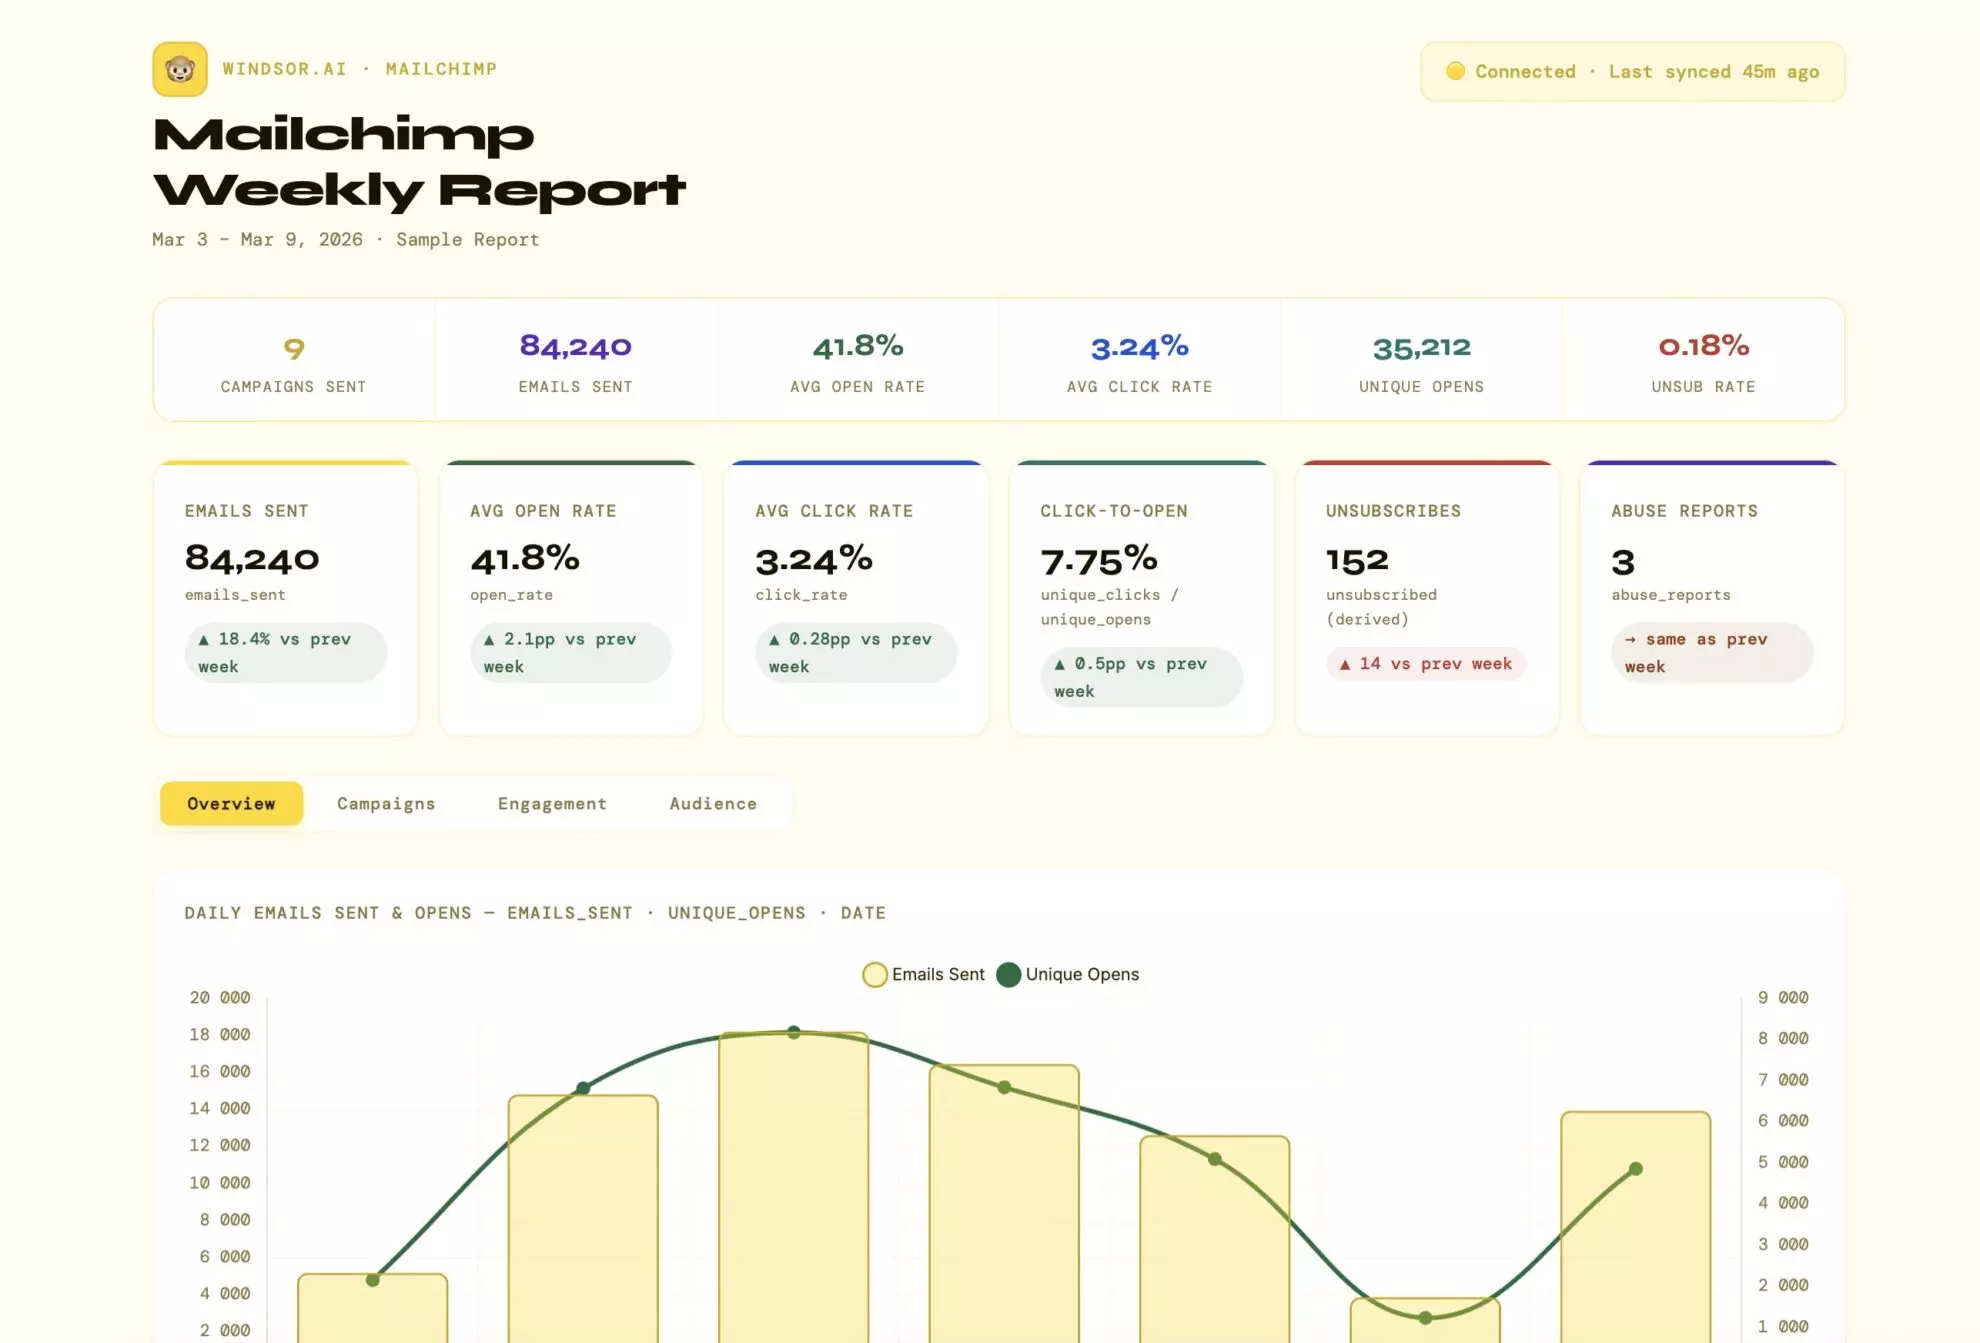
Mailchimp tells you what happened after each email campaign is sent by reporting the open rate, click rate, and unsubscribe rate.
But what it doesn’t show you is the bigger picture: whether your overall list engagement is growing or quietly decaying, which types of content consistently outperform others, which audience segments respond to what you send, and, most importantly, whether any of it actually drives revenue.
Getting those answers in Mailchimp means clicking through individual campaign reports, building comparison charts, combining Mailchimp stats with data from other channels in a spreadsheet, and piecing together all patterns manually. Most email marketers either skip the deep analysis or wait until a deliverability problem forces them to pay attention.
With Windsor MCP, you can automatically connect your Mailchimp account to Claude with no code. Your campaigns, lists, segments, automations, and subscriber activity become a unified dataset that you can analyze with AI in plain language.
🚀 Connect Mailchimp to Claude with Windsor MCP. Try it free for 30 days: onboard.windsor.ai/app/mailchimp.
Once connected, you can ask the questions that go beyond your native campaign reports:
- Which email content types — product updates, newsletters, promotions — consistently get the highest click rates?
- How has our average open rate trended over the last 6 months across all campaigns?
- Which subscriber segments have the highest engagement, and which are becoming unresponsive?
- Which automations have the best conversion rate from click to purchase?
- Which campaigns generated the most revenue, and what did they have in common?
You can also create visual summary reports on top of this data to quickly share performance trends with your team.
Learn how to stream Mailchimp data to Claude and blend it with metrics from your CRM, ad platforms, or social media via Windsor MCP in just a minute.
Let’s get started.
How to connect Mailchimp to Claude with Windsor MCP: 3 steps
Just three simple steps, no complex technical setup needed.
📖 Visit full documentation: How to Integrate Data into Claude with Windsor MCP.
Prerequisites
- A Windsor.ai account (free or paid subscription – from $19/month)
- A Mailchimp account (with access via API key)
- A Claude.ai account
Step 1. Connect Mailchimp to Windsor.ai
Go to onboard.windsor.ai/app/mailchimp and connect your Mailchimp account. You have to enter your account name and a secret API key.

Step 2. Install the Windsor.ai connector (Windsor MCP) in Claude
In Claude, open the Windsor.ai connector page and click Connect.
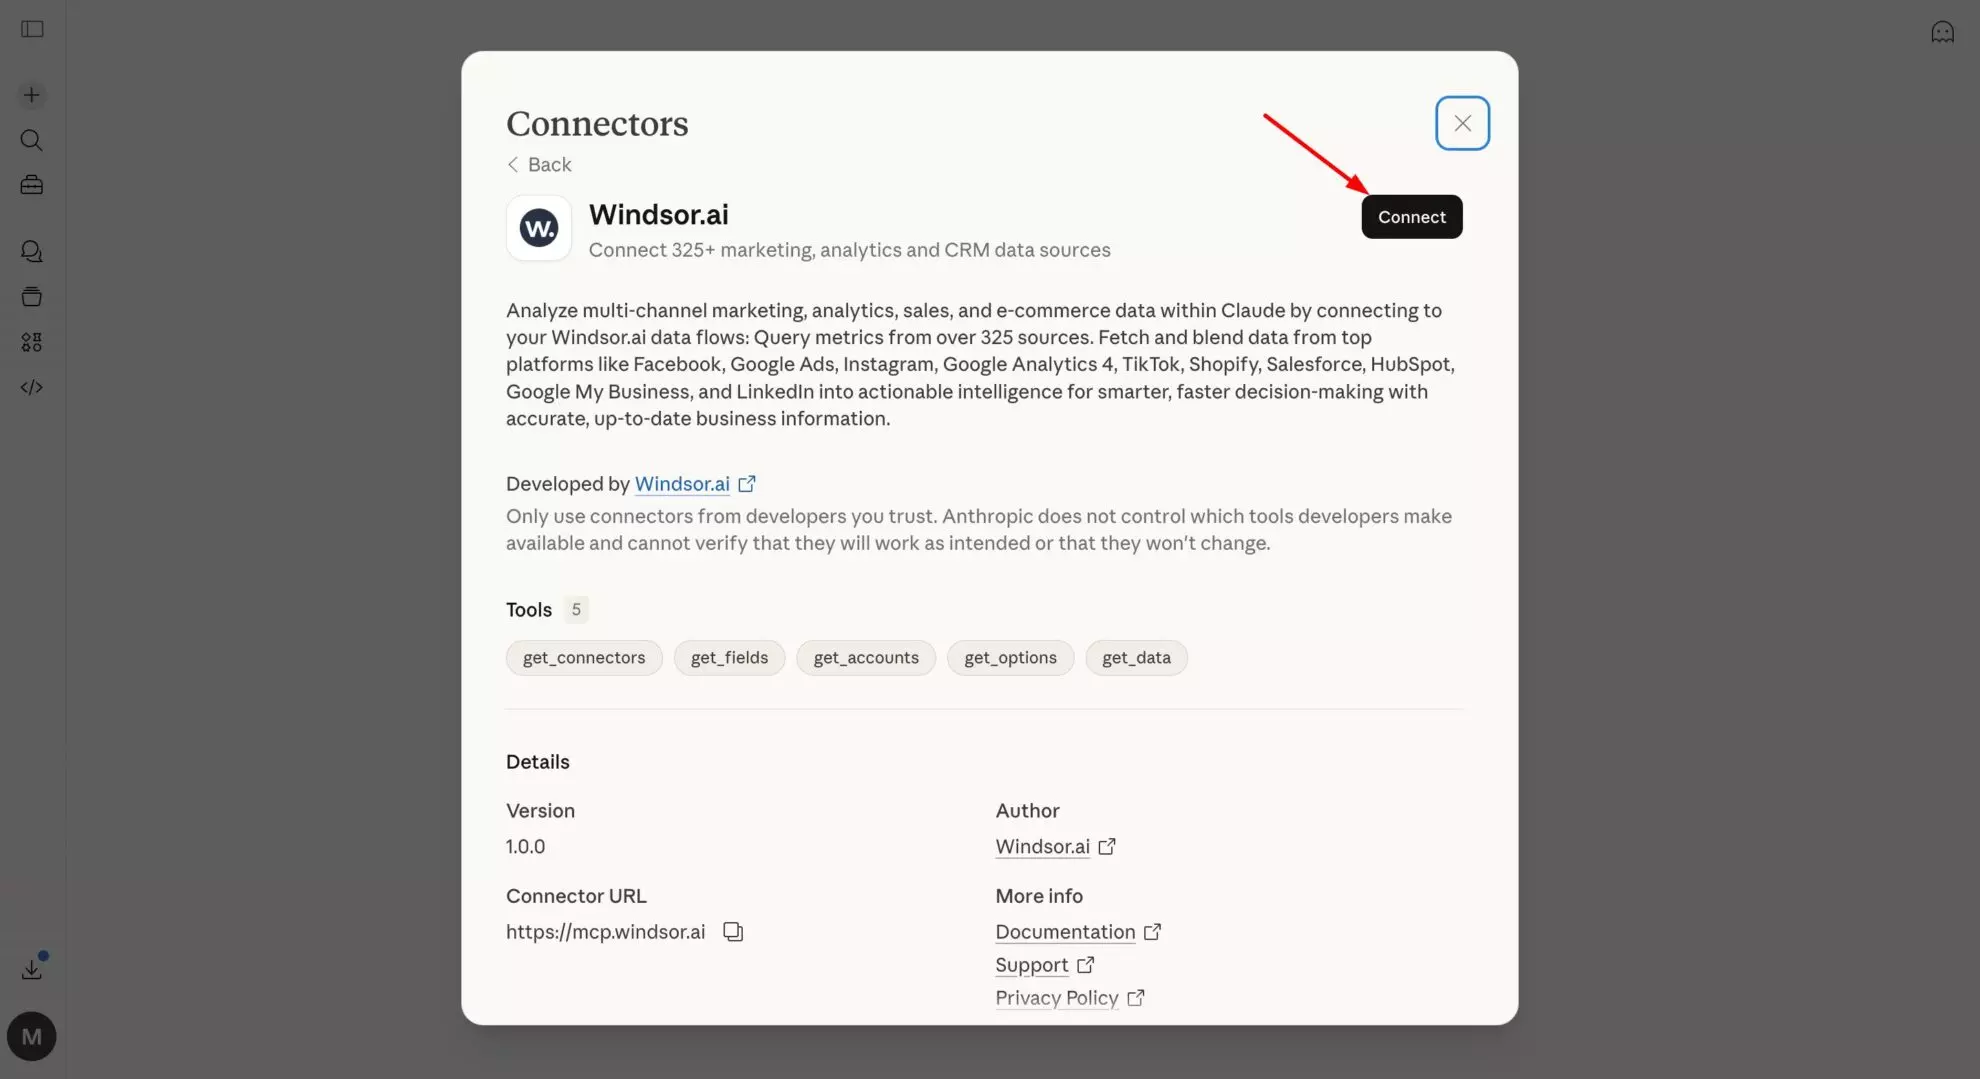
💡 Quick tip: Set permissions to “Always allow” so Claude can access your Windsor data across all conversations without asking each time.
Step 3. Start querying your data
Now that your Mailchimp account is connected to Claude, you can analyze campaign performance, audience behavior, and content effectiveness in plain language. Ask for actionable steps to improve engagement, conversions, and overall email ROI.
Sample prompts:
- Which subject lines generate the most opens across all campaigns?
- How does engagement vary by demographic or location?
- What are the best days and times to send emails for maximum open and click rates?
- Compare revenue per subscriber for different campaign types.
- Compare Mailchimp engagement with CRM data to identify high-value leads brought by email campaigns.
What you can do with Mailchimp data in Claude: Prompt ideas
1. Analyze campaign performance: see the patterns across all your sends
Mailchimp’s reports are built for reviewing one campaign at a time. Claude can analyze all of them together, surfacing what’s actually working across your entire sending history, not just last week’s newsletter.
Prompt for cross-campaign benchmarking: what your real averages look like
For all Mailchimp campaigns sent in the last 6 months, calculate:

- Average open rate, click rate, bounce rate, and unsubscribe rate
- The same metrics broken down by campaign_type (regular, automated, A/B test) and by send_time (morning vs. afternoon vs. evening)
- Top 5 campaigns by open rate and top 5 by click rate

What do your highest-performing campaigns have in common?
Are there patterns in subject line length, send day, or content type that correlate with above-average engagement?
Prompt for engagement trend analysis: is your list getting more or less responsive over time?
Using Mailchimp campaign report data, plot average open rate and click rate by month for the last 12 months (group campaigns by send month, calculate average metrics per month).

Is the trend improving, declining, or flat?
Which months had the sharpest drop in engagement?
Did those coincide with a particular campaign type or increased send frequency?

If open rates have declined more than 5 percentage points over the year, what is the most likely cause based on the data:
list growth without proportional engagement growth, increased send frequency, or declining click-to-open ratio?
Prompt for subject line analysis: what wording actually gets opened
For all campaigns in the last 12 months, analyze subject lines against open rates:
- Do subject lines containing emojis perform better or worse than average?
- Do subject lines under 40 characters outperform longer ones?
- Do personalized subject lines (containing *|FNAME|* merge tag) have higher open rates than non-personalized?
- Which specific words appear most often in your top-quartile campaigns  by open rate vs. our {bottom quartile}?

Summarise the subject line patterns that correlate most strongly with above-average open rates in this account.
2. Monitor list health: understand what’s really happening to your audience
A growing subscriber count is not the same as a growing engaged audience. Many Mailchimp lists have hundreds or thousands of subscribers who stopped opening emails months ago, dragging down deliverability, inflating costs, and distorting performance metrics.
Claude can surface that clearly.
Prompt for investigating audience engagement decay: who has gone quiet
Using Mailchimp member activity data, segment our audience by engagement recency:

- Active: opened or clicked at least one campaign in the last 90 days
- Cooling: last opened 90–180 days ago
- Cold: last opened 180–365 days ago
- Dormant: no opens in over 12 months

For each segment list: subscriber count, % of total list, and average open rate on the last 3 campaigns they received.
What % of our total list is dormant or cold?
If we removed dormant subscribers, how would our list-level open rate change? This gives us the true engaged audience size.
Prompt for estimating the list growth quality: are new subscribers actually engaging?
Using Mailchimp member data and campaign activity, for subscribers who joined in the last 6 months:

- What is their average open rate on campaigns received since joining?
- How does that compare to the open rate of subscribers who have been on the list for 12+ months?
- What % of new subscribers have never opened a single campaign?
- Which signup source (if tracked via merge tags or groups) produces the most engaged new subscribers?

If new subscribers are less engaged than long-term subscribers, that is a list quality signal — the acquisition source or welcome sequence may need attention.
Prompt for unsubscribe analysis: when and why people leave
Using Mailchimp unsubscribe and campaign data for the last 12 months:

- Which campaigns had the highest unsubscribe rate?
- Is there a pattern in send frequency — do unsubscribes spike after periods of higher-than-normal sending volume?
- What is the average unsubscribe rate by campaign type (promotional vs. content vs. transactional)?
- Which segments or tags have the highest unsubscribe rate?

Are there specific months where unsubscribes spiked?
What was sent that month?
Flag any campaign where unsubscribe rate was more than 1,5x the account average.
3. Perform audience segmentation: find who your most valuable subscribers are
Mailchimp segments let you send to specific subsets of your audience, but most users don’t have a clear view of which segments perform best across all campaigns.
Claude can compare segment behaviour across your entire sending history.
Prompt for segment performance comparison
Using Mailchimp campaign report data filtered by segment:

For each named segment we regularly send to, calculate across the last 6 months:
- Average open rate
- Average click rate
- Average click-to-open rate (CTOR) — this measures content relevance for people who did open
- Unsubscribe rate

Which segment has the highest CTOR? That's our most engaged, most content-relevant audience.
Which segment has high open rates but low CTOR — opening out of habit but not finding content compelling?
Which segments are showing declining engagement month-on-month?
Prompt for tag-based behaviour analysis
Using subscriber tag data and campaign activity:

For subscribers tagged as [your most important behavioural tags, e.g. 'purchased', 'trial_user', 'event_attendee', 'vip']:

- How does their open rate compare to untagged subscribers?
- What is their average click rate and CTOR?
- How long have they been on the list on average?

Which tag combination is associated with the highest lifetime engagement?
These subscribers are our email marketing core audience.

What content do they respond to most?
4. Analyze automations: diagnose your email sequences
Automations are where email marketing gets serious: welcome series, abandoned cart sequences, re-engagement flows, and post-purchase nurtures. Mailchimp shows you step-by-step stats, but not the patterns across all your active journeys.
Claude can review them holistically.
Prompt for evaluating welcome series performance: where new subscribers disengage
Using Mailchimp automation data for our welcome sequence:

For each email step in the welcome series, show:
- Send count
- Open rate
- Click rate
- Drop-off from the previous step (how many subscribers who received  step N also received step N+1, i.e., didn't unsubscribe)

At which step is drop-off highest?

Is there a step where click rate drops sharply even though open rate stays consistent — suggesting the content isn't landing even for engaged subscribers?

What is the overall completion rate (% who receive every step)?
Prompt for evaluating re-engagement flow effectiveness
For our re-engagement automation (targeting subscribers who haven't opened in 90+ days):

- How many subscribers entered the flow in the last 6 months?
- What % re-engaged (opened or clicked at least one email in the flow)?
- What % unsubscribed during the flow?
- What % remained unresponsive and were suppressed or cleaned?

Is the re-engagement flow recovering enough subscribers to justify keeping cold contacts on the list, or is it accelerating unsubscribes from contacts who were already decided?
Bonus: Blending Mailchimp with other data sources
Mailchimp’s data tells you about email engagement. The most valuable business questions, like whether email actually drives revenue, which subscribers become customers, and how email compares to other acquisition channels, require combining it with data from your store, CRM, or ad platforms.
🔗 Windsor MCP lets you blend data from 350+ sources in a single Claude conversation, automatically normalizing and joining all conventions, so you can perform deep cross-channel analysis and gain insights without switching between tools or spending hours on spreadsheets.
Here are some common scenarios you can try:
- Mailchimp + WooCommerce or Shopify: The most powerful email marketing question: which campaigns and automations actually drove purchases? If you use Mailchimp’s e-commerce integration, Claude can join campaign sends to order data and show revenue per campaign, average order value of email-driven customers, and which product categories email converts best.
- Mailchimp + Google Analytics 4: Mailchimp tells you who clicked. GA4 tells you what they did next. Connect both and ask Claude to show post-click behaviour by campaign: bounce rate, pages per session, goal completion, so you can see whether your landing pages are holding up after the email does its job.
- Mailchimp + Salesforce or HubSpot: For B2B teams, email subscribers and CRM contacts overlap but aren’t the same thing. Connect both and identify which Mailchimp subscribers are active pipeline contacts, which are customers, and which are cold leads who never converted. Let Claude show you which campaign types move subscribers from list members to pipeline opportunities.
- Mailchimp + Google Ads or Meta Ads: Compare the cost and quality of email-acquired customers against paid-acquired customers. Which channel produces subscribers with higher long-term engagement? Which produces customers with higher LTV? Connect ad spend data and Mailchimp subscriber history to find out.
- Mailchimp + Stripe: Build a true email revenue attribution model. Match Mailchimp campaign send dates against purchase dates using email address as the join key, apply a 7-day attribution window, and ask Claude to calculate revenue per send, revenue per subscriber per campaign type, and the incremental revenue lift of your automation sequences.
What Mailchimp data Windsor makes available in Claude
Windsor connects to Mailchimp’s API and gives Claude access to essential reporting and audience data. See the full list of available data fields.
The most commonly used Mailchimp fields in Claude analysis
campaign_title,campaign_type,send_time,subject_lineemails_sent,open_rate,click_rate,bounce_rate,unsubscribed,unsubscribe_countunique_opens,unique_clicks,unique_subscriber_clickslist_id,list_name,member_count,list_total_contactsdate,day_of_month,week_day,month,year
What Claude can analyze with this data
Campaigns
- Compare subject lines, send times, and campaign types (regular, automation, RSS, A/B test).
- Identify trends across campaigns, like top-performing content or campaigns with high bounce or unsubscribe rates.
Campaign reports
- Open rate, click rate, bounce rate, unsubscribe rate, forwards, soft/hard bounces.
- Track total emails sent, total opens/clicks, and unique opens/clicks.
Lists & audiences
- Audience growth, member count, list health, subscription/unsubscription trends.
- Key list info: list name, ID, status, total contacts, marketing permissions, and double opt-in setting.
Members & subscribers
- Aggregate-level engagement metrics: total unsubscribes, cleaned members, subscription rate.
- Track last subscribe/unsubscribe timestamps.
URLs & links
Performance of links in campaigns: total clicks, unique clicks, last click, and click percentage.
Time & delivery
Send time, RSS last send, campaign date, day/week/month/year breakdowns for engagement analysis.
Conclusion
Mailchimp holds a detailed record of every email your audience has received, opened, clicked, or ignored. The challenge is that its reporting is built for one campaign at a time, not for the strategic questions that really matter: Is our list becoming more or less engaged? Which content types drive revenue? Which segments are worth investing in?
Windsor MCP gives Claude live access to your Mailchimp data across every campaign, audience, and subject line — all at once. Analysis that once required a spreadsheet and hours of manual work now takes just a 1-minute setup and deep conversation in natural language.
And when you combine it with your store, CRM, or ad data, email stops being a channel you manage by guesswork and starts being one you manage by evidence.
🚀 Start making data-driven decisions! Connect Mailchimp to Claude with Windsor MCP in less than 60 seconds → onboard.windsor.ai/app/mailchimp.
FAQs
What are the ways to connect Mailchimp to Claude?
You can choose from these options:
- Windsor MCP (recommended): No-code. Connect your Mailchimp account at onboard.windsor.ai via Mailchimp’s API key, then add Windsor as a connector in Claude. Live data, works immediately — no code required.
- Manual export: Export individual Mailchimp reports as CSV and upload to Claude. Works for one-off analysis, but you lose cross-campaign comparison and any blending with other sources.
What is the easiest way to connect Mailchimp to Claude?
Windsor MCP is the easiest and fastest Mailchimp to Claude integration method. Just connect your Mailchimp account to Windsor.ai and add Windsor as a connector in Claude’s settings. Your Mailchimp data is live in every Claude conversation from that point on — no exports, no API configuration, no ongoing maintenance.
Does Windsor need any special Mailchimp permissions to connect?
No. Windsor uses your standard Mailchimp API key to access campaign, list, and subscriber data for analysis in Claude.
Can Claude analyze data from multiple Mailchimp audiences (lists)?
Yes. If your Mailchimp account has multiple audiences, Windsor makes all of them available to Claude. You can analyse each audience independently or compare engagement metrics across audiences in a single prompt.
Can I blend Mailchimp data with my e-commerce store or CRM?
Yes, and this is where Windsor MCP gets extremely useful. Connect Mailchimp alongside your WooCommerce or Shopify store, your CRM (Salesforce, HubSpot), or your ad platforms (Google Ads, Meta Ads) in Windsor. Claude can then access them all through the same Windsor MCP connector, letting you answer questions like which campaigns drove actual purchases, which subscribers are active customers, and how email-acquired customers compare in LTV to paid-acquired ones.
Will connecting Windsor affect my Mailchimp sending or billing?
No. Connecting Windsor doesn’t trigger sends, change settings, or affect your Mailchimp plan; your subscriber count, sending volume, and billing stay exactly as they are.
Does Mailchimp e-commerce revenue data require any special setup?
Mailchimp’s e-commerce revenue data (revenue per campaign, orders driven by email) is only available if you have Mailchimp’s e-commerce tracking active — either through Mailchimp’s native Shopify or WooCommerce integration, or via a custom API integration that sends order data back to Mailchimp. Bending Mailchimp with your store data via Windsor is the most optimal way to build revenue attribution.
What Mailchimp data fields can I send to Claude via Windsor MCP?
Windsor provides access to the core Mailchimp campaign and list data, including fields like campaign_title, campaign_type, send_time, subject_line, emails_sent, open_rate, click_rate, bounce_rate, unique_opens, unique_clicks, and list_name. It also includes link-level metrics such as url, url_total_clicks, and url_unique_clicks. Explore the full list of supported fields here.
Can I analyze subject lines and send times?
Yes. Fields like subject_line, send_time, and campaign_type allow you to compare performance across campaigns and identify what messaging and timing work best.
Is the data I query in Claude live or static?
The data is live and automatically updated. Every query in Claude reflects the latest available Mailchimp data; no repetitive exports or manual refresh needed.
Do I need to select fields manually?
No. Windsor handles field selection and normalization automatically. You can simply ask questions in plain language, and Claude will use the relevant fields behind the scenes.
Is it secure to connect Mailchimp to Claude with Windsor?
Yes. Windsor is SOC 2 compliant and connects to Mailchimp over an encrypted API key connection that you can revoke from Mailchimp anytime. Your data isn’t shared with third parties or used to train AI models.

