 AI insights
 About us
 Careers
 Security
 Customer reviews
 Contact us
 Affiliate program
 Solution partners
 Looker Studio templates
 Tableau templates
 Facebook Ads templates
 Google Ads templates
 Data fields & Metrics
 AI prompt library & Guides
 Product documentation
 API documentation
 Case studies
 Blog
Blog Data models
 Windsor vs Supermetrics
 Windsor vs Fivetran
 Windsor vs Portermetrics
 Last updated: 7 July 2026

Instagram Insights works well for quick performance checks within a single account. It shows essential metrics like likes, reach, and follower growth in a simple interface. But once reporting needs grow and involve multiple accounts, deeper analysis, or historical comparisons, native Instagram analytics quickly become limiting.
Teams managing several Instagram profiles or comparing organic and paid performance often find the in-app analytics slow, fragmented, and restrictive. Access to historical data is limited (to the last 90 days), and manual checks don’t scale.
Looker Studio solves these gaps by bringing Instagram data into a centralized, shareable dashboard that updates automatically. Instead of manually checking metrics in the app, teams work from a single source of truth. Reports refresh on a schedule, are easy to share with stakeholders, and remain consistent over time.
Looker Studio also enables cross-channel analysis by blending Instagram data with platforms like Facebook Ads, Google Ads, TikTok, LinkedIn, and more.
So, how do you import Instagram data into Looker Studio? This guide covers three common approaches:
Method 1. Fully automated via third-party connectors like Windsor.ai
Method 2. Manual exports with Google Sheets as an intermediary
Method 3. Direct integration using the Instagram Graph API
Read on to compare the pros and cons of each method and choose the best option based on your reporting needs and technical resources.
3 methods to connect Instagram to Looker Studio
When it comes to connecting Instagram to Looker Studio, automated connectors are the fastest and easiest option. They eliminate manual work, ensure data consistency, and scale effectively, which is essential for teams or agencies managing multiple Instagram accounts.
Manual exports and direct API integrations serve more limited use cases. Manual exports may work for one-off reports or basic insights, but they quickly become time-consuming, error-prone, and outdated. In turn, API-based integrations offer full control over the data but require complex setup, ongoing maintenance, and technical expertise.
⚙️ “For most teams, full automation strikes the best balance between speed, reliability, and effort—saving time and reducing reporting overhead. That’s how you can save up to 40 hours per week, equivalent to a full-time analyst, by eliminating manual CSV exports and App Script maintenance,” says Matthias Kraaz, COO of Windsor.ai.
Let’s break down each method in detail, so you can make a more informed decision.
Method 1. Fully automated integration via Windsor.ai native connector
Windsor.ai provides a no-code Instagram Looker Studio connector that handles all stages of data integration under the hood. You connect your Instagram account(s) to Looker once, and data flows into the auto-refreshing dashboard on its own. Reporting becomes automated and low effort.
🚀 With Windsor.ai’s native Looker Studio connectors, you can set up stable, auto-refreshing data pipelines and data blending in under three minutes, with no code or maintenance required.
Key features of the Windsor.ai connector:
- Automated Instagram reporting
Data syncs and refreshes automatically, keeping your dashboards up to date without CSV downloads or manual updates. Each refresh preserves a stable data structure.
- Multi-account support
Sync multiple Instagram accounts in a single setup. Whether you manage a few profiles or hundreds, all accounts can live in one unified view, making comparisons faster and easier.
- Cross-channel data blending
Combine Instagram data with other platforms such as GA4, TikTok, LinkedIn, and more in a single Looker Studio report. This enables true cross-channel performance analysis instead of siloed reporting.
- Extended historical data access
Go beyond the native app’s historical limits (often 30–90 days) and analyze long-term performance trends over months or years.
Pros of this method:
- Fast setup: Connect Instagram to Looker Studio and start importing data in under three minutes, with no complex technical configuration.
- Easy account onboarding: Add new Instagram accounts to existing or new Looker Studio dashboards in just a few clicks, which is ideal for agencies and growing teams.
- Flexible data selection: Use a field-level query builder to select only the metrics and dimensions you need (from 100+ available Instagram fields).
- Wide connector support: Blend Instagram data with 325+ other data sources in the same reporting setup.
- Scheduled refreshes: Keep dashboards current with daily or hourly updates.
- Pre-built templates: Get started instantly using a library of free, ready-made Looker Studio templates.
Cons of this method:
- Subscription required: This setup requires a Windsor.ai account with an active subscription, though a Forever Free plan is available for small or limited reporting needs.
- Third-party connector dependency: Data is delivered through Windsor.ai rather than directly from Instagram’s API, which may matter for teams with strict in-house tooling policies.
How to import Instagram data into Looker Studio with Windsor.ai: steps
Step 1. Log in to Windsor.ai
Start free and log in to your Windsor.ai account.
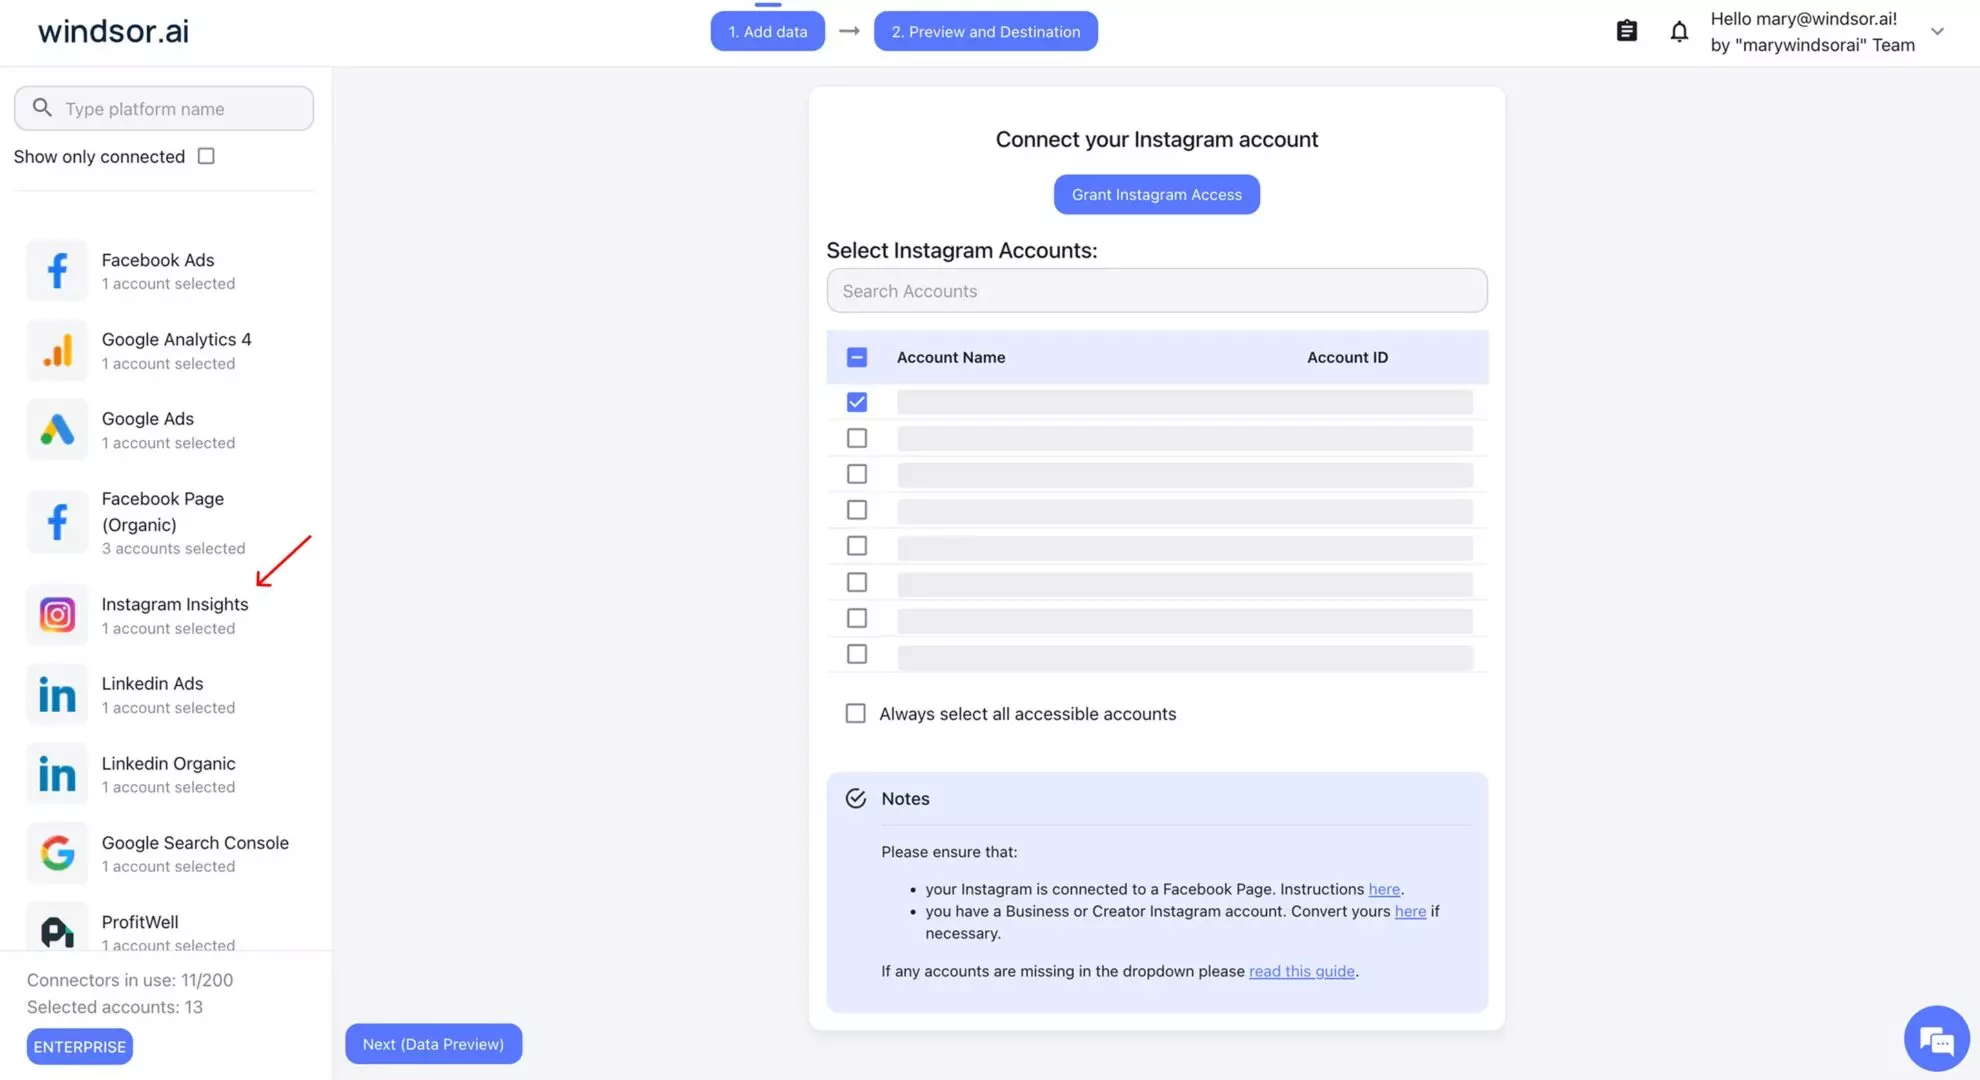
Step 2. Connect your Instagram account(s)
Choose Instagram Insights from the list of connectors in the left-hand panel and grant access through Meta authentication.
You’ll see all available Instagram account(s) under your Meta account. Select only the one(s) from which you want to pull data.
Step 3. Customize your dataset before export
In the right-side panel, you have access to query settings. Select the desired reporting date range and the fields that matter (reach, impressions, saves, followers, etc.) instead of loading all the available metrics and dimensions from the API.
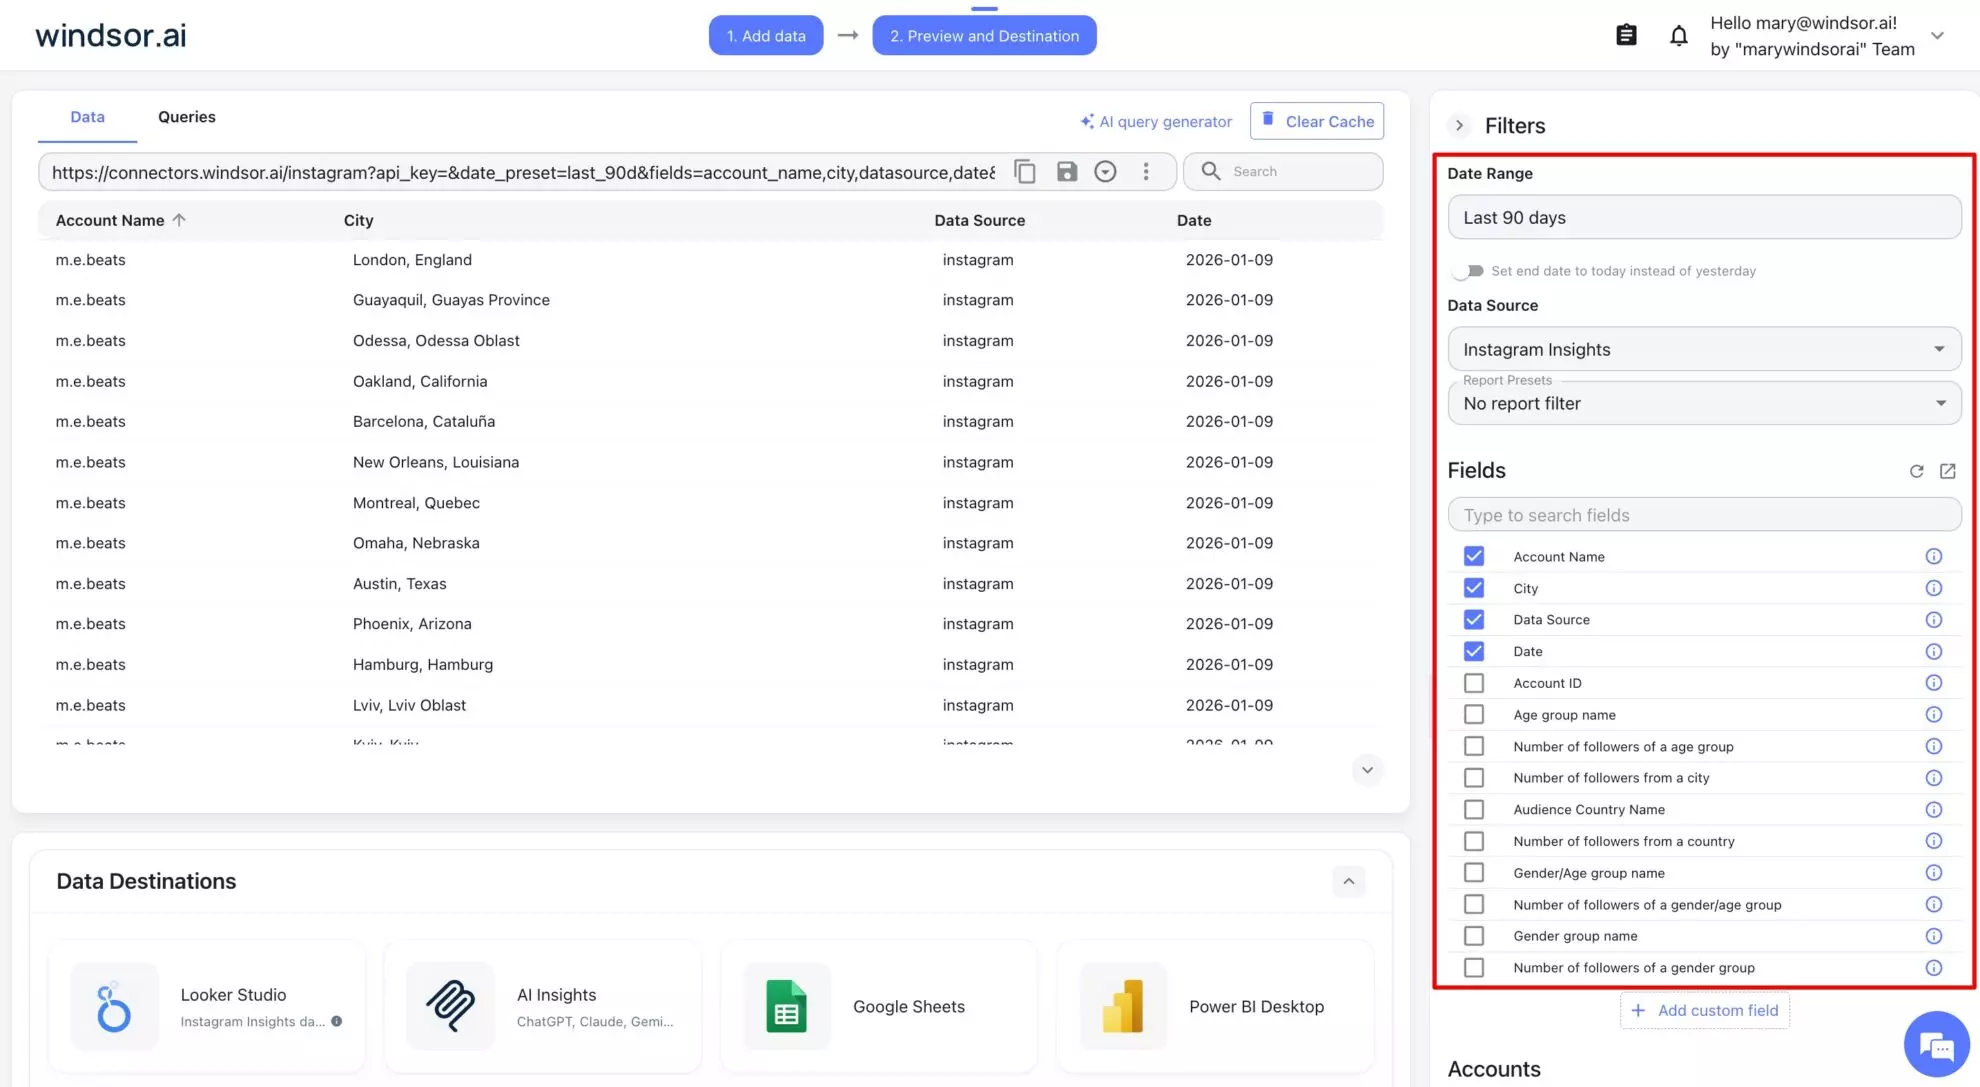
Double-check that you’ve selected the correct accounts and data source (Instagram or Blended Data for cross-channel data upload).
You can optionally apply advanced filters to go deeper with dataset segmentation.
When all settings are selected, preview your data in the table to ensure everything matches.
Step 4. Select Looker Studio as your data destination
Scroll down to the Data Destinations section and click on Looker Studio.
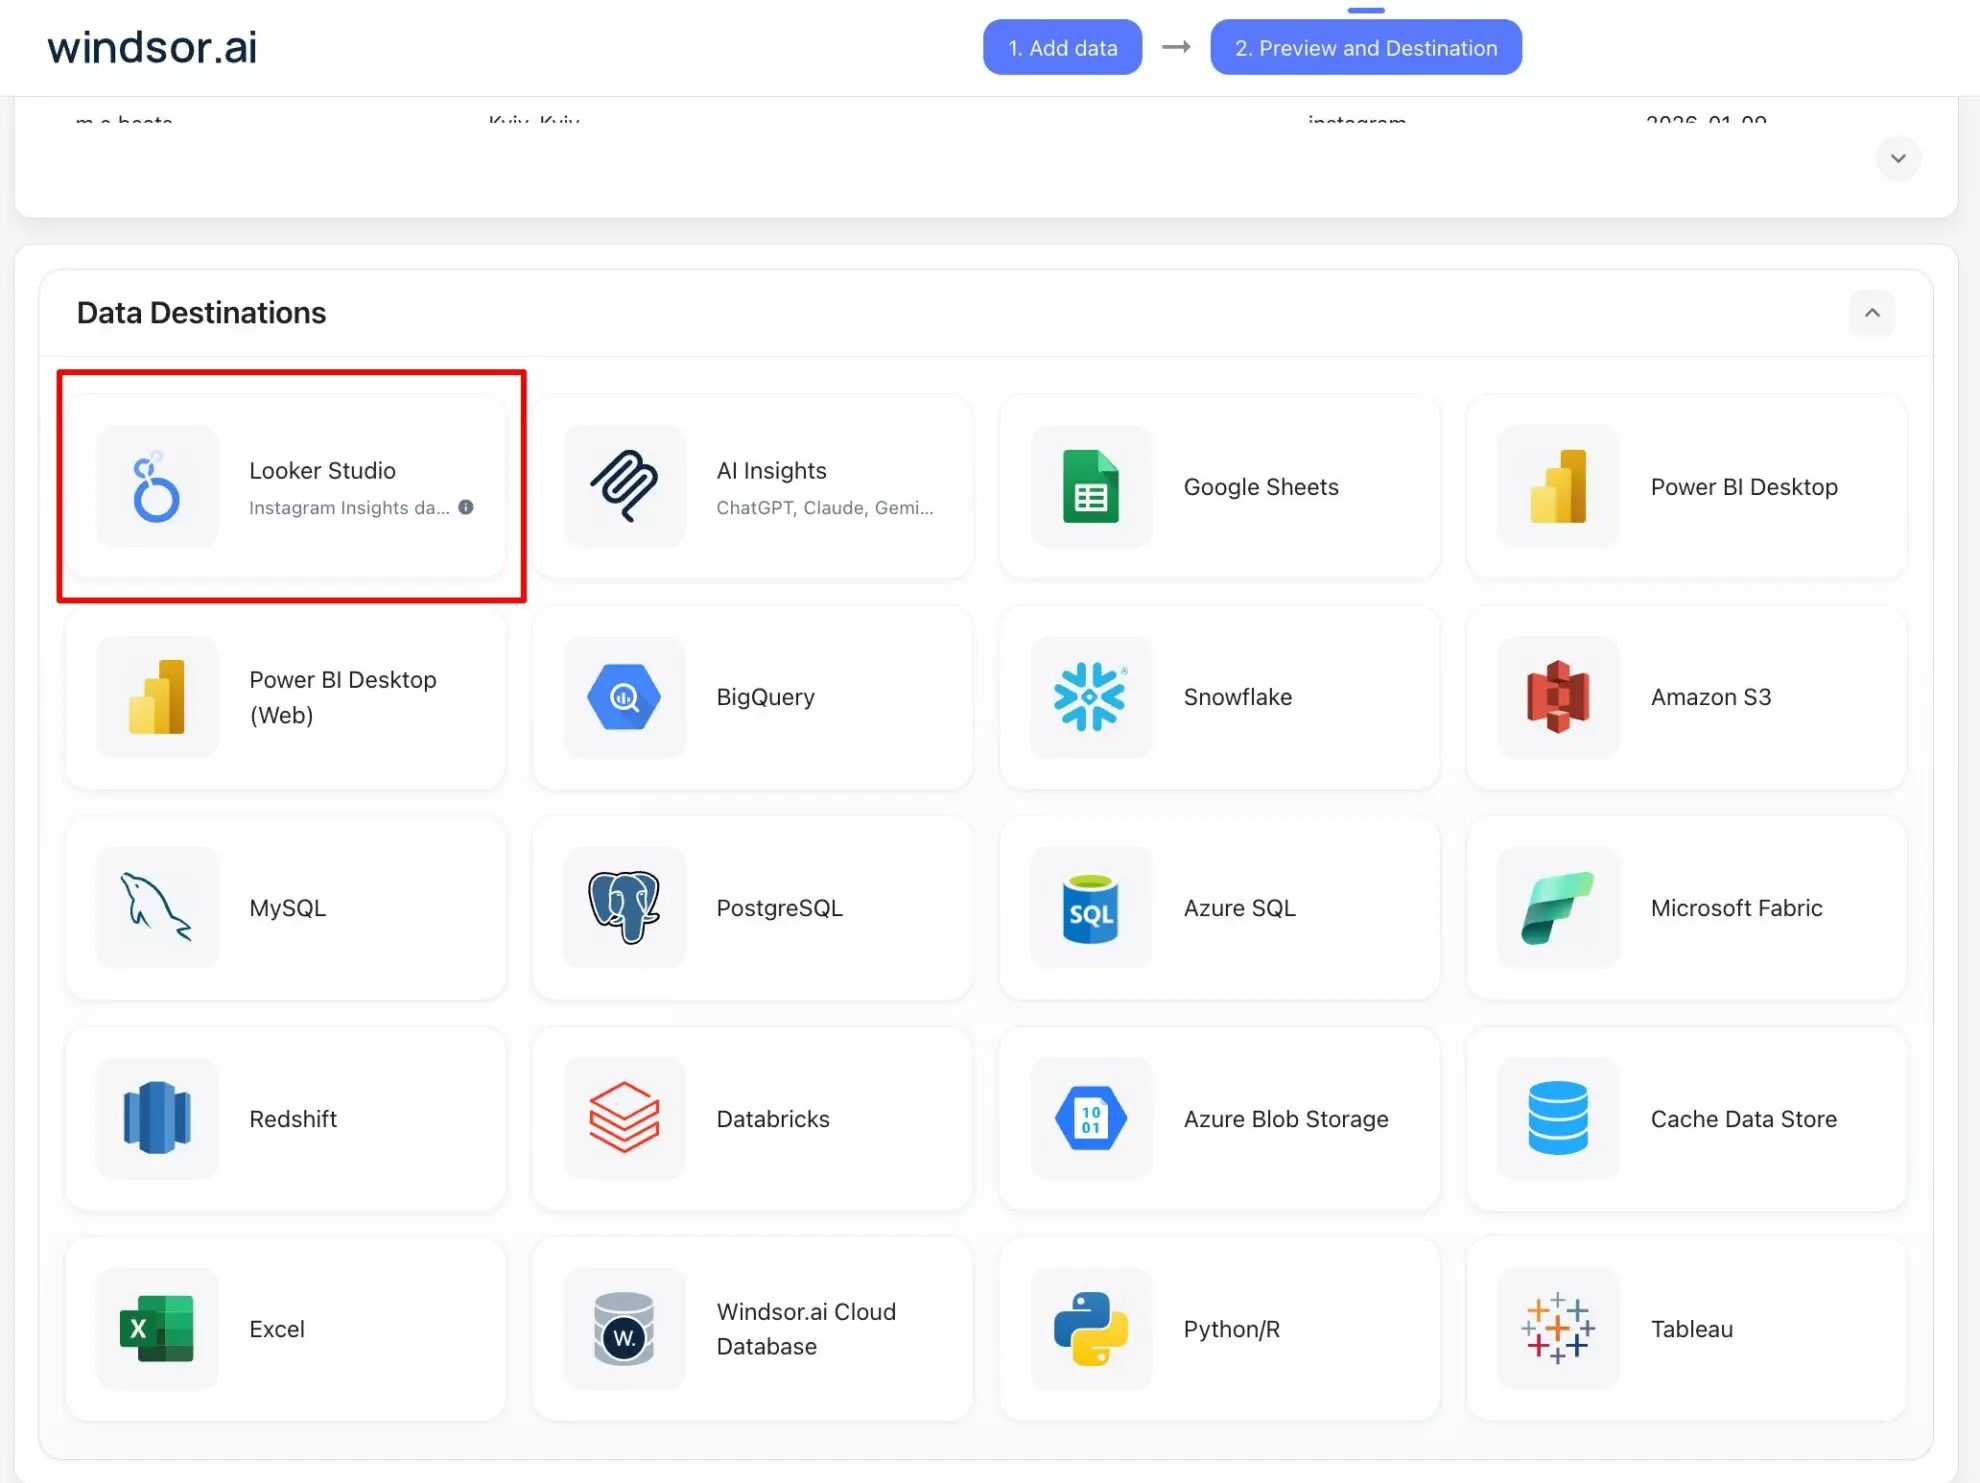
You’ll be redirected to Looker Studio for setting up Windsor.ai’s Instagram Insights connector.
Select the account and authorize access. When completed, click Connect.

💡 Pro tip: Enable the ‘Use report template for new reports’ option to visualize your data in the pre-built dashboard instead of creating charts from scratch.
Finalize data integration by clicking on Create Report.

This opens a pre-designed dashboard with your connected data. Feel free to customize it further to your needs (start by adjusting a date range).

That’s it. You’ve successfully integrated your Instagram Insights data into an auto-updating Looker Studio dashboard using the Windsor.ai native connector.
Method 2. Manual export + Google Sheets connector
This is a free way to integrate Instagram data into Looker Studio, which works fine for one-time reports for a single account. Updates happen only when you export data by repeating this flow.
Pros of this method:
- No cost: It’s completely free to use and easy to access method. You don’t need any extra tools or a subscription.
- Simple setup: It’s suitable for quick, one-time performance checks and can be helpful for beginners to understand basic reporting flow.
Cons of this method:
- No automated updates: Data stays current only in the moment when it lands in Looker Studio. In a short while, it becomes outdated, and you have to repeat this manual export every time you need to have fresh data.
- Limited scalability: Managing multiple accounts or frequent updates becomes time-consuming and impractical.
- Restricted historical access: Historical data is limited to the Instagram API, specifically to what’s available in the Instagram interface at export time.
- Higher error risk: Manual exports can lead to broken schemas, missing rows, or inconsistent data over time.
How to sync Instagram data to Looker Studio manually: steps
Step 1. Export data from Meta Business Suite
Open Meta Business Suite and navigate to Insights. Select Content, set your date range, and then export the data as a CSV file.
This file contains raw Instagram metrics that reflect performance at the time of export.
Step 2. Format the data in Google Sheets
Upload the CSV file to Google Sheets. Clean up the columns, standardize date formats, and verify that all data appears correct before uploading it to Looker Studio.
Step 3. Connect the data to Looker Studio
Use the native Google Sheets connector to connect your spreadsheet to Looker Studio.

Authorize your account, complete data integration, and build charts manually within the report. Keep in mind that this setup does not support automated data updates further.
Method 3. Using the Instagram Graph API
This approach is designed primarily for developers and data engineers. It requires a technical setup, engineering expertise, and ongoing maintenance. You interact directly with the Meta API, maintain full control over the data pipeline, and can implement custom logic tailored to specific reporting needs.
Pros of this method:
- Full data control: You define which metrics to collect, how often to refresh data, and how the schema is structured.
- Custom logic and transformations: Advanced calculations, filtering, blending, and enrichment can be applied before data reaches Looker Studio.
- Scalable architecture: Well-designed pipelines can support large volumes of data and multiple accounts.
- Near real-time updates: Data can refresh in near-real-time, depending on API limits and infrastructure.
- No manual exports: Once set up, data flows automatically into reporting tools.
Cons of this method:
- Token expiration and authentication issues: Access tokens expire regularly and must be renewed. Authentication failures can interrupt data flow without warning, causing dashboards to break and increasing operational risk.
- Development and ongoing maintenance: Engineering resources are required from the start. Debugging, monitoring, and fixing pipelines become part of routine reporting work, increasing long-term costs.
- Inaccessible for small or non-technical teams: This method is best suited for teams with in-house developers who can manage API complexity and infrastructure maintenance.
How to connect Instagram to Looker Studio via API: steps
Step 1. Create a Meta app
Create a Meta developer app and register as a Meta developer (required). Generate an access token and request the necessary permissions before accessing data.
Approval depends on account type and intended usage. Business and Creator accounts offer broader access, while Personal accounts have limited capabilities.
Step 2. Create API requests
After app creation, send requests to the Instagram Graph API to retrieve post- and account-level insights. Responses are returned in JSON format.
You can request metrics such as impressions, reach, and engagement, but all requests must follow Meta’s API structure.
Remember that rate limits apply to each request, and excessive calls may fail silently, making efficient querying essential.
Step 3. Store and normalize data
Store API responses in a database (BigQuery is a common choice, though other SQL-based databases also work well).
Raw JSON data must be cleaned, normalized, and transformed. Date fields and metrics must align correctly.
This step directly impacts reporting quality: poor data structure leads to broken dashboards, while clean schemas scale efficiently.
Step 4. Connect data to Looker Studio
Connect Looker Studio to your database using the BigQuery or database connector. No manual uploads are required.
Dashboards pull from stored tables, and updates reflect newly ingested API data, creating a complete Instagram reporting pipeline with automated refreshes.
Comparison of Instagram to Looker Studio integration methods
Each method serves a specific use case and need. There is no universal answer.
The best choice depends on how often you need updates and how much effort you want to put in.
| Feature | Windsor.ai connector | Manual export via Sheets | Instagram API |
| Setup effort | Very easy | Moderate | High |
| Automation | Fully automated | None | Fully automated |
| Data freshness | Hourly or daily | Static | Near-real-time |
| Scalability | High | Low | High |
| Best for | Agencies, large teams | One-off reports | Dev teams |
Why connect Instagram to Looker Studio
Connecting Instagram to Looker Studio puts all your performance data in one place. Teams can effectively analyze Instagram KPIs through clear charts. Live dashboards replace static reports and resolve manual reporting gaps. With shared links and always fresh data, trust and decision-making improve across teams.
The main benefits of syncing Instagram with Looker Studio include:
Centralized social media reporting
Data centralization improves visibility across your entire marketing stack. You see the performance of all channels together instead of jumping between tools. Context becomes clearer when Instagram insights sit next to other platforms. Patterns and relations across channels become easier to spot and explain.
Automated reporting
The setup via Windsor.ai or API reduces reporting gaps and brings in ultimate automation. Teams stop waiting time on manual exports and switching between dashboards. Analysis becomes faster, more consistent, and always relies on the latest data.
Visualization of KPIs
Performance becomes much clearer when Instagram KPIs are visualized in Looker Studio. Metrics such as follower growth and post reactions stand out immediately, without extra effort.
Maps show where your audience is located, while heatmaps highlight geographic engagement patterns. You can quickly identify where engagement is coming from and how it varies by region.
Visual charts replace raw tables, making insights easier to understand and act on. Decision-making becomes fully data-driven; no guesswork, just clear visual evidence.
Client transparency
Sharing editable dashboards improves transparency with clients. Clients can view the latest numbers or conduct regular performance checks anytime they want without the need to wait for updates.
🎁 Bonus: Jump-start with Windsor.ai’s free Instagram template
🔗 Template link: https://windsor.ai/data-studio-instagram-insights-overview-report/.
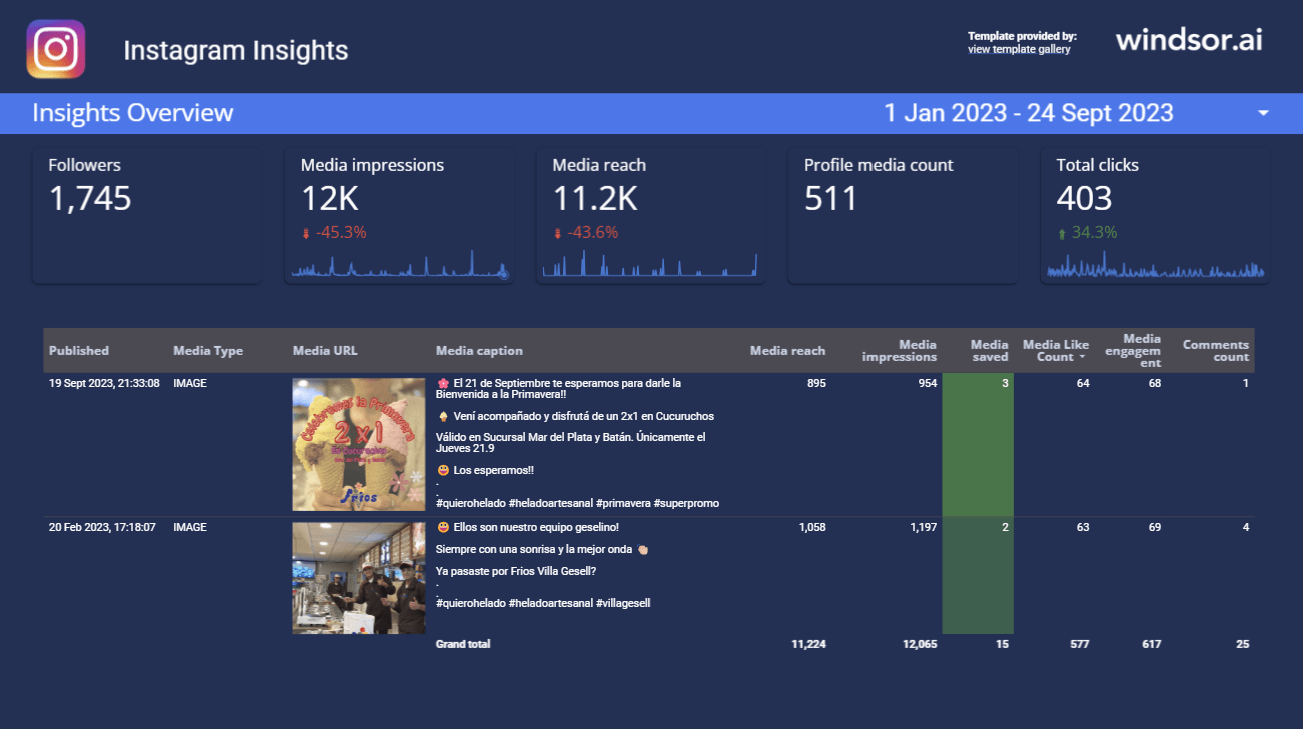
This Instagram Looker Studio template from Windsor.ai makes dashboard setup fast and effortless. Simply connect your own Instagram data and start visualizing essential Instagram KPIs within seconds.
Audience growth, content performance, and engagement metrics become instantly visible and refresh automatically based on your schedule; no manual work or complex configurations required.
How to use this template:
Step 1. Connect your data to the template
Open the template and click Use my own data.
Step 2. Select your account
Windsor.ai Instagram Insights connector will request you to select the account from which you want to pull data.
When selected, click Add and give your permission to Add to report.
The dashboard will automatically populate with your data.
Conclusion
Looker Studio helps transform raw Instagram metrics into a clear optimization strategy, but everything depends on how reliably your Instagram data is imported.
Manual exports work for learning, one-off checks, or quick performance snapshots. However, they quickly become inefficient when reporting needs grow, refresh frequency increases, or dashboards are shared with clients or stakeholders.
Automated pipelines, whether through API-based setups or connectors like Windsor.ai, change how teams work with data. Reports stay continuously updated without repetitive exports or manual intervention, and everyone works from a single, consistent source of truth.
When scale, accuracy, and efficiency matter, automation becomes the only sustainable path. Windsor.ai removes technical complexity without adding engineering overhead, making advanced Instagram reporting accessible to any team.
🚀 Automate your Instagram reports in Looker Studio with Windsor.ai in less than 3 minutes: https://onboard.windsor.ai/app/instagram.
FAQs
How do I automatically connect Instagram to Looker Studio?
Use an automated connector like Windsor.ai. It pulls data without manual exports or custom scripts. Reports refresh on your preferred schedule, daily or hourly. This is the easiest and fastest way to connect Instagram to Looker Studio with no code or maintenance required.
Is the Instagram to Looker Studio setup via Windsor.ai suitable for client reporting?
Absolutely. Our automated dashboards ensure clients always see the latest data and eliminate repetitive export, upload, and cleansing workflows.
Can I connect Instagram directly to Looker Studio without third-party tools?
Not natively. Looker Studio does not offer a built-in Instagram connector. You must either upload data manually, build an API pipeline, or use a third-party connector.
Which Instagram metrics can be sent to Looker Studio?
Reach, impressions, and engagement metrics, as well as follower growth and post-level insights, are supported.
How do I schedule automatic refreshes in Looker Studio?
Third-party connectors offer built-in scheduling, so Looker Studio refreshes your data based on source settings.
When using the Instagram Graph API method suitable?
The API method is best for teams with developers or data engineers on board. It offers maximum control and flexibility but requires setup, maintenance, token management, and monitoring.
Can I load historical Instagram data (more than 90 days)?
Yes, it depends on the connector you use. Manual exports only give you a short data window restricted by the Instagram API. Automated tools go beyond that limit and allow you to retrieve years of data. As a result, you can evaluate long-term trends and conduct YoY comparisons.
Is data import into Looker via Google Sheets reliable for Instagram reporting?
This method works for small, static reports, but often breaks and causes errors under frequent updates.
Can I combine Instagram data with other platforms in Looker Studio?
Yes, Looker Studio supports data blending. You can use the Windsor.ai Blended connector to merge Instagram, Facebook, GA4, or ads data and see performance across all channels in one place.
How long does it take to set up an automated Instagram dashboard?
With Windsor.ai, setup typically takes less than three minutes, from connection to a fully populated Looker Studio dashboard.
How can I build an insightful Looker dashboard using Instagram metrics?
Start with basic charts. Choose metrics like reach and engagement. Use filters for deeper segments. Pre-built templates speed this up significantly.

