 Destinations
 Data sources
 AI insights
 About us
 Careers
 Security
 Customer reviews
 Contact us
 Affiliate program
 Solution partners
 Template gallery
 Looker Studio templates
 Power BI templates
 Excel templates
 Google Sheets templates
 Tableau templates
 Facebook Ads templates
 Google Ads templates
 Data fields & Metrics
 AI prompt library & Guides
 Product documentation
 API documentation
 Case studies
 Blog
Blog Data models
 Windsor vs Supermetrics
 Windsor vs Funnel.io
 Windsor vs Fivetran
 Windsor vs Rivery
 Windsor vs Portermetrics
 Windsor vs Coupler.io
 Last updated: 1 September 2026




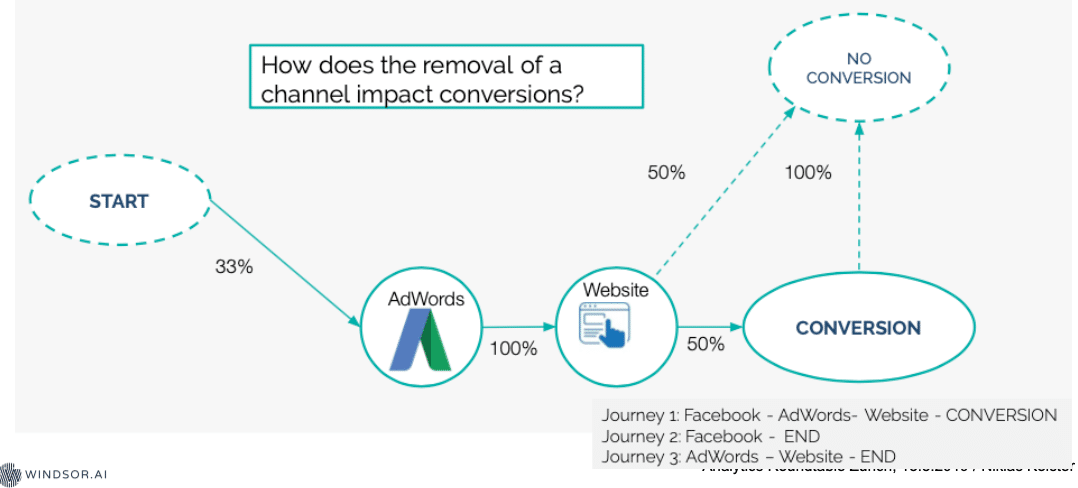
Shapley value and Markov models are the two methods behind most data-driven attribution. Shapley value averages a channel’s contribution across every possible combination it could appear in. Markov models use the transition probabilities actually observed between steps in the journey, and measure a channel by what conversions disappear when you remove it, the removal effect.
Shapley is the more theoretically complete of the two; Markov scales better and is easier to explain to stakeholders. Below is how each one works, with a worked example.
We take a look at the two data driven attribution models used in marketing.
- Shapley value
- Markov Model
Illustration of the Shapley Value by Google:
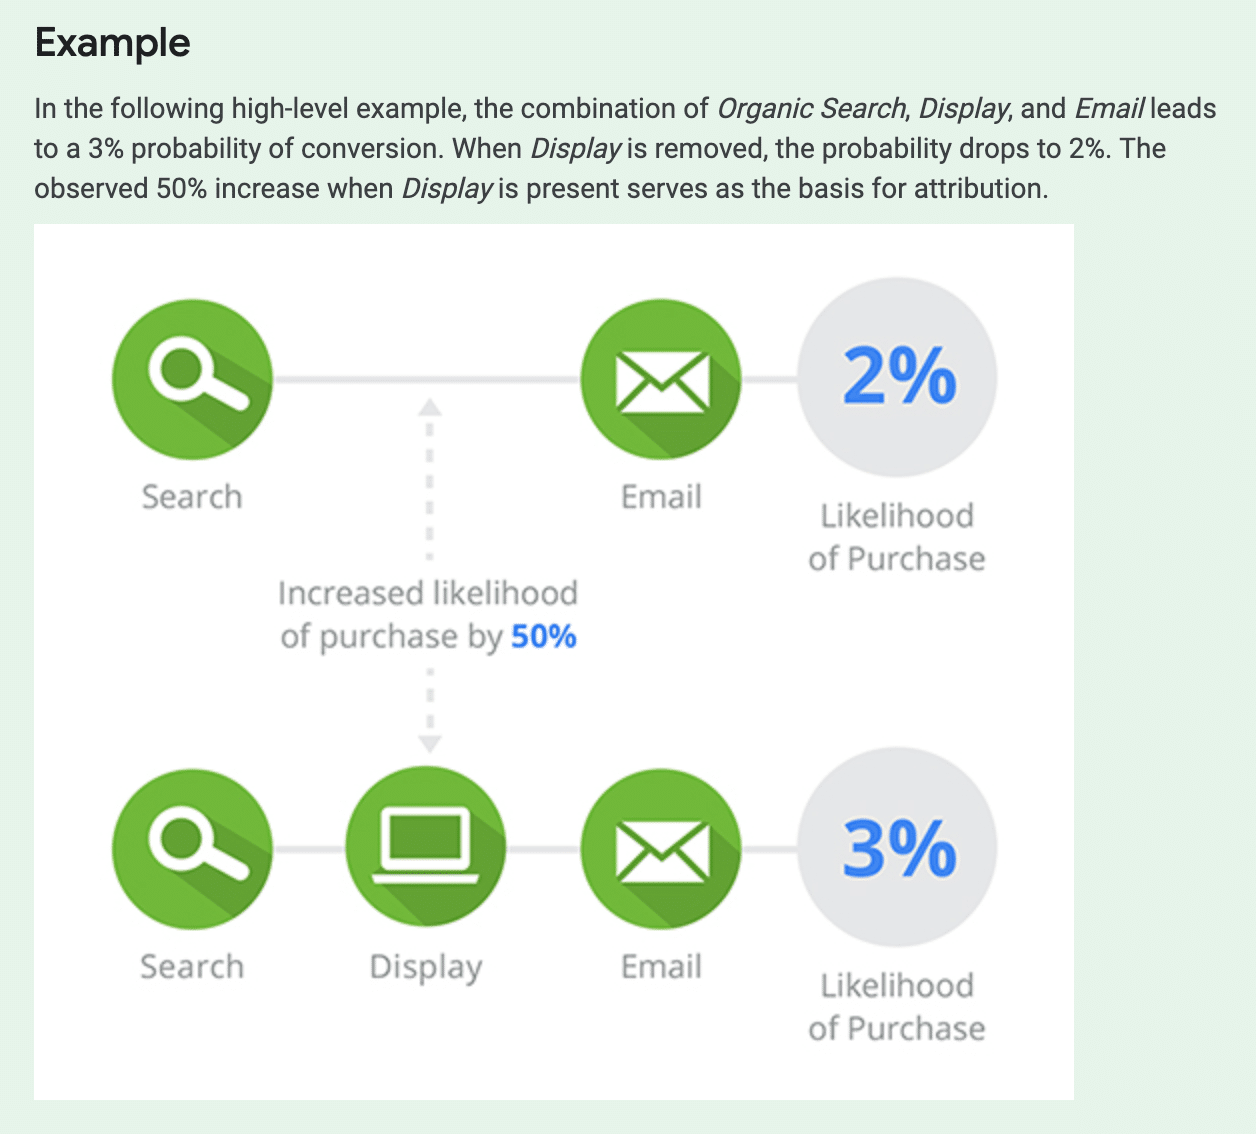
Source: Google’s MCF Data-Driven Attribution methodology. Google now marks that page as legacy Universal Analytics documentation, but it remains its fullest published description of the Shapley method. For the models available in Google Analytics 4 today, see Google’s current attribution documentation.
What is a Shapley value?
The Shapley value comes from cooperative game theory, originally developed to fairly split a payout among players who contributed different amounts to a joint result. Applied to attribution, each marketing channel is treated as a “player,” and a conversion is the “payout” to split.
The calculation looks at every possible order in which the channels in a journey could have occurred, and for each order, measures how much a channel adds when it’s included versus when it’s left out, its marginal contribution. The Shapley value for a channel is the average of that marginal contribution across every possible ordering.
Using the five channels from the worked example further down (ChSEO, ChYT, ChTW, ChDIS, ChTV): if a customer’s journey touched ChSEO, ChYT, and ChDIS before converting, the Shapley value method looks at all the possible sub-groups and orderings of those three channels, ChSEO alone, ChSEO with ChYT, ChYT with ChDIS, all three together, and so on, and calculates how much each channel’s presence changed the odds of conversion in each scenario. A channel that reliably improves conversion odds whenever it appears, regardless of what order it shows up in or what else is in the mix, ends up with a higher Shapley value.
This is different from the Markov model’s approach. Markov looks at actual observed transition probabilities between states in the customer journey. Shapley value instead asks a more abstract, combinatorial question: across every possible way this channel could have combined with the others, how much did it typically contribute?
The practical tradeoff: Shapley value is considered more theoretically “fair” since it accounts for every possible combination a channel could appear in, not just the orders that actually happened. But that completeness comes at a computational cost, the number of combinations to evaluate grows factorially with the number of channels, so Shapley value gets expensive fast once you’re modeling more than a handful of channels. Markov models scale more easily and are usually easier to explain to a non-technical stakeholder via the “removal effect” (what happens to conversions if you remove a channel entirely).
What is a Markov model?
For attribution modelling purposes, a Markov model is a way to chart out the customer interaction cycle. You specify individual states in that process as vertices in a chain. You calculate the probability of transition from one particular state in the chain to a different state in a chain (for example, the probability of a visit to a Twitter page to lead to a click to the company’s main website, as well as the probability of that Twitter page visit being the last interaction (leading to a failed conversion attempt).
Take a company looking at its customer interaction history. Let’s say it has five marketing channels, defined below:
- ChSEO: a search-engine-optimized website, to allow for high ranking in organic search results.
- ChYT: YouTube videos, including ones embedded in the website.
- ChTW: an active Twitter account.
- ChDIS: display ads on other websites via a Google-based ad channel.
- ChTV: television advertising.
You see that there are, say, five different customer “journeys”:
- ChTV -> no conversion
- ChTV -> ChSEO -> conversion
- ChSEO -> ChYT -> ChDIS -> conversion (as in the example given above)
- ChTW -> ChDIS -> ChSEO -> conversion
- ChSEO -> ChYT -> no conversion
From here, we can calculate the probabilities of customers finding themselves at different parts of the customer journey, and transitioning from those states to another state in the Markov chain. Here’s our chart showcasing that:
| Vertix | Transition | Chance | Total Chance |
| Beginning | ChTV | 20% | 40% |
| Beginning | ChTV | 20% | |
| Beginning | ChSEO | 20% | 40% |
| Beginning | ChSEO | 20% | |
| Beginning | ChTW | 20% | 20% |
| ChTV | No conversion | 50% | 50% |
| ChTV | ChSEO | 50% | 50% |
| ChSEO | ChYT | 25% | 50% |
| ChSEO | ChYT | 25% | |
| ChSEO | Conversion | 25% | 50% |
| ChSEO | Conversion | 25% | |
| ChYT | No conversion | 50% | 50% |
| ChYT | ChDIS | 50% | 50% |
| ChDIS | ChSEO | 50% | 50% |
| ChDIS | Conversion | 50% | 50% |
| ChTW | ChDIS | 100% | 100% |
Success! We have a straightforward, mathematical breakdown of the chances of a consumer transitioning from one state to another. We know:
- Which channel consumers will start at;
- Which ones they will transition to; and
- Which channels will consumers be in directly preceding a non-conversion or a conversion.
Now let’s plan it out in a Markov chain:
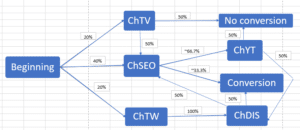
What the Markov model shows that last click misses
Let’s go through the same customer journey we looked at earlier:
ChSEO -> ChYT -> ChDIS -> conversion
In a last click model, we attribute the Google Display Ads with 100% of the credit for the conversion. However, in the Markov model we see the real value that the search-engine-optimized website has for driving conversion; we see the value it has in driving traffic to the banner ads, as well as its leading role in a number of successful consumer journeys.
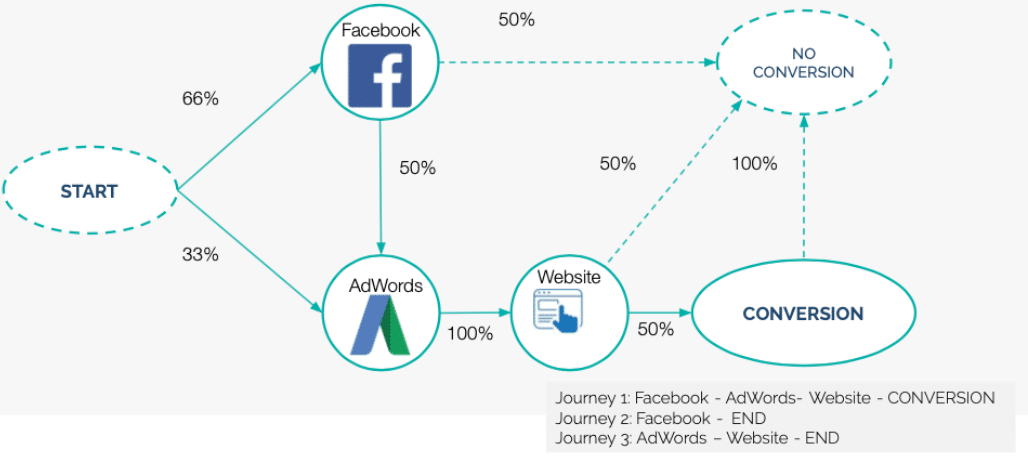
Markov Model:
The removal effect of the Markov attribution model:
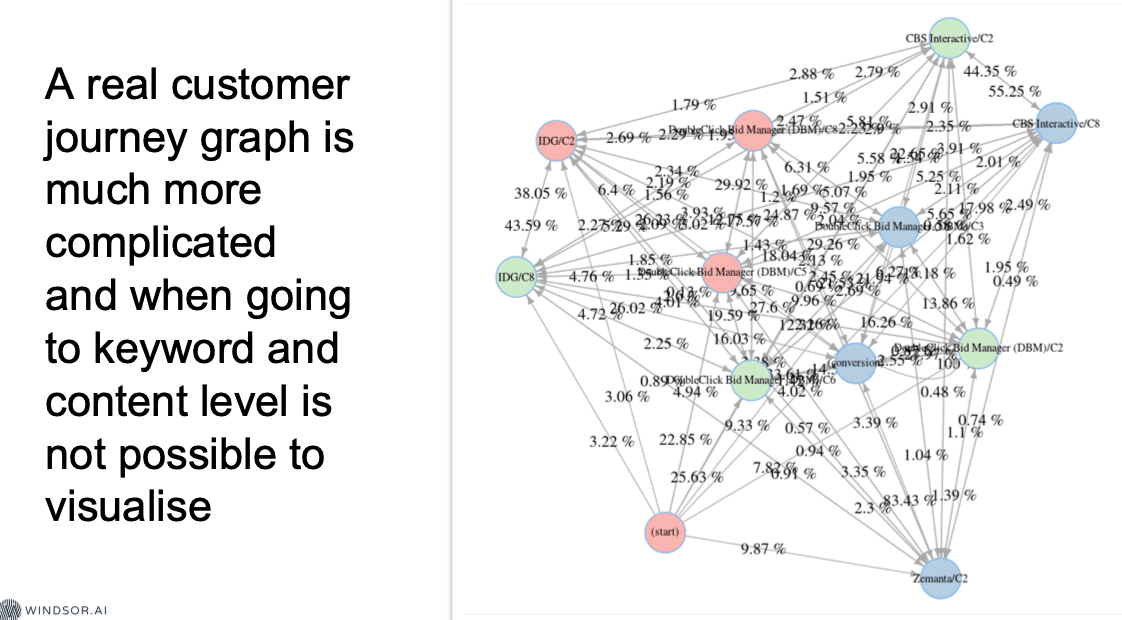
A real markov model with customer journeys:
Summary
Here at Windsor.ai, we drill deep into data, ensuring that the best insights can be extracted from the information available to you. Our experience has led us to believe that Markov models are the best option from those available for attribution modelling for most businesses, since they scale better as more channels are added and the removal effect is easier to explain to stakeholders than a Shapley value calculation. A Markov model is a probabilistic model, which focuses on specific calculations of the chance that an interaction in one channel will transition to a different state, such as a conversion.
Windsor.ai connects your marketing channels into one place and generates easy-to-read Markov models, so you can get real insight into how your marketing efforts are performing without building the model by hand. Connect your data in 1 minute. Free forever plan.

Get started for free
Access all your data from your favorite sources in one place.
Free forever plan, no credit card


