 AI insights
 About us
 Careers
 Security
 Customer reviews
 Contact us
 Affiliate program
 Solution partners
 Looker Studio templates
 Tableau templates
 Facebook Ads templates
 Google Ads templates
 Data fields & Metrics
 AI prompt library & Guides
 Product documentation
 API documentation
 Case studies
 Blog
Blog Data models
 Windsor vs Supermetrics
 Windsor vs Fivetran
 Windsor vs Portermetrics
 Last updated: 2 March 2026

As a marketing manager or analyst, you track marketing metrics across multiple tools and dashboards. Yet every review still lands on the same question: what should we do next? If you’re in the same boat and looking for the marketing metrics that matter, you’ve landed on the right page.
In this data-heavy environment, Windsor.ai becomes a must-have tool for marketing teams. It gathers and tracks marketing metrics in one place, integrating seamlessly into your favorite reporting or analytics tool. By unifying channel, ads, CRM, and organic referrals data, Windsor.ai enhances decision-making, letting you focus on actions instead of hunting for numbers.
Here’s the thing. Marketing teams are often struggling. Budgets are tighter, privacy rules keep shifting, and platforms often disagree. In such situations, more numbers can feel safer, but they rarely make choices clearer. The issue isn’t data volume; it’s choosing the most important marketing metrics that actually change decisions.
This guide narrows the field to five essential marketing KPIs tied to revenue and retention. We’ll pick one North Star and give every metric a clear job in the journey.
You’ll learn what KPIs to track, why they matter, and how to work with them effectively. By the end, you’ll get a complete checklist, a formulas box, and a weekly ritual to turn metrics into action.
So, let’s get into it.
5 marketing metrics that actually matter to every business
You don’t need to crowd the report with KPIs. Instead, you need a small set of KPIs that consistently lead to a decision. Think of this section as five “slots” you review every week, each with an owner and a clear next step.
The goal here is balance. One slot proves revenue impact, one proves quality, one removes friction, one keeps acquisition sane, and one protects long-term health. With these five marketing metrics in place, your dashboard becomes much simpler and easier to track for everyone.
1) Attributed revenue or pipeline created
These metrics answer, “Which efforts actually produced money, and what will we double next?”
Start with the main outcome – one that pays the bills. If you can tie revenue to marketing, use it; if your cycle is long, use the marketing-sourced pipeline as the proxy.
2) SQLs or activated accounts
These metrics tell you whether you are creating demand that sales or product can win, not just clicks.
Volume only helps if it’s qualified. In sales-led teams, track sales-qualified leads; in product-led teams, track accounts that reach first value.
3) Primary conversion rate
This metric forces you to find and fix the friction that slows the funnel.
Pick the single step that unlocks growth for you right now (a visit to signup, lead to SQL, or trial to paid). Improving this one step multiplies every channel you run.
Track the conversion at the weakest step this month; when it’s healthy, shift focus to the next bottleneck (visit→signup, lead→SQL, or trial→paid).
4) Efficiency pair: CAC and LTV:CAC
These metrics guide budget calls: where to scale, where to pause, and where pricing or packaging needs a rethink.
Cost without context is misleading, and context without cost is risky. Look at the acquisition cost next to the value a customer returns over time.
5) Retention or churn
These metrics keep you honest about onboarding, lifecycle messaging, and product fit.
Durable growth beats short spikes. If customers don’t stay, the bucket leaks, no matter how strong the acquisition looks.
How do we balance leading and lagging indicators?
Some numbers predict what happens next; others confirm what already happened. Treat SQLs, activation, and your primary conversion step as leading signals, and use revenue, payback, and retention to validate impact. This balance lets you act fast without losing the bigger picture.
Who owns each metric, and how do we review it?
Assign each metric to a clear owner so decisions are not left hanging. Review the same five at the same time each week, and end with one accountable action per slot. Over time, the ritual matters as much as the metrics because it keeps attention where outcomes live.
Before we map these five slots to a simple five-stage funnel, let’s make sure the inputs agree. In the next section, we’ll tidy up tracking and naming so every number is trustworthy.
How do you keep your marketing data trustworthy?
You cannot pick marketing metrics that matter if the inputs don’t agree and the data seems skewed. In that case, data will not lead to actionable decisions or the creation of a marketing plan.
That’s why you need to ensure each data point that reaches the final sheet is cross-verified and trusted. A little hygiene each week keeps every metric believable.
Why does data hygiene matter?
Inconsistent names and missing tags can create a lot of confusion. That leads to bad budget calls. Clean inputs make your marketing KPIs comparable across channels and time.
What tracking taxonomy should you agree on?
Decide on one naming pattern for campaigns, ad sets, and creatives. Include audience, offer, and date so the work is searchable later. Write it down in a shared doc and stick to it.
Why does security matter in marketing data?
While accuracy and hygiene keep your reports actionable, security ensures your data is not exposed, tampered with, or lost. Protecting your analytics tools, dashboards, and CRM with secure logins and access controls prevents unauthorized changes that can distort KPIs.
Even simple measures like setting up two-factor authentication or keeping a tracker on your phone to monitor unusual activity can go a long way in maintaining trustworthy numbers. When your team knows the data is both clean and secure, decision-making becomes far more reliable.
How should you tag campaigns with UTMs?
Use a single UTM scheme across paid, email, and partnerships. Always set source, medium, and campaign. Add content and terms only when they change decisions. To create UTMs, you can use a trusted URL campaign builder. This one’s pretty handy and launched by the Google Analytics team themselves.
How do you normalize channels and sources?
Map messy labels to a standard set. “ppc”, “cpc”, and “paid_search” should roll up to one Paid Search bucket. Do the same for social, display, affiliates, and email.
Windsor.ai helps you automatically map the fields across 325+ sources to ensure your reports are consistent and clear.
Who owns the taxonomy and the cadence?
Give one person ownership so all nomenclature and taxonomy rules can be followed. Do a quick weekly sweep for missing UTMs, off-pattern names, and rogue mediums. Fix at the source, not in a spreadsheet.
How do you handle missing or conflicting data?
Sometimes, data pointers might be missing. If a click has no UTMs, infer from the referrer or send it to Unclassified and fix the tag in the platform. If platforms disagree, note the gap and choose one system of record for each question.
Where should your marketing data live (single source of truth)?
Pick one destination where ads, analytics, and CRM meet. Use it to power the 5-metric dashboard and the AARRR view. Keep the raw platforms for deep dives, not weekly truth.
Use Windsor.ai as a single hub where ads, analytics, and CRM meet, so all your metrics and executive KPIs use the same numbers.
Now that the numbers are consistent, we’ll map your five slots to a simple five-stage funnel so each one ties to a concrete step in the journey.
What is the AARRR funnel, and how do you use it?
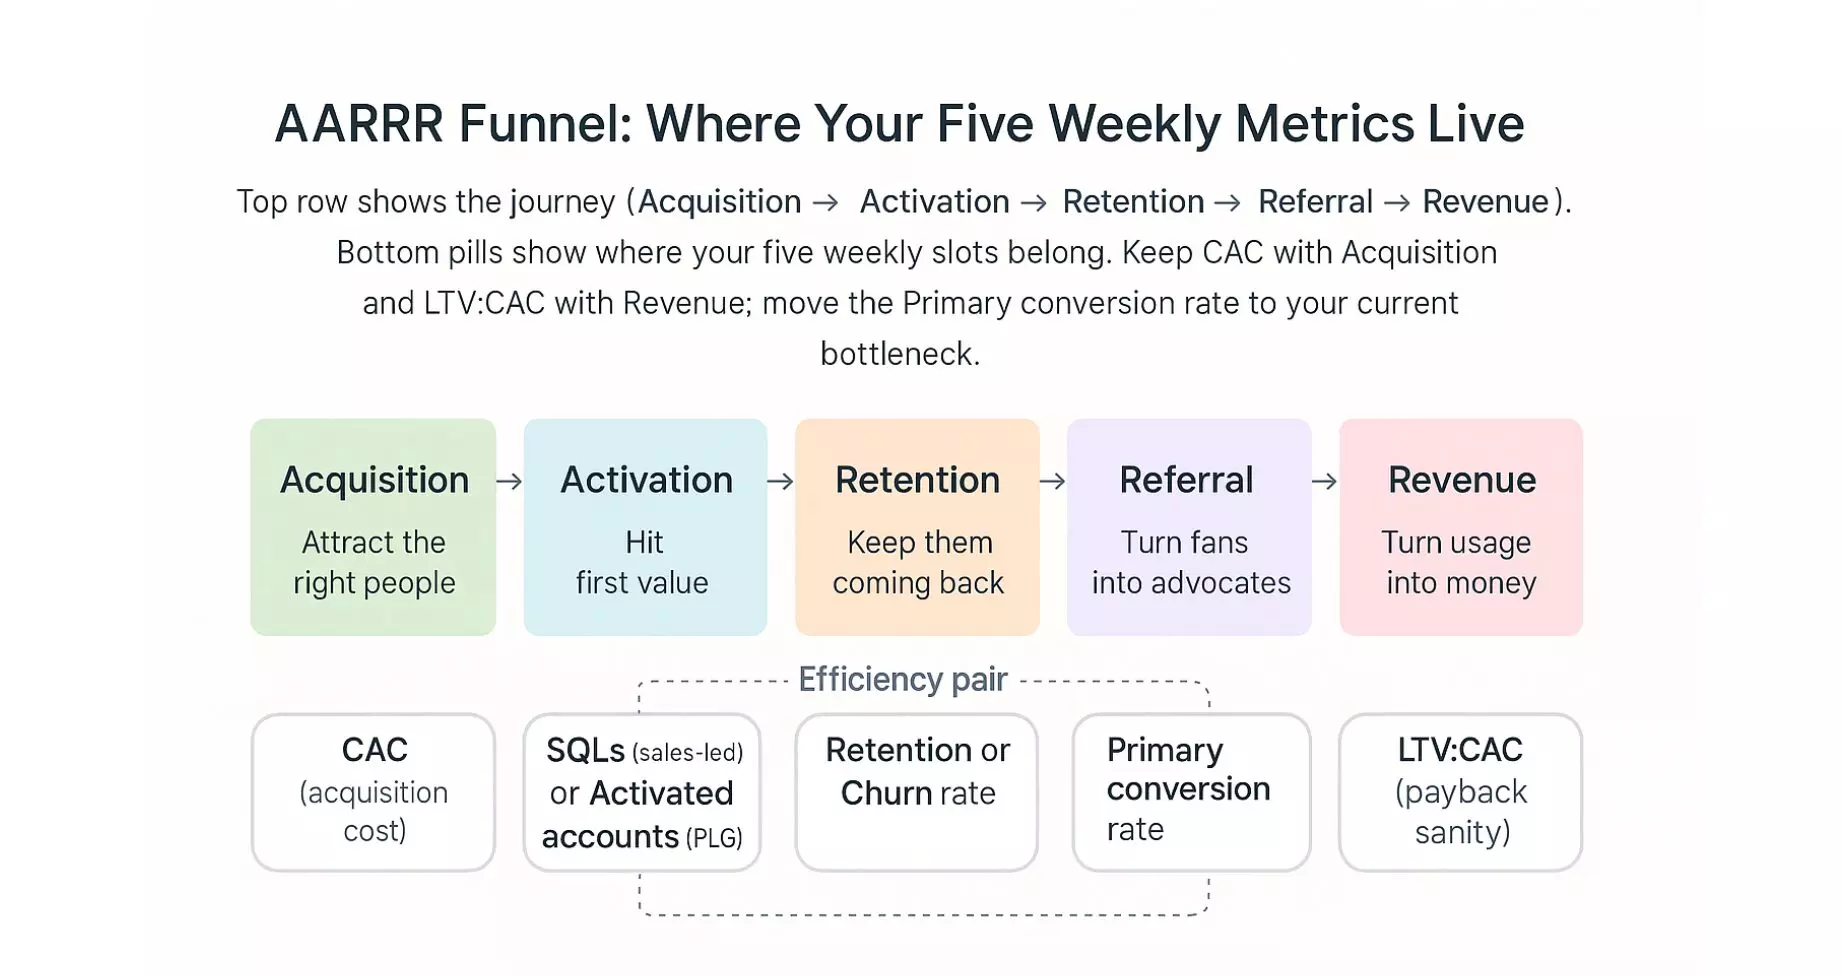
AARRR is a simple five-stage view of the customer journey: Acquisition, Activation, Retention, Referral, Revenue.
We’ll use it to place your five weekly slots where they do the most work. The goal is clarity: each stage gets a job, and each job has an owner.
Which signals prove Acquisition?
Acquisition tells you if you’re attracting the right people. Look at qualified traffic by source and how often people click and start the journey. Your primary conversion rate lives here if the step is visit → signup, and your CAC (Customer Acquisition Cost) sits here when you judge channel efficiency.
When do new users hit Activation?
Activation is the first moment of real value. Track activated accounts or the first action that predicts success. If your key step is trial → first value, this is where your primary conversion rate belongs.
Are people staying? What does Retention say?
Retention shows whether growth sticks. Use retention or churn to see if people keep using or buying after week one or month one. This slot protects long-term health and turns spikes into durable revenue.
Do happy customers bring others? What about Referral?
Referral measures word-of-mouth and program invites. Watch referral signups and invite conversion, with NPS as a simple proxy for advocacy. You can keep referrals as a supporting metric, or fold it into the retention slot if referrals are a core growth loop.
For teams looking to streamline this process, Referral Factory is a tool that makes managing and tracking referral programs much easier.
You can also add ReferralCandy to your KPI stack to track and grow referral, affiliate, and influencer-sourced revenue alongside CAC and retention, so advocacy shows up in your 10-minute dashboard.
Is it translating to money? How do we confirm Revenue?
Revenue closes the loop. Use attributed revenue if you can, or a marketing-sourced pipeline when sales cycles are long. Pair this with LTV:CAC to keep scale decisions sane.
How do the five slots map in practice?
Place attributed revenue/pipeline under Revenue. Put SQLs or activated accounts under Activation. Anchor your primary conversion rate at the stage that blocks growth right now. Keep CAC and LTV:CAC near Acquisition and Revenue to balance cost and payback. Keep retention or churn under Retention to protect the bucket.
Before we judge which channels drive each stage, the inputs must be fair. Next, we’ll keep your measurement privacy safe and realistic so attribution reflects what actually happened.
How do you measure which metrics matter in a privacy-first world?
Measuring impact is nowadays much harder than it used to be. Privacy rules, fewer cookies, and platform numbers that don’t always match can point you in different directions. You still need a consistent way to decide what worked, so your five slots actually make sense.
You can use three methods for different decisions. MTA guides weekly allocation, incrementality confirms real lift, and MMM sets your longer-term budget mix. Below is when to use each and how they fit together.
What is Multi-Touch Attribution (MTA) and when should you use it?
MTA estimates how much each channel and campaign contributed across a customer’s journey. It is most useful for week-to-week decisions like shifting spend between paid social, search, email marketing free campaigns, and partnerships. It works best when tracking is clean, because reliable paths make the contribution estimates more trustworthy.
What are incrementality tests, and when should you run them?
Incrementality asks what would have happened anyway if you did nothing. You answer it by holding out a region, audience, or time window and comparing results to what you ran. Use these tests to validate your biggest bets, to sanity-check platform claims, and to confirm lift before you scale spend.
What is Marketing Mix Modeling (MMM), and when is it the right tool?
MMM explains outcomes like revenue and leads using aggregated, privacy-safe data over months or quarters. It shines when channels lack clicks or have partial data, such as TV, PR, or out-of-home. Use it for planning and budget split, not day-to-day optimizations.
How do these methods work together without overlap?
Think of them as a simple ladder. Use MTA to guide weekly allocation, use incrementality to confirm the moves that matter, and use MMM to set the quarterly mix and test “what if” scenarios. The three answers line up, so short-term moves support long-term strategy.
What should you do this week to keep measurement fair?
Choose a system of record for each question, for example, revenue and pipeline from CRM, channel contribution from MTA, and lift from a small holdout. Schedule one lift test on your primary paid channel and write down the assumption you want to prove. Add a 90-day checkpoint to review MMM-style trends so your weekly wins add up to a sensible plan.
If you want a hands-on walkthrough, here’s how to run Meridian MMM on Windsor.ai data.
Which executive KPIs prove marketing impact?
Executive KPIs answer leadership’s core questions like: are we growing efficiently, is growth durable, and should we invest more right now?
The main thing to keep in mind is to keep the list short so it guides decisions, not debates. Pick the few that match your model and review them alongside your five weekly slots.
Are we acquiring customers efficiently (CAC)?
CAC shows what it costs to acquire a customer over a period. It helps you judge whether current channels and audiences are worth scaling. Use it to decide where to add budget and where to pause.
Is growth economically sane (LTV and LTV:CAC)?
LTV (lifetime value) and the LTV:CAC ratio tell you whether the customers you’re buying will pay back the cost to win them. This is the guardrail for aggressive growth. Use it to sanity-check scale decisions and to weigh retention or pricing work.
Are we healthy at a blended level (MER)?
MER (Marketing Efficiency Ratio) looks at total revenue against total marketing spend, regardless of channel. It’s useful when attribution signals are messy, but you still need a high-level read. Use it as your “altimeter” while channel KPIs handle the finer steering.
How fast do we earn back acquisition spend (Payback period)?
Payback shows how many months it takes to recover CAC from gross profit or revenue, depending on your model. Shorter payback improves cash health and lowers risk. Use it to prioritize channels, offers, and segments that return money quickly.
Are we turning qualified demand into revenue (Win rate and SQL→Closed-won)?
This captures how well marketing-qualified or sales-qualified demand converts through the pipeline. It is a direct signal of targeting, offer quality, and sales alignment. Use it to find friction between stages and to focus on enablement where it matters.
How quickly does revenue land (time to revenue)?
Time to revenue tracks the delay from first touch or signup to booked revenue. Shorter cycles mean faster learning and faster cash returns. Use it to value channels that accelerate decisions, not just generate volume.
Where does ROI/ROAS still help?
ROI/ROAS is useful for channel comparisons when tracking is clean and cycles are short. Treat it as a supporting view, not the only one. Use it to rank creative and campaigns inside a channel while the executive KPIs guide the bigger budget calls.
👉 Related: 4 Key Ways to Measure Marketing ROI
How to use these without creating KPI sprawl?
Pick three or four executive KPIs for your model (for example, CAC, LTV:CAC, Payback, and Win rate). Keep them on the same weekly page as your five slots. If an executive KPI doesn’t change a decision this quarter, drop it from the scoreboard.
With the right executive KPIs in place, you can review the whole picture in minutes. Next, we’ll build a simple 10-minute dashboard that puts these KPIs and your five slots on one page.
What does a 10-minute executive dashboard look like?
A 10-minute dashboard tells one story on a single page. It shows
- what changed
- why it changed
- what you should do next
The goal is not to impress with visuals; it’s to make a decision in one short review. Even simple visuals work as long as you edit images or charts just enough to highlight the insights that matter.
What should be on your executive’s marketing dashboard?
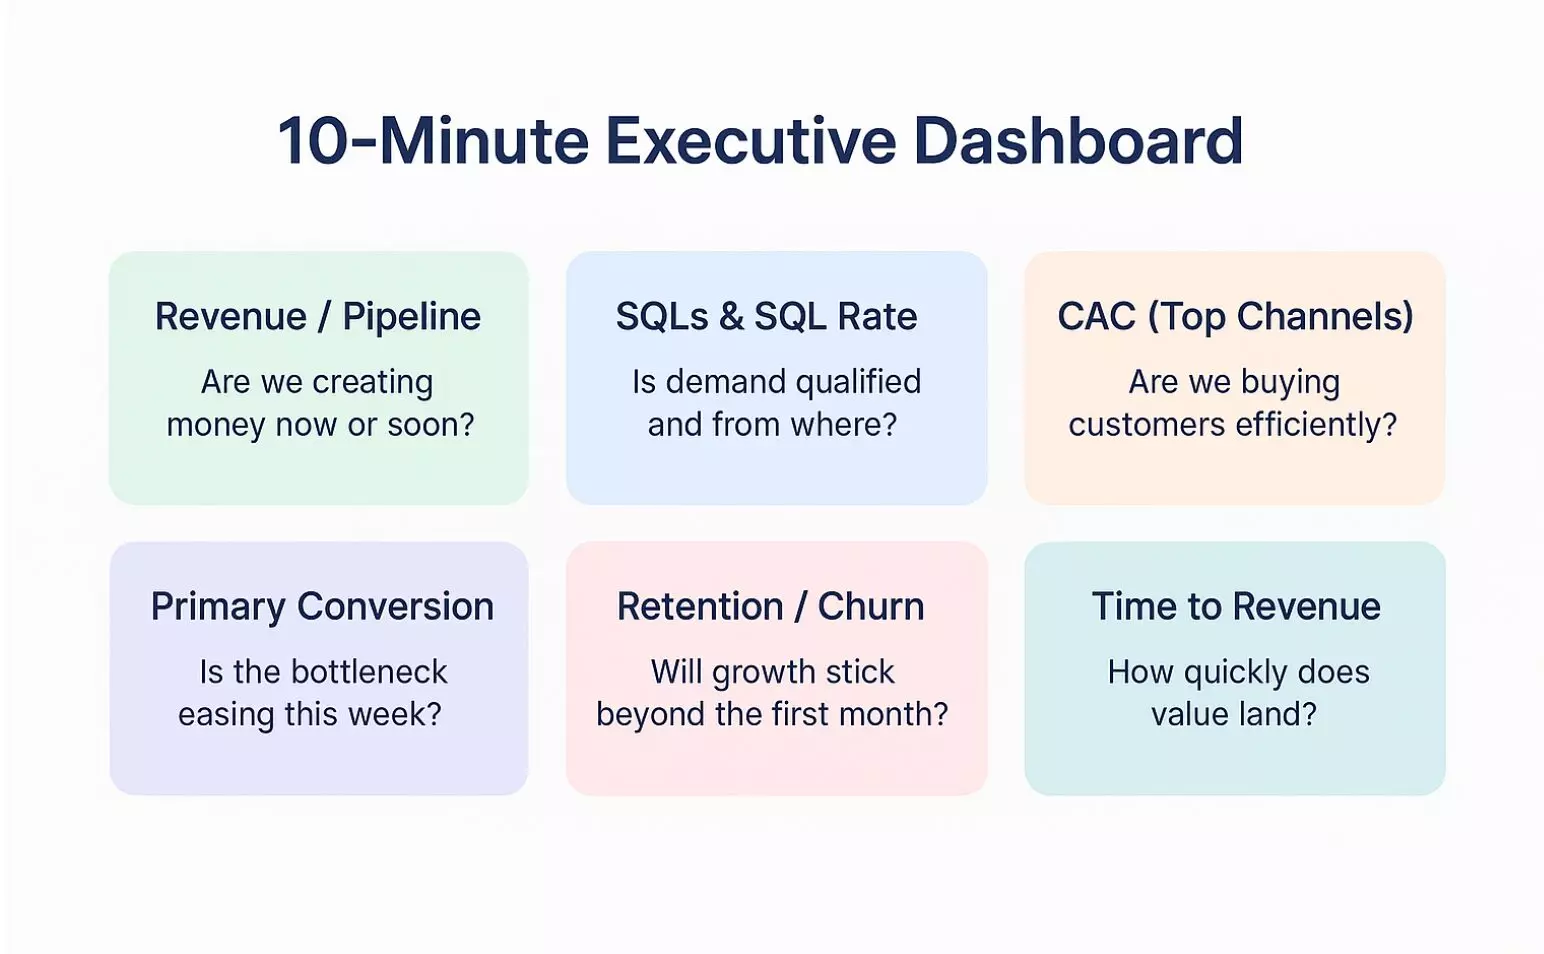
Use six tiles that map to the questions leaders ask every week.
- Attributed revenue or pipeline (this period vs last): Are we creating money now or soon?
- SQLs and SQL rate by source: Is demand qualified, and where does it come from?
- CAC trend for top channels: Are we buying customers efficiently as scale shifts?
- Primary conversion rate: Where is the current bottleneck, and is it easing?
- Retention or churn trend: Will growth stick beyond the initial spike?
- Time to revenue: How quickly does value land after first touch or signup?
How do you design it so leaders can scan in seconds?
One time window (this week or this month) with a clear comparison (last period and last year). Each tile answers one question, shows a small sparkline, and uses green/yellow/red thresholds that you set in advance. Add a one-line note field under each tile so owners can explain a shift in plain language.
Windsor has plenty of pre-made Marketing Tracking Dashboard Templates to pick from. You can check them out and share with your team.
Which breakdowns help without adding noise?
Keep one by-source view for SQLs and CAC, and one cohort or segment view for retention. If a breakdown does not change a decision, move it out of the executive view and into the team’s working report. Save deep channel metrics for the team sections that follow.
Who owns it, and how should the weekly review run?
Assign each tile to an owner before the week starts. In the review, spend two minutes scanning, five minutes on the largest movement, and three minutes to agree on one action and who takes it. Close the review with a short note on what you expect to see next week if the action works.
Where should it live so numbers stay consistent?
Build the page on top of the same unified data you use for the five slots. That keeps revenue, pipeline, and channel numbers aligned across teams. If you prefer a lightweight start, a single sheet with six tiles and thresholds works well; you can graduate to a BI view as needs grow.
With the executive dashboard in place, teams need the right working metrics to move those tiles.
Next, we’ll cover team-level metrics that actually shift acquisition, activation, retention, referral, and revenue.
Which team-level metrics actually move the funnel?
Team metrics should move a specific stage of the journey, not just add numbers to a report.
Use the table below to align each team’s weekly work with a clear goal, a short metric list, and a next step.
- Acquisition
- Goal: Attract the right people
- Metrics: Qualified traffic by source; Cost per qualified visit; CAC by audience
- Next step: Narrow targeting, review the inbound marketing strategy, shift budget to high-quality sources, test a higher-intent offer
- Activation
- Goal: Get new users to first value
- Metrics: Activation rate; Time to first value; Primary conversion rate (if visit→signup or lead→SQL)
- Next step: Remove form friction, improve onboarding step, add a clear “first win” prompt
- Retention
- Goal: Make growth stick
- Metrics: Retention rate; Churn rate; DAU/MAU or repeat purchase rate
- Next step: Fix the biggest drop-off cohort, add lifecycle emails, and set success triggers in-product
- Referral
- Goal: Turn fans into advocates
- Metrics: Referral signups; Invite conversion; NPS as proxy
- Next step: Simplify the invite path, place the ask at the value moment, highlight rewards
- Revenue
- Goal: Turn usage into money
- Metrics: Attributed revenue or pipeline; Trial→paid conversion; LTV:CAC
- Next step: Scale winning channels, tune pricing or packaging, improve sales handoff
How do you turn metrics into weekly actions?
Metrics matter when they change what you do next. Keep one short loop each week so decisions stick and the dashboard moves.
The loop:
- Pick one metric to move from your dashboard.
- Run two or three focused experiments (audience, offer, page change).
- Log the result and decide: keep or kill. One owner closes the loop.
Trigger → action cheatsheet:
- CAC up: narrow audience, shift bids, test a higher-intent offer.
- SQL rate down: simplify form, sharpen lead magnet, adjust targeting.
- Retention dip: improve a key onboarding step, add a value email, set an in-product success prompt.
- Time to revenue slow: shorten the path to demo, pre-qualify earlier, add a calendar link.
These are just some possible examples. If your trigger varies, you will have to pick a separate action suitable for your brand’s overall growth.
Segregate some time for AI experimentation
With AI marketing tools stepping into the picture, it is now more important than ever to reconsider and update your workflows regularly.
With AI ad analytics tools, you can save plenty of time on reporting and data compiling tasks and use them to solve strategic challenges instead.
One such example is Windsor MCP. Let’s say you’re running Meta Ads and looking for insights that would take hours to spot with the Ads Manager dashboard. In that case, you can simply send your Meta Ads data to any LLM through Windsor MCP and ask questions like: “How did the audience’s device preference (mobile vs desktop) impact my ROAS in the last 3 days?”
If your team is stretched thin, you can also hire virtual assistants to handle repeatable ops work like UTM QA, data cleanup, weekly report prep, and dashboard checks, freeing your core team to focus on analysis and decisions.
Conclusion
Efficient marketing is all about tracking less and deciding more. With the discussed five weekly slots, clean inputs, and a simple funnel map, your dashboard will stop arguing with itself. You know what moved, why it moved, and what to try next week.
Another thing to keep in mind is keeping measurements realistic. Use MTA for weekly allocation, incrementality to confirm lift, and MMM for the longer-term split. Pair that view with a 10-minute executive dashboard so decisions take minutes, not meetings.
🚀 Ready to put this in place? Get started with Windsor.ai to connect your ad, analytics, and CRM data from more than 325 data sources and extract valuable cross-channel insights!

