 AI insights
 About us
 Careers
 Security
 Customer reviews
 Contact us
 Affiliate program
 Solution partners
 Looker Studio templates
 Tableau templates
 Facebook Ads templates
 Google Ads templates
 Data fields & Metrics
 AI prompt library & Guides
 Product documentation
 API documentation
 Case studies
 Blog
Blog Data models
 Windsor vs Supermetrics
 Windsor vs Fivetran
 Windsor vs Portermetrics
Connect Google Analytics 4 (GA4) to Lovable
Automatically sync your Google Analytics 4 data to Lovable using the Windsor.ai connector.
Talk to your GA4 data in Lovable to understand what drives conversions, where users drop off, and which channels deliver revenue.
Forget CSVs. Stop copy/paste. Connect data in minutes. No code required.


Understand user behavior and drive more conversions with GA4 to Lovable integration
Windsor MCP automatically streams your GA4 data into Lovable, so you skip manual analysis and get instant insights into traffic, conversions, user behavior, and revenue. Explore key use cases below.

Fix funnel drop-offs
Fix funnel drop-offs
Lovable maps every step from product view to purchase, shows the exact drop-off rate at each stage, and flags which traffic sources have the worst completion rates. It helps you fix the right thing first and stop losing revenue at the same point every week.

Monitor landing page performance
Monitor landing page performance
Lovable analyzes Bounce Rate, Engaged Sessions, and Views per Session by Landing Page to find pages that get traffic but deliver zero engagement. Optimize the highest-impact pages first and turn existing traffic into revenue without spending more on acquisition.

Connect spend to user behavior
Connect spend to user behavior
Ask Lovable to compare Google Ads or Meta Ads spend against GA4 engagement rate, session duration, and purchase revenue per campaign. See which campaigns drive users who actually convert, and reallocate budget away from the ones that inflate click volume without delivering revenue.
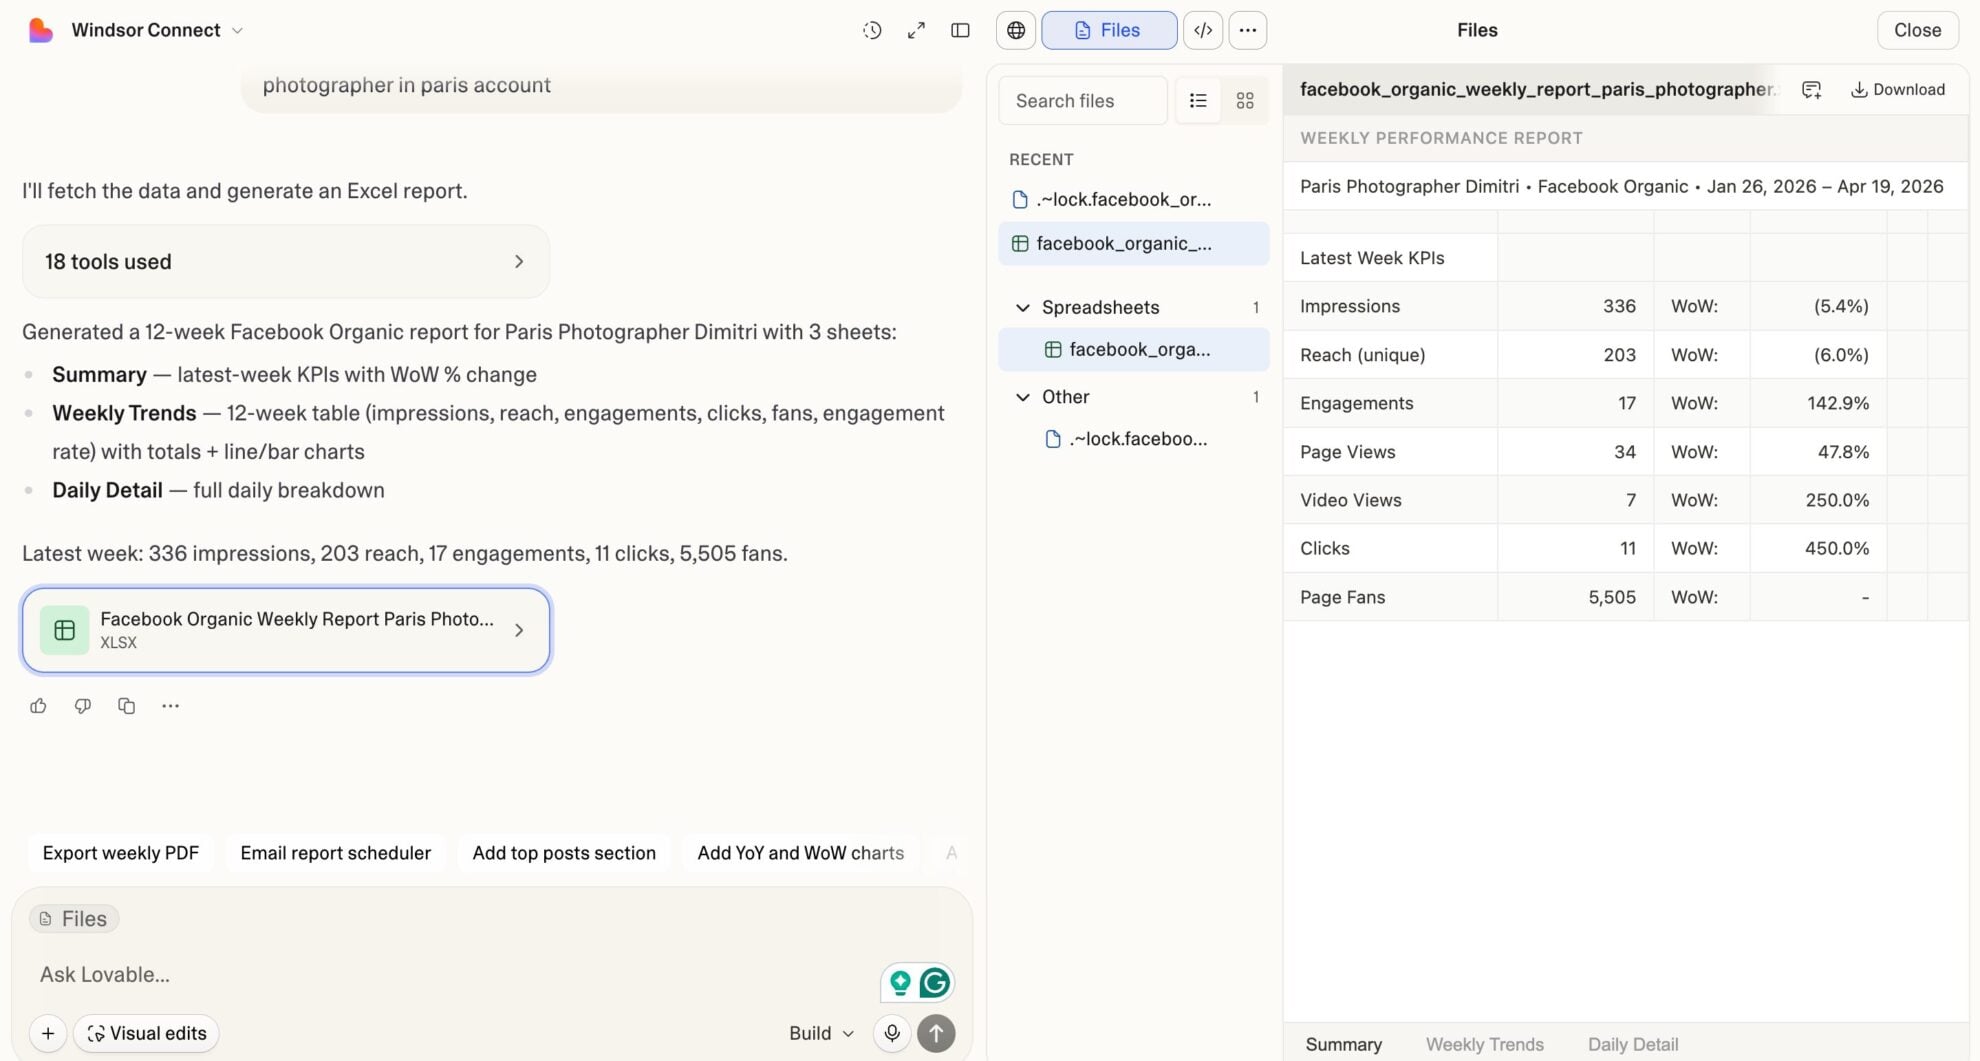
Using Windsor.ai to connect data from Google Analytics 4 to Lovable
Connecting GA4 data into Lovable usually requires manual exports, tedious data prep, or expensive tools. Windsor MCP removes these barriers by automatically pulling, normalizing, and syncing your sessions, users, events, conversions, and e-commerce metrics into Lovable.
Analyze your analytics data using natural language prompts and build performance dashboards in seconds.
How to connect Google Analytics 4 to Lovable with Windsor.ai
Explore our video tutorial and a step-by-step guide to integrate your Google Analytics 4 data into Lovable with the Windsor.ai connector.
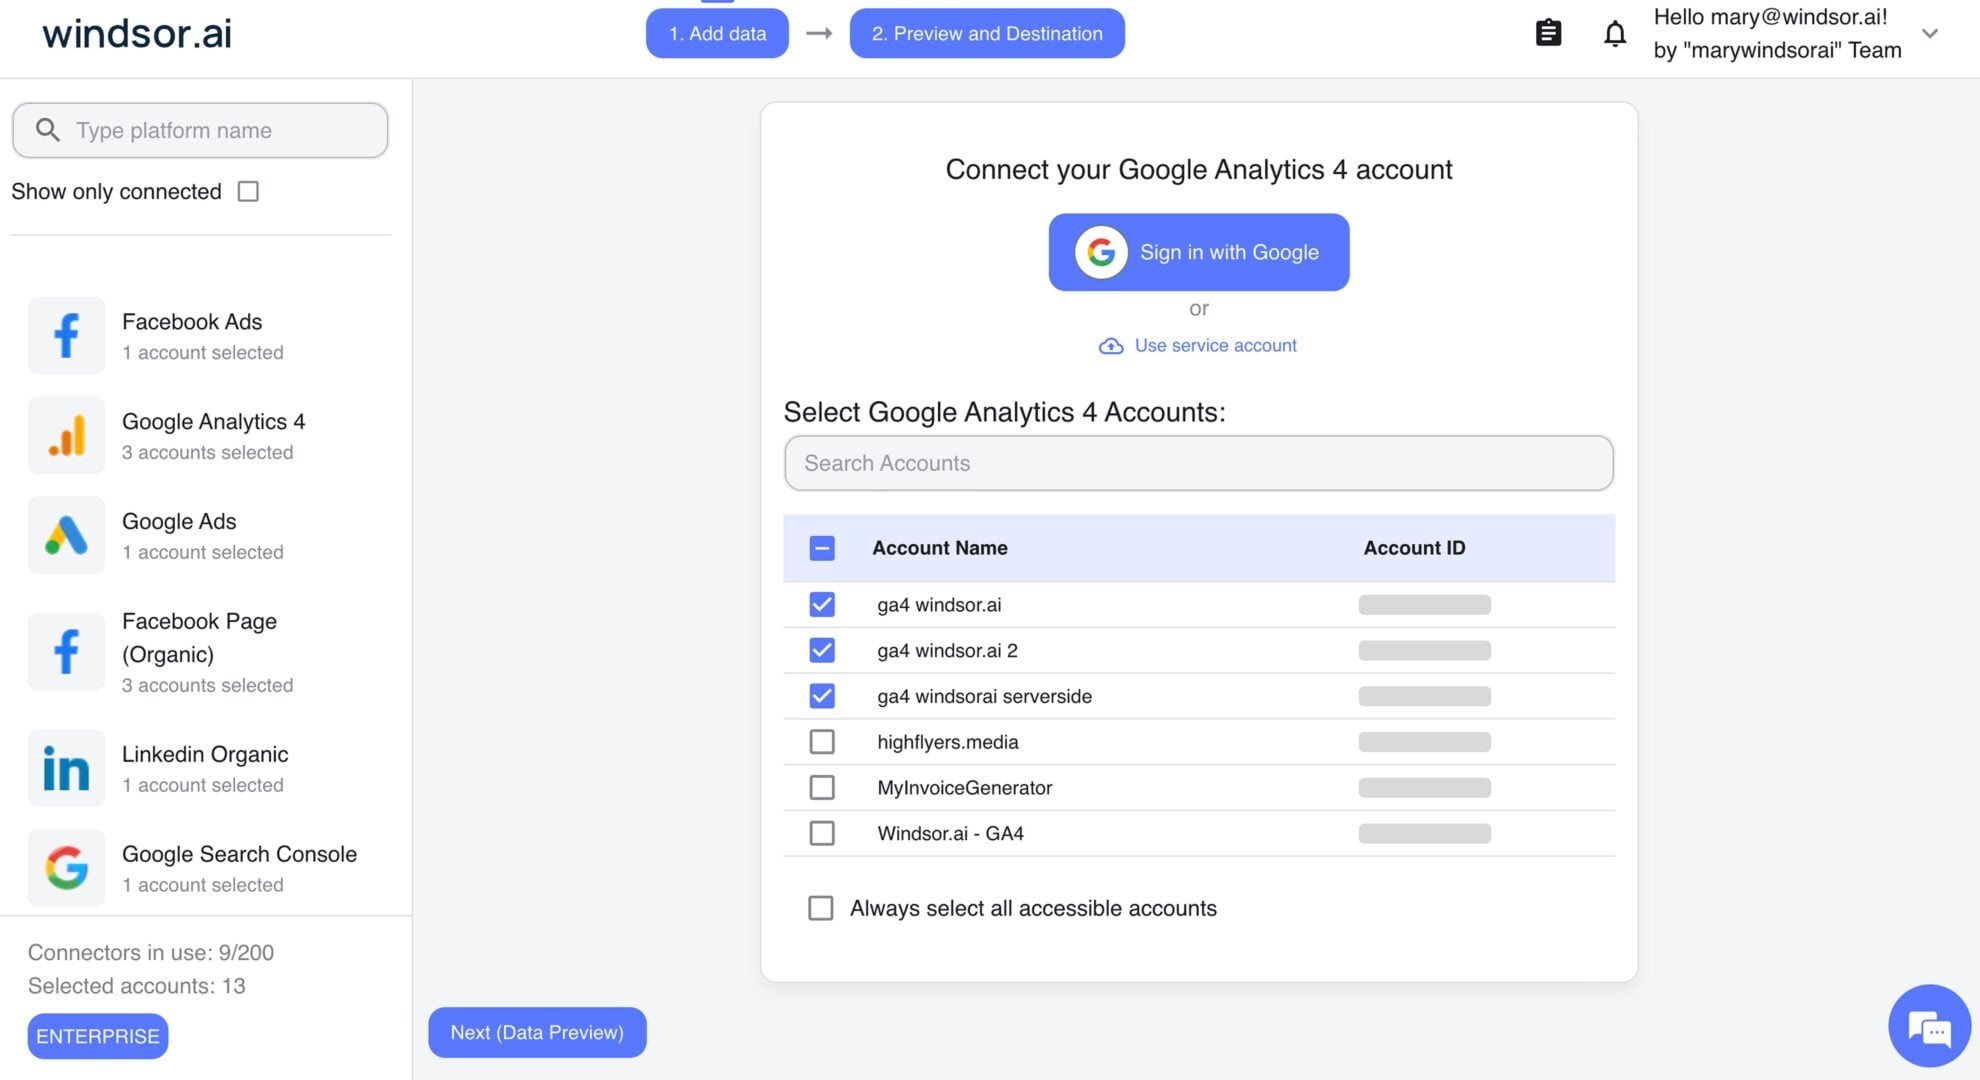
Select your data source
Choose Google Analytics 4 as your data source and grant access to Windsor.ai.
Select custom connector in Lovable
In Lovable, open Connectors and select Custom MCP.

Add MCP server
Enter the following details:
- Name: Windsor.ai
- URL: https://mcp.windsor.ai/
Click Add & Authorize to save the connector and authorize access to Windsor.ai.

Authorize and start querying your data
Once added, Windsor will appear in your list of connectors. Enable Always allow permissions for faster access.
Open a new chat and start querying your connected data.

FAQs
What can I do with GA4 data in Lovable?
Once your GA4 data is in Lovable, you can:
- Analyze traffic by source and channel: See which channels (Organic Search, Paid Search, Paid Social, Direct, Referral) drive the most sessions, engaged users, and conversions.
- Track revenue and e-commerce performance: Monitor purchase revenue, transactions, add-to-cart rate, checkout completions, and purchase-to-view rate by product or campaign.
- Understand user behavior: Analyze engagement rate, bounce rate, average session duration, pages per session, and scrolled users to see how visitors interact with your site.
- Monitor conversion performance: Track key events and conversion rates by traffic source, campaign, device, or landing page.
- Identify top landing pages: See which pages bring in the most sessions and which convert best, so you know where to invest in content and CRO.
- Compare new vs returning users: Understand acquisition vs retention health and track first-time purchasers separately from returning buyers.
- Build live GA4 dashboards: Turn your analytics data into shareable Lovable dashboards for clients, stakeholders, or your growth team, updated automatically.
Can I analyze e-commerce performance in Lovable with GA4 data?
Yes. Windsor pulls the full GA4 e-commerce funnel: product views, add-to-carts, checkouts, purchases, items purchased, gross item revenue, purchase revenue, and refunds. Ask Lovable to map the funnel, identify drop-off points, compare conversion rates by traffic source, or surface your top-revenue products by item name and category.
Can I track new vs returning user performance in Lovable?
Yes. Windsor pulls GA4’s new vs returning user dimension alongside sessions, engagement rate, purchase revenue, and first-time purchaser data. Ask Lovable to compare acquisition vs retention metrics and track how well your site converts first-time visitors into buyers.
Is it possible to analyze custom dimensions and metrics from GA4 in Lovable?
Yes. Windsor.ai supports custom dimensions and metrics defined in your GA4 property, things like user type, membership tier, or loyalty points. To retrieve custom dimensions, you need to include at least one metric in your request. Custom metrics can be requested without a dimension. You can test field compatibility using the GA4 Dimensions & Metrics Explorer.
What prompts can I use to analyze my Google Analytics 4 data in Lovable?
Beyond basic performance summaries, you can use more advanced, specific prompts to uncover deeper insights. For example:
Analyze my paid vs organic traffic for the last 30 days. For Paid Search and Organic Search channels, compare sessions, engaged sessions, bounce rate, average session duration, key events, and purchase revenue. Calculate cost per key event for Paid Search using Google Ads spend data.
Show me my e-commerce conversion funnel for the last 30 days. For each step (product views, add to carts, checkouts, purchases), show the absolute number and drop-off rate between steps. Identify the step with the highest drop-off and which traffic source has the worst funnel completion rate.
Analyze landing page performance for the last 30 days. For each landing page with more than 500 sessions, show bounce rate, engagement rate, average session duration, and purchase revenue. Rank by revenue per session and flag pages where bounce rate exceeds 70%.
Break down purchase revenue by traffic source and device category for the last 30 days. Which source/device combinations generate the most revenue, and which have the highest average purchase value? Flag any combination with high sessions but zero purchases.
Analyze cohort retention for the last 8 weeks. Show weekly active users as a percentage of cohort total users for each week after acquisition. Identify which acquisition week had the strongest retention and what channel drove those users.
How much does it cost to connect GA4 to Lovable using Windsor.ai?
Windsor.ai offers a free forever plan with 1 data source and 1 account; no credit card required. If you need more data sources, paid plans start at $19/month. Lovable requires a paid plan to use Custom MCP connectors.
Do you have helpful links to get started with integrating Google Analytics 4 and Lovable using Windsor.ai?
Yes, we have helpful resources to help you get started. You can explore our official documentation and tutorials for seamless GA4 to Lovable integration with Windsor.ai:
Tired of manual Google Analytics 4 data exports? Try Windsor.ai today to automate your reporting

