 AI insights
 About us
 Careers
 Security
 Customer reviews
 Contact us
 Affiliate program
 Solution partners
 Looker Studio templates
 Tableau templates
 Facebook Ads templates
 Google Ads templates
 Data fields & Metrics
 API documentation
 Product documentation
 Case studies
 Data models
 Blog
Blog Product updates
 Windsor vs Supermetrics
 Windsor vs Fivetran
 Windsor vs Portermetrics
Connect X Ads (Twitter) to Looker Studio


Boost campaign performance with X Ads to Looker Studio integration
Integrating X Ads with Looker Studio via Windsor.ai gives you instant access to ad performance insights with zero manual effort. Unlock powerful visualizations and make faster, data-driven decisions with benefits like:

Automate reporting
Automate reporting
Windsor.ai automatically syncs your X Ads performance data into Looker Studio—no CSVs, APIs, or manual scripts required. Track conversions, evaluate campaign performance, and access always-fresh metrics updated on your schedule.

Unify data across channels
Unify data across channels
Merge X Ads data with insights from 325+ platforms such as Google Analytics, Meta Ads, and HubSpot. Gain a cross-channel view of marketing performance to see how X contributes to overall ROI and customer acquisition.

Increase conversions
Increase conversions
Using Windsor.ai connector to import data from X Ads into Looker Studio
Integrating X Ads with Looker Studio often requires complex setups, manual exports, or expensive third-party tools. Windsor.ai removes these barriers with a fast, affordable, and fully no-code solution.
Our ETL connector seamlessly syncs your X Ads data with Looker Studio in just a few clicks, delivering real-time insights for ad performance tracking and advanced cross-channel marketing analytics.

How to connect X Ads to Looker Studio in Windsor.ai
Make sure you have the following prerequisites before setting up the connector:
- X Ads account (Visit our privacy policy and terms of use)
- Google account for Looker Studio integration
- Active Windsor.ai account
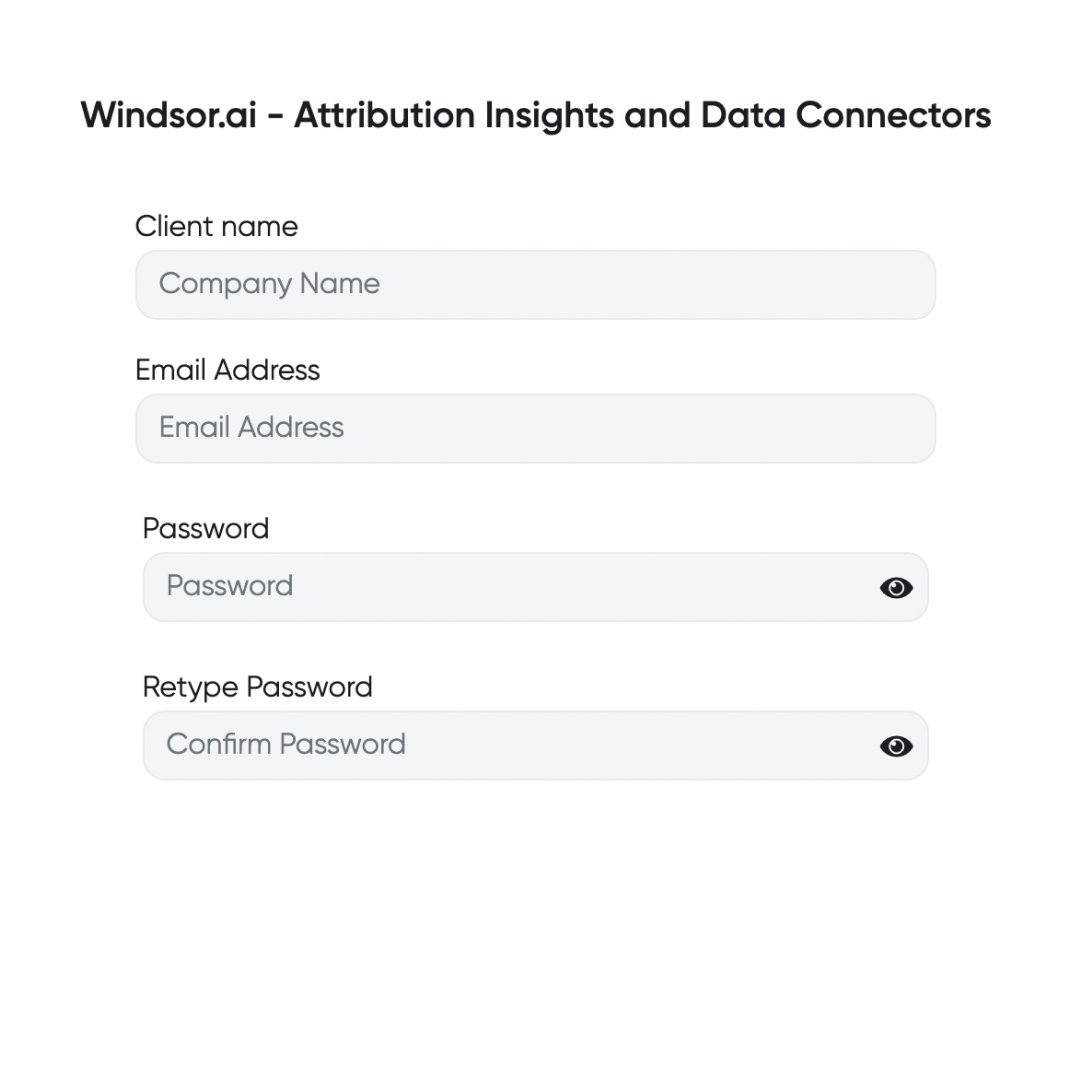
Register and log in to Windsor.ai
Create a new Windsor.ai account or log in if you already have one.
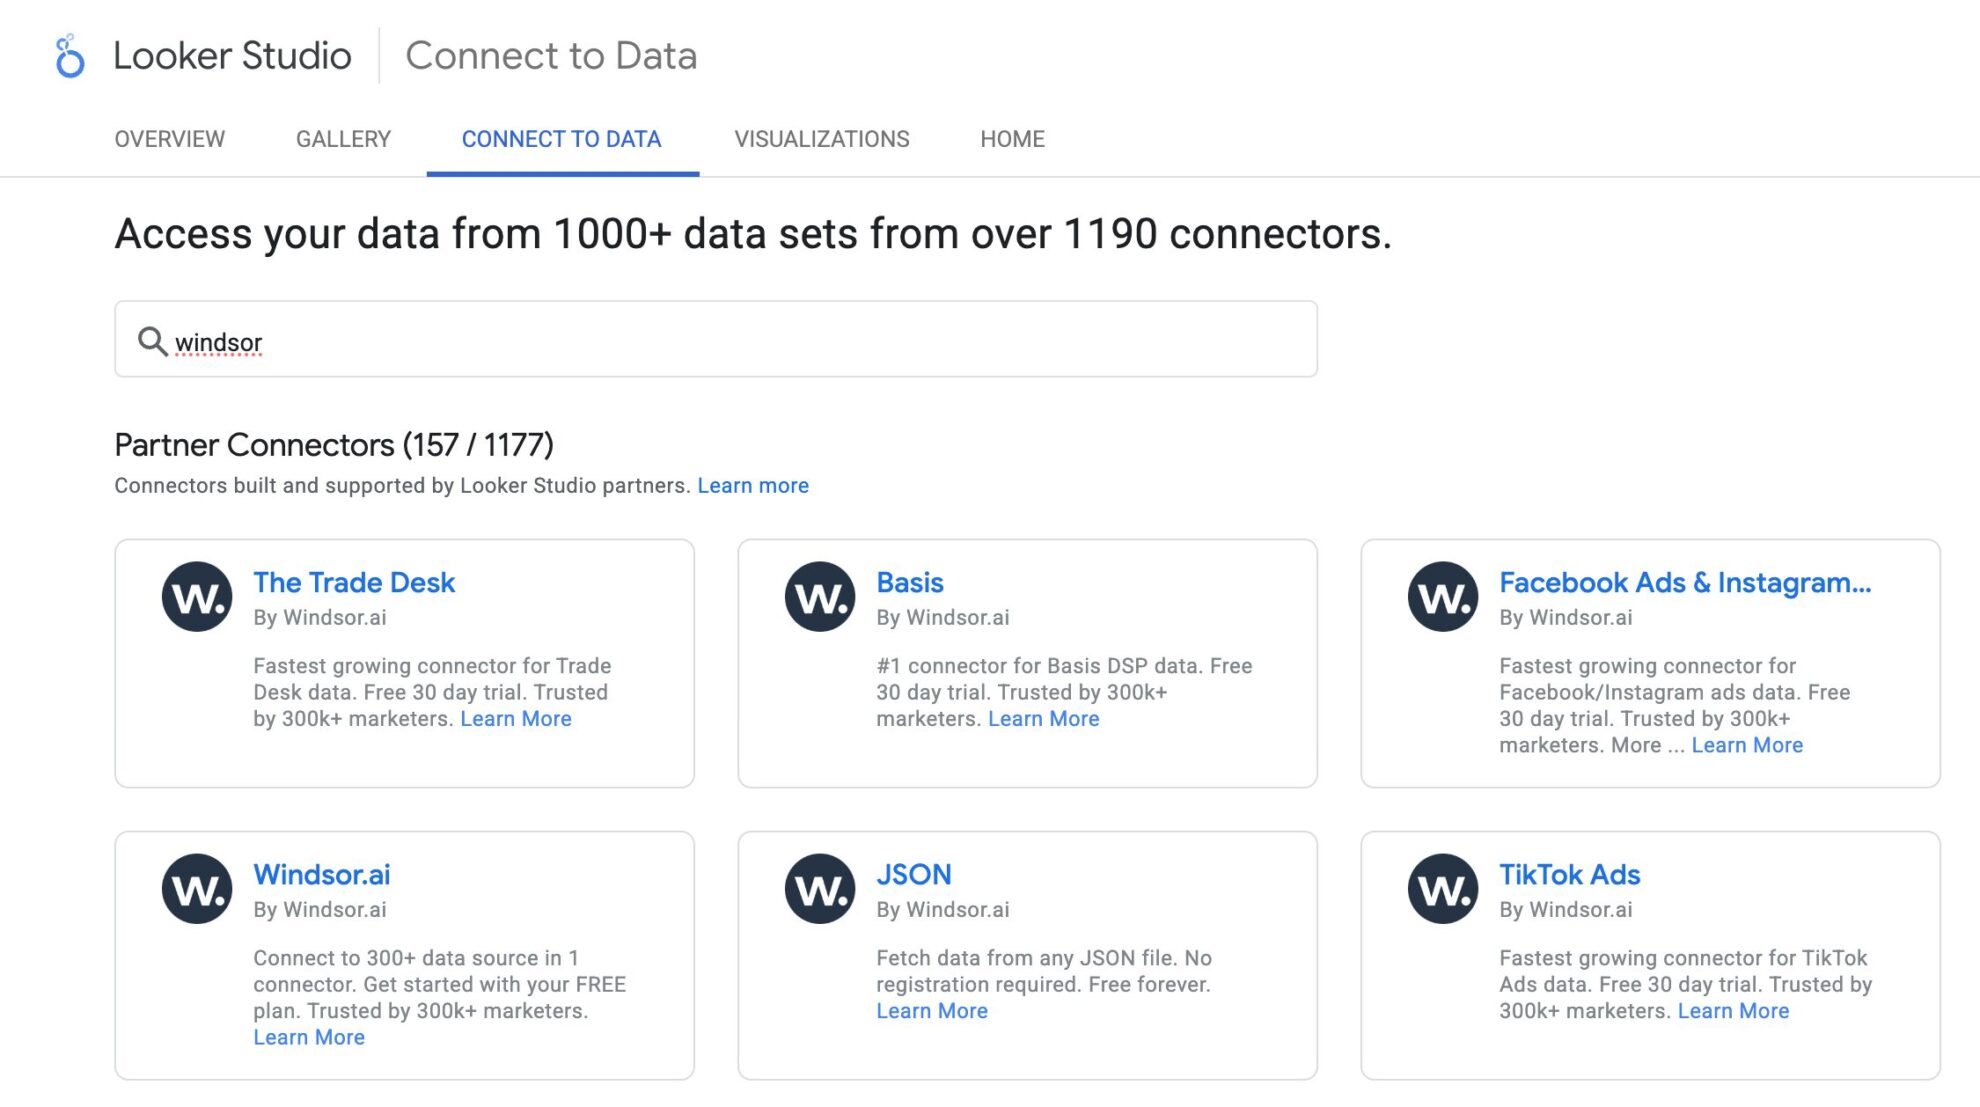
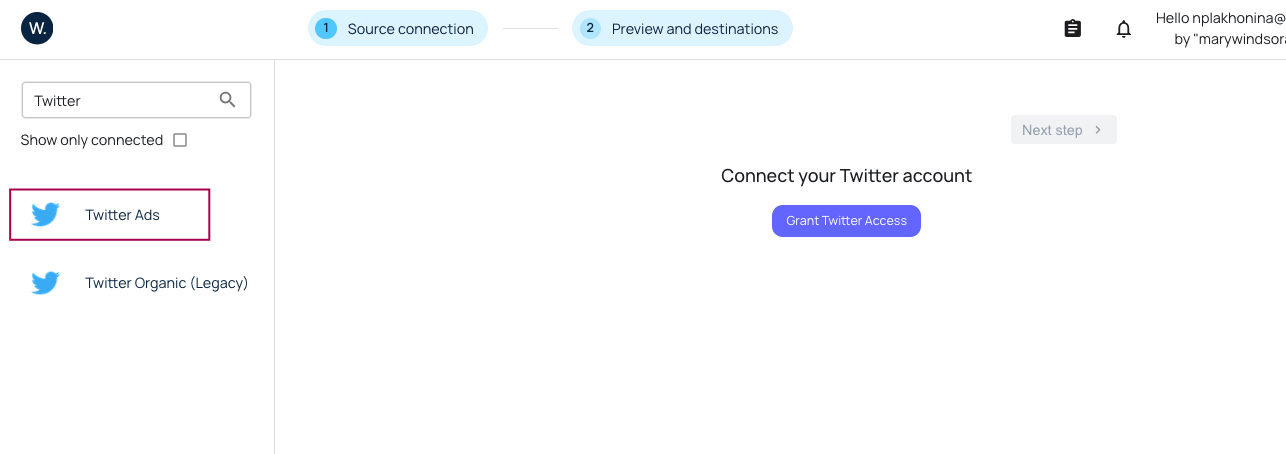
Select your data source
Choose Twitter Ads as your data source and grant access to Windsor.ai.
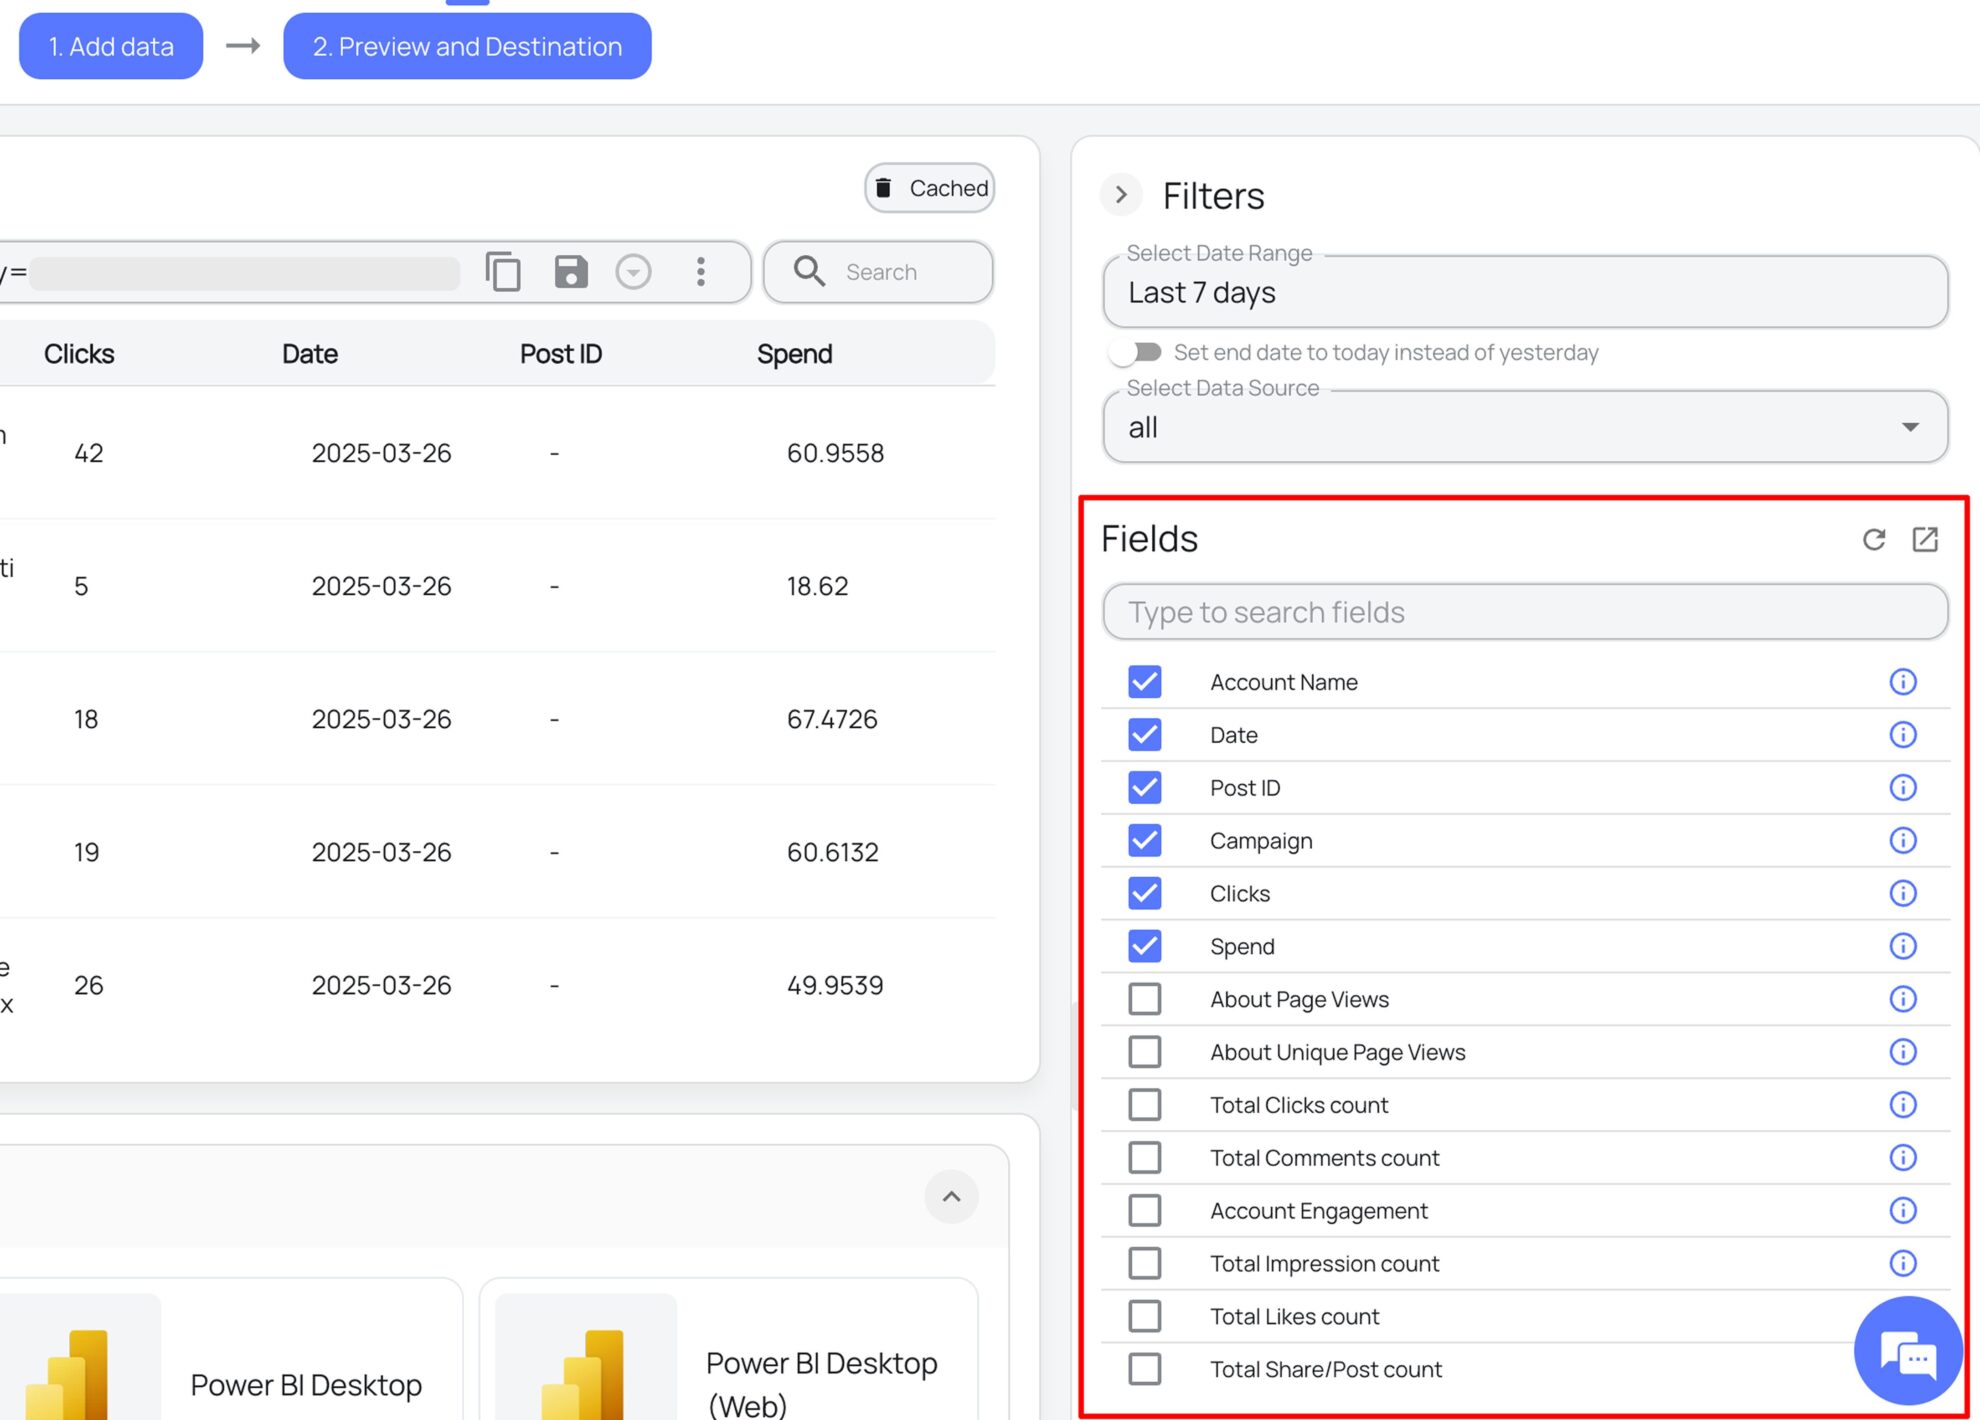
Select the reporting metrics and dimensions
Choose the X Ads fields you want to import into Looker Studio on the right side.
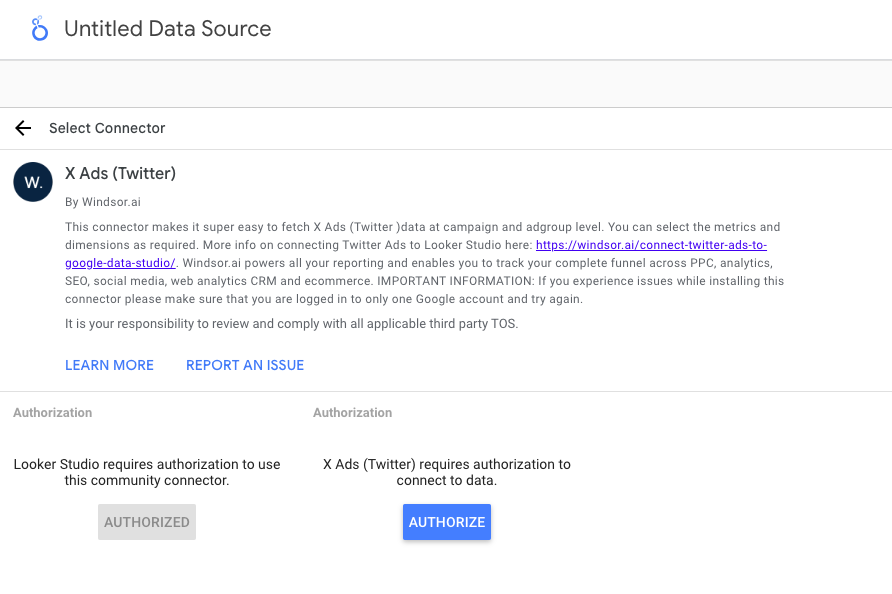
Connect the Looker Studio connector and sync data
Select the Windsor.ai X Ads Looker Studio Connector. Click “Authorize” and log in with your Windsor.ai credentials. You will be redirected to the connector again. Choose your X Ads account and click “Connect.” Then, click “Create Report.”
FAQs
What is Looker Studio?
Looker Studio is a free Google data visualization and business intelligence tool, bringing together data from multiple sources like CRMs, Google Analytics, marketing platforms, and spreadsheets to turn raw data into dynamic charts, graphs, and tables for detailed analysis. With Looker Studio and Windsor.ai integration, you can automate reporting, customize metrics to suit your business goals, track key performance indicators, and connect with other Google Cloud tools for enhanced analytical operations.
Do you have helpful links to get started with integrating X Ads and Looker Studio using Windsor.ai?
Yes, we have helpful resources to help you get started. You can explore our official documentation and ready-to-use templates for seamless X Ads to Looker Studio integration with Windsor.ai:
How much time do I need to create the X Ads and Looker Studio integration?
Using Windsor.ai’s no-code ETL connector, you can integrate X Ads with Looker Studio in a few minutes, benefiting from a quick and stress-free setup process.
How much does it cost to integrate X Ads into Looker Studio with Windsor.ai?
Windsor.ai’s pricing for X Ads to Looker Studio data integration can vary depending on your use case and data volume. We offer transparent pricing plans tailored to diverse business needs and budgets.
Tired of manual X Ads data exports? Try Windsor.ai today to automate your reporting

