Data blending is a significant reason analysts choose Looker Studio, But what is data blending? The feature enables analysts to combine data from multiple sources when creating Looker Studio reports. While Looker Studio simplifies the creation of data blends, it has some limitations, which we will discuss herein. We will also show you how to overcome the data blending limitations using Windsor.ai no-code data integration tools. Before that, we focus on why data blending is a big deal.
What is data blending?
Data blending combines data from multiple sources to create a comprehensive, unified view of your data. In the data blending definition, we used the word “combining,” but you will also encounter other terminologies like joining, merging, appending, and integrating data. Linguistically, the terminologies have the same data blending meaning: bringing multiple data sources into one view. However, there are critical differences between the terminologies in the world of data. We will clear the differences.
What is the difference between data blending and joining?
Data joining
In comparison of data blending vs join, data joining is straightforward. Under this method, you combine two datasets based on a shared variable, field, or dimension. The joining field mustn’t contain duplicates, and the data must have the same structure.
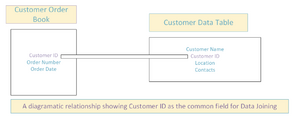
An excellent example of data joining is combining your order book and customer data using the Customer_ID. Since the Customer_ID is a common field in your two tables, and each Customer_ID is a unique identifier, you join the two tables to analyze orders or sales per customer. See chart below:

Data joining adds a column to the table based on your model specifications.
One fact you must notice about data joining is that only matched data ends up in your combined dataset. Depending on whether you selected the exact or approximate match, you may still need to check the quality of the data join. The limitation is you lose data that is not matched from at least one of your tables, affecting data completeness and accuracy.
Data blending
Data blending includes data joining and more. With data blending, you have more flexibility in combining datasets. For instance, the common field you choose for data blending can have duplicates like in the example of the Date field. With data blends, you decide what happens to the data without exact or approximate matches.
With data blends, you can bring more data to your unified view, but it can also have many inaccuracies. That means you may be forced to go back and do lots of data cleaning. The effort required to clean your data blends depends on how well you understand the process of combining the data and your metrics and dimensions. Due to these limitations, consider data blending as your first step in exploratory data analysis.
What is the difference between data integration and data blending?
Data integration’s purpose is the same as data blending, to the extent that it creates a unified view of your data. However, the results of data blending and data integration are different.
Data blending combines datasets to conduct precise analytics with particular dimensions and metrics. Simply put, the amount of data you can combine through data blending is limited.
Data integration involves pulling or extracting data from multiple sources. It is conducted using special tools or application integration interfaces (API). That means data integration is more technical than data blending; sometimes, the user may require some technical knowledge in data management. However, today, there are special no-code data integration tools like Windsor.ai that you can rely on for easy data integrations.
What is an example of data blending?
Consider the data blending example of a business running multiple advertising campaigns online. The company uses Google Ads, Bing Ads, Facebook Ads, X (formerly Twitter), TikTok, YouTube, Instagram, etc. Each campaign is run on all the platforms at the same time. Sometimes, there are little variations in the dates when the campaign is posted on the platforms. Since all the platforms are part of the company’s digital marketing strategy, the marketing manager wants to analyze the data in a unified view, so they must consider data joining, data blending, or data integration tools.
The first step in analyzing the data would be extracting the data tables. For most or all the platforms, you can export data to .csv files and process it using a spreadsheet tool like Microsoft Excel or Google Sheets. If you have so many data sources, or your data runs into tens of thousands of data rows, good luck with the manual data extraction process.
The second step is combining the datasets. If you manage to download all your data in data tables, you have to combine them. So, you consider all the available alternatives for combining data.
The first alternative is data joining. You must consider your data fields to identify the field containing unique information without duplicates, and the data structure must be the same. Since all your data is from primary campaigns, you realize the difficulties of finding a field that contains unique IDs across the tables. Besides, the data from different apps comes in various table sizes and structures, so you can’t merge or append the data tables. When you don’t find a common field that meets the requirements of data joining, you must focus on the second alternative of combining data.
The second alternative is a data blending tool like Looker Studio. Since the rules of data blending are less stringent than those of data joining, you notice the date column in all your data tables. So you choose to combine data using the data blending tools in Looker Studio, but the platform limits your data sources to five. Furthermore, each data table can only have up to ten dimensions and metrics. You could drop a few of your data sources, but you don’t want to do that. Because you have 7+ data sources, as in the example, and you want all your data without dropping any metric or dimension, data blending can’t help you. What next? You consider the third alternative.
The third alternative is data integration. Data integration is the only way to work with all the data from all the sources. Data integration also does not limit the metrics and dimensions you can include in your data tables. Simply put, a data integration tool like Windsor.ai enables you to integrate data from 304+ data sources, and you don’t need any coding skills. Therefore, data integration tools are the only option for the marketing manager in our example. After integrating the data, they can analyze it in Looker Studio.
Benefits and use cases of data blending
If your business is data-driven, you cannot afford to do without data blending. Here are the benefits and use cases of data blending:
Data blending benefits
No coding skills required
Data blending does not require coding skills, making it useful for business self-service data analytics. Your analysts can easily create the data blends they need for their analytics using any no-code tools.
Rapid ad hoc reporting
Data blending is particularly useful for rapid ad hoc reporting. The analyst simply combines the tables that suit their data needs for that specific moment. The analysts can create the data blends quickly.
Powerful data visualization and reporting
Analysts create data blends specifically for data visualization and reporting. Data blending enables the creation of powerful visuals from multiple datasets, enabling comparisons and advanced scenario modeling. The results are data-driven decisions that are also timely.
Enhanced collaboration
A critical note about data blends is that they don’t result in any changes to the underlying data source tables. Sometimes, the analyst may be unable to save the data blends for reuse in different reports. That said, data blends enable collaboration because different datasets can create various data blends from the same primary data.
Data blending use cases
Data blending is helpful in various business areas, including:
Marketing Analytics
Since organizations run marketing campaigns on multiple channels, they require data blending to analyze campaign performance. Data blending is essential in marketing because various data sources are presented in numerous structures and sizes.
Customer data analytics
Various data collection apps, including CRM and sales apps, are used in customer data analytics. Organizations seeking to optimize their data operations leverage specialized data governance consulting services to implement standardized data collection and analysis frameworks. Analysts can use data blends to combine and analyze data stored on these apps.
E-commerce data analytics
E-commerce platforms are data-intensive. Data is captured digitally, usually in different apps. Commerce businesses require data blending to analyze various industry aspects, including marketing channels, sales channels, order fulfillment, and other aspects of their operations.
How does data blending in Looker Studio work?
Before showing you how to blend data in Looker Studio, we explore the key concepts you will encounter when using the platform.
Join operators and join conditions in Looker Studio
Join operators
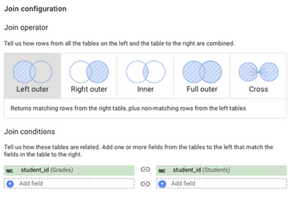
Join operators are rules you specify about combining data from tables. Specifically, the rules affect how you deal with matching and non-matching data rows from your tables. Here are the join operators used in Looker Studio data blending:
Right outer join
The right outer join operator returns all the data from the table on your screen’s right side and matches data rows from the table on the left side. Any non-matching rows on the left side are dropped from the data blend. The right join operator enriches the right-side table with additional data from the left-side table. You use it to analyze all the data on the right-side table plus additional data from the left table.
Left outer join
The left join operator is the direct opposite of the right join. It returns all the data from the left table plus matching data from the right-side table. All non-matching data rows from the table on the right will be dropped. This operator enriches the data table on the left side of your screen.
Outer join
The full outer join ensures that all your data is combined. The data blend will match all matched rows from the tables. All non-matching rows will also be included in your data blend, but you will notice many blanks where the data does not match.
Inner join
The inner join operator returns only the matching data rows from the right and left tables. This means all matching data rows, based on your join key, will be included in the data blend. All non-matching rows from both tables are dropped.
Cross join
The cross-join returns all possible combinations. It is highly exploratory. If the first table has A data rows and the second table has B, the total number of rows returned in the data blend is A×B. That is because the program will be attempting to match all data rows. Cross-join is useful in exploratory data analysis.
Join conditions
Join conditions refer to the data fields and functions you select for combining data tables. They are also called join keys. You can only combine two tables at a time. For every two data tables, you must select a join condition, a common field between the two tables. You can use different join conditions to create data blends when combining more than two tables.
How to blend data in Looker Studio
You can blend data in Looker Studio by following seven simple steps:

Step 1: Add data
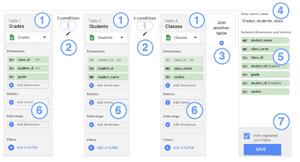
You add data by connecting Looker Studio to your data sources, such as Google Ads and Facebook. For the data blend, you need at least two data tables and a maximum of five. Ensure all your data sources are added before proceeding to the next step.
Step 2: Select the metrics and dimensions to use for each data source
Looker Studio allows you to use up to ten fields per data source or table. Ensure that your join key data field is available in the metrics and dimensions you select for each data table.
Step 3: Create your data blend
Start by selecting your first data table. Then, go to the My Resource tab, click Blends, and Add Blend. With your chosen primary table, click Join Another Table and select your second table.
Step 4: Join Configuration
The Join Configuration window opens, showing the different types of Join Operators. If you still need to decide which operator to use, select the Full Outer operator.
Step 5: Join Conditions
At the bottom of the Join Configuration window, you select the Join Conditions, stating how the tables are related. You do so by identifying the common data field in your selected tables. You can choose more than one field.

Step 6: Save
You click save at the bottom of the Join Configuration window, which saves your data blend in Looker Studio.
Step 7: Create your Looker Studio report
The last step is to create reports using your data blends. You locate the data blends in the My Resources tab and then make your first report by creating the required charts and visuals.

Limitations of data blending in Looker Studio
While Looker Studio is a resourceful tool for blending data, it has various limitations, including:
Limited number of blended sources
You can blend up to five tables with up to ten fields each. That number is small and highly limiting, mainly if you use a lot of business applications in your organization.
Loading and processing time
Blending data in Looker Studio can be slow because it relies on APIs to connect the data sources and create the data blends. Your network and computing speeds can further affect performance.
Blends are not reusable
You cannot reuse or share your data blends. They are not saved to the cloud, you cannot download the blended tables, and you can’t share them. The data blends are only embedded in the report produced.
Reliance on third-party connectors
Part of the reason why Looker Studio data blending is slow is its dependence on third-party data connectors. Except for a few native Google data sources, most use third-party connectors.
Steep learning curve
Blending data on Looker Studio is similar to exploratory data analysis. Data blending can be highly complex for the untrained eye, and the learning curve is steep. The complexity increases because the data sources can be highly disparate, with the only standard fields being dimensions like country and date. That can be overwhelming for the analysts.
Overcoming the limitations of Looker Studio data blending using Windsor.ai
The best way to overcome the data blending limitations in Looker Studio is by using Windsor.ai.
Windsor.ai is a no-code data integration platform. It gives you more data blending options than Looker Studio. First, you can blend more than five data sources at a time, and you won’t have limitations on the number of data fields you include in your tables. Most importantly, you can save your Windsor.ai data blends for sharing and reuse. Windsor.ai gives you access to more than 304 data source connectors.

Overcoming the limitations of Looker Studio data blending using Google Sheets
Another alternative that you can use to overcome the limitations of Looker Studio data blending is Google Sheets. However, you must know that data blending using Google Sheets is manual and cumbersome. You have to download all your data to Google Sheets, use different sheets to create a workbook, and combine the data into one table using formulas like VLOOKUP, INDEX, MATCH, and IF conditions. Apart from the requirement to use formulas, which can be complicated depending on your data, you should know that you will need help working with large datasets, and blending your data can take a long time. Blending data using Google Sheets is only practical if you have a few data sources and the amount of data in each file is small and can be handled by your computer’s processing power.
