 Destinations
 Data sources
 AI insights
 About us
 Careers
 Security
 Customer reviews
 Contact us
 Affiliate program
 Solution partners
 Template gallery
 Looker Studio templates
 Power BI templates
 Excel templates
 Google Sheets templates
 Tableau templates
 Facebook Ads templates
 Google Ads templates
 Data fields & Metrics
 AI prompt library & Guides
 Product documentation
 API documentation
 Case studies
 Blog
Blog Data models
 Windsor vs Supermetrics
 Windsor vs Funnel.io
 Windsor vs Fivetran
 Windsor vs Rivery
 Windsor vs Portermetrics
 Windsor vs Coupler.io
 Last updated: 7 September 2026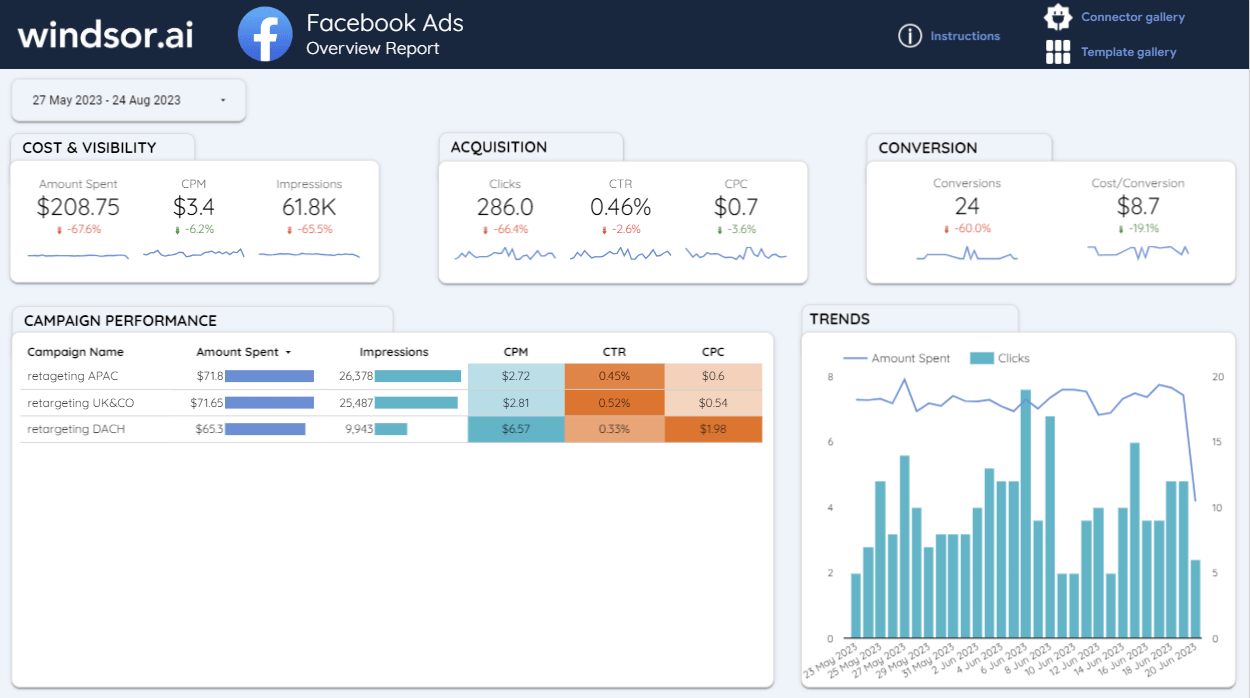




This template helps you to visualize your Facebook Ads performance in Looker Studio in a few clicks.
Follow the steps outlined below to get your data connected.
How to use it
- Click on this link to open the template
- Make a copy of it (File -> Make a copy)
- For the new data source select CREATE NEW DATA SOURCE
- Under COMMUNITY CONNECTORS, go to EXPLORE CONNECTORS. Search for “Facebook Ads by Windsor.ai” and add the connector.
Get started for free
Access all your data from your favorite sources in one place.
Free forever plan, no credit card
How to customize Facebook Ads (Meta) Looker Studio Template
You are free to customize it as you wish, it is possible to add charts and tables to your report, to create new reports, to make different versions of the same report and more.
Not only will Looker Studio present the data from your Facebook Ads Manager visually, making it a lot more presentable and useful for people who are not directly involved in the campaigns, but it also gives you the ability to perform more detailed analyses and recognise patterns and trends that might escape your eye.
Add Charts and Tables to Your Report
Charts are vital to reports and nicely placed, informative charts can make a huge difference. If you wish to add charts to your Facebook Looker Studio, you need to do the following. Go to “Edit your report” and then go to the page of the report where you wish to place the chart. Go to the toolbar and select “Add a chart”.
Choose the chart that you want to add and then click the canvas. Now the chart is in the report and if you like you can move them around or resize the charts that you have.
There are different types of charts that you can add to your report – pie charts, bar charts, and many more. Once you’ve added charts into Looker Studio you can play around in the report, change styles, colours and make your report a lot more visual.
The process for adding tables to your report is pretty much the same, you just need to select a table after you select “Add a chart”.
Filter the Data in Your Report for Facebook Campaigns
You can control the data that you export from Facebook Ads Manager, but it is also possible to filter the data in your Looker Studio report and the process is quite simple.
Go to edit your report, select the chart or charts that you wish to apply a filter to and then select the appropriate tab in “Properties”. Click on “Create New Filter” and name it. It is also possible to use an existing filter. By selecting Include or Exclude you choose whether the data that meets the criteria is to be analysed or is to be excluded.
Then you can configure your filter and select the dimensions or metrics that are to be filtered. You can use comparison operators like greater than, smaller than, contains, etc. You can add an And or an Or clause as well. Finally, when you’re happy with your filter criteria, click “Save”.
It is possible to reuse old filters and edit and amend previously saved filters.
Customisation Options and other Advanced Settings in Looker Studio Facebook Ads
The level of flexibility and customizability is what makes Looker Studio the optimal Facebook Ad reporting software. Not only can you add charts and apply filters, you can also add fields to charts, switch chart type, and edit chart properties.
You can also add other components to the report, just utilise the icons that show on the toolbar and you will get the opportunity to add other components.
In addition to charts you can also add interactive elements like date ranges, data control and customise how the data is displayed in your reports.
You can also add other visual elements like text boxes, lines, circles, images and a lot more. Furthermore you can also add external content pieces like videos and other external web resources.
Get started for free
Access all your data from your favorite sources in one place.
Free forever plan, no credit card
Facebook Ads metrics list and explanation
One of the greatest reasons why Facebook is such a useful and popular marketing tool is the fact that it comes with a wide range of metrics. The list is really long and diverse. So, we will go through each group of metrics and explain what they report on, and why they are important for the Facebook Ads reporting tool, in this case, Looker Studio Facebook.
See complete Windsor.ai’s field list documentation here
Performance metrics
It is pretty self-evident why these are the most important metrics. And we will start with the most important performance metric, which is of course – Results.
When we analyze results in Facebook Ads Looker Studio report we need to understand that a result is defined as the desired outcome of your campaign and the results metric shows the total number of times this result has been achieved. So the basic result is a total and not a percentage metric.
It is the most obvious metric, any boss or CEO will ask about it, but perhaps more important than measuring the results is setting up the right results metric. Different Facebook campaigns come with different goals and thus the result metric will reflect that.
In most cases, results will be tied to a conversion like leads, purchases, first-time depositors, etc, but if the campaign in question is an awareness campaign, you might look at visits or even impressions as a potential campaign result.
Conversions
Leads, website purchases, and leads that come through a form, also known as form leads are common results, but the so-called custom conversions are what interests most marketeers.
Namely, there are dozens of types of conversions and it all depends on the nature of the business and the services and products that it sells – so it can be downloads, subscriptions and all of these can be tricked by the Facebook pixel.

Cost per result
One more advanced way of measuring the specific performance of a campaign is the cost per result. This will be quite useful if you export Facebook Ads Data to Google Sheets but also export data from other marketing channels.
That way you’ll be able to compare the results of your Facebook campaigns with the results of the campaigns of the other channels and see how profitable Facebook is compared to your other marketing channels.
With the cost per result metric, the cost of the campaign is divided by the number of results, so you’ll get a good understanding of how much each new customer costs for instance.
If you’re using a clear conversion metric you’ll know easily what would be the desired value of each customer for the acquisition to make sense from a financial perspective. Each industry has its own benchmarks when it comes to cost per result for particular custom conversions.
CPA
In many industries and/or particular campaigns this metric is known as CPA – cost per acquisition, which particularly stands for acquisition campaigns.
Then we have conversion rate, also known as result rate which compares the number of conversions to the total number of impressions. In other words, if an ad or a campaign had 100 impressions in total and five of them converted (became successful results) then the conversion rate of the campaign is 5%.
Spend
Next, we have the metric that is of interest to every finance department – spend. And this is a pretty straightforward metric, it tells us how much a campaign, an ad or an ad set has spent over a given period of time, in other words, what is the cost.
While on its own it may not mean much, it is useful because every marketer usually works with a budget so this metric tells them what is left. Also, in conjunction with other metrics, it tells us pretty much everything.
The return on ad spend is the most profit-oriented metric, it basically tells us how successful a campaign has been. This metric, also known as ROAS tells us what amount or revenue have we received for every dollar that was spent on ads.
Now, this only works if your revenue is reported to Facebook. If you’re getting it from another source, you can still use it to calculate your return on ad spend, or return on investment in conventional marketing, but you will need to import those numbers, use blended data view and have them into your reports.
Delivery metrics
The next section of performance metrics are the so-called delivery metrics and these include:
- Impressions
- CPM
- Frequency
We’ve already mentioned them. Impressions represent the number of times your ad has been shown to your target audience. Impressions are not the same as reach, impressions give you the total number of times the ad has been seen, whereas reach is the number of people that have seen it.
Notice that someone might see it more than once. If there’s a big discrepancy between impressions and reach, there might be something that’s off with your campaign.
CPM is a metric that is a combination of two more basic metrics – cost and impressions. Or to be more precise, CPM tells you how much you have paid to get 1,000 impressions, i.e. how much it costs to get your campaign shown 1000 times.
This is a very indicative metric, and marketers like to compare current CPM with the one they got on campaigns a month or a year ago. A higher CPM is usually an indication that there’s something wrong with the campaign.
Now the frequency is a very interesting metric. It tells you how many times a person has seen your ad. Regardless of how you set your target audience, there will be people who will see your campaign more than once.
The higher the number of people and the number of times, the higher the frequency will be. Higher frequency usually results in higher CPA, so if your CPA has increased it is useful to check the frequency.
If one potential customer sees the ad too many times, you are obviously oversaturating your audience.
Engagement metrics
Engagement as the word itself indicates how your readers engage with your campaigns, with your ads, and with your brand in general. Likes, comments, clicks, and shares are the typical metrics used to track engagement.
Now, this is really dependent on the type of campaign, but also the industry and your general audience.
If you’re doing more organic and natural Facebook or you are more focused on an organic audience, you are likely to get more engagement, but that also depends on the industry. If your niche is more technical you won’t get a lot of engagement, but that is fine.
Page posts metrics
These metrics are less important if you’re looking into Facebook Looker Studio and more important if you’re doing organic Facebook. These metrics are only available if you’re doing posts and have over 100 likes on your page. So, if you’re doing just Facebook Ads Looker Studio this might not be the most relevant type of metrics for you.
Messaging metrics
Since a while ago it has been possible to run ads and campaigns on Facebook messenger. Now, what does this mean if you’re a Facebook marketer? Well, it means simply that you can measure the success of your marketing attempts on Messenger.
For instance, if you have spent thousands on Messenger ads and you had only two Messenger conversations started as part of the campaign, then perhaps that isn’t a successful campaign.
Clicks metrics
This is a very specific type of Facebook metric. It tells us not how many people have seen an ad, not how many people have converted as a result of it, but rather how many people have clicked on it.
To put it as simply as possible, a click is more than an impression but less than a conversion. So, if you measure impressions you’ll know how good the setup is, if you measure impressions vs conversions you’ll know how enticing the offer is and how well your ad matches the customer intention, but the clicks tell you how enticing your ad is, both visually, as well as verbally.
If your click metrics are good, but you fail on conversions, then maybe it’s the offer that’s just no good.
Awareness metrics
These are perhaps the most specific metric. It may seem like they don’t show anything exactly, but that’s not the case. Brand awareness simply means – how familiar your customers and potential customers are with your brand. The goal here is to show the ad to someone who is more likely to remember it and recall your brand. These metrics can be great indicators of your future success.
Breakdowns or dimensions
Facebook is also capable of breaking down your campaigns per different parameters. So, for instance, it can show you which ad or ad set has been the most successful one in a given ad set, or a campaign, respectively. In general, you should not take these things for granted, but they are a pretty strong indicator of things.
If you are interested in integrating other channels or your analytics data together with your Facebook Ads data, please check out our Marketing Template Gallery.


